Abstract
Vascular anastomosis –the fusion of vessels from two distinct branches of the vascular system – represents a critical step in vascular growth under both healthy and pathological conditions, in vivo, and presents an important target for engineering of vascularized tissues, in vitro. Recent works in animal models have advanced our understanding of the molecular and cellular players in vascular anastomosis, but questions remain related to cellular dynamics and control of this process, in vitro. In this study, we exploited a three-dimensional (3-D) culture platform to examine the dynamics of endothelial cell (EC) during and after vascular anastomosis by allowing angiogenesis and vasculogenesis to proceed in parallel. We show that anastomosis occurs between sprouts formed by angiogenesis from an endothelium and tubes formed by vasculogenesis in the bulk of a 3-D matrix. This fusion leads to highly connected vessels that span from the surface of the matrix into the bulk in a manner that depends on cell density and identity. Further, we observe and analyze intermixing of endothelial cells of distinct origin (surface versus bulk) within the vessels structures that are formed; we provide evidence that the cells migrate along pre-existing vessels segments as part of this intermixing process. We conclude that anastomosis can occur between vessels emerging by angiogenesis and vasculogenesis and that this process may play an important role in contexts such as wound healing.
Introduction
Vasculature is indispensable in higher organisms as it transports metabolites, waste products, and immune cells to sustain and protect tissues. In adults, angiogenesis – the sprouting of new vessels from pre-existing vasculature – occurs in response to physiological stimuli during, for example wound healing and the menstrual cycle.1,2 However, an imbalance in the stimulating and inhibiting cues for vessel growth can lead to pathological angiogenesis, implicated in a variety of diseases such as cancer and diabetic retinopathy.3
Currently, a broad variety of models both in vivo and in vitro are being used to study angiogenesis.4 In the past three decades, studies have begun to elucidate the major molecular5 and cellular players6, signaling pathways7, as well as cellular dynamics8–11 involved in angiogenesis. As our understanding of angiogenesis develops, it has become a target for a variety of therapeutic strategies, with both pro-angiogenic and anti-angiogenic drugs in the clinic and under development.2,12,13
In the context of regenerative medicine, the possibility of growing living tissues in vitro followed by implantation holds promise as a route to repair damaged tissues and correct congenital defects. Clinical successes of this tissue engineering strategy include: skin section replacements14, bladder replacements15, and large scale arterial or venous grafts in cardiovascular diseases16. Generalizing this approach to larger tissue constructs and full organs17 poses significant, outstanding challenges which include 1) appropriate physiology on both macroscopic and microscopic scales (e.g. suitable sources of cell and biomaterials); 2) proper maintenance during in vitro culture; and 3) compatibility with surgical implantation (e.g. surgical connections from engineered tissue to host). In many contexts, the induction of vascularization of scaffolds represents a particular challenge in tissue engineering as the oxygen depletion length (the distance over which oxygen can diffuse before being consumed, known as the Krogh length18,19) requires that capillary vessels in living tissues be within 50–100 μm of one another. In vivo, vascularization occurs via two processes: vasculogenesis, the spontaneous formation of capillaries from individual endothelial cells (ECs) and sprouting angiogenesis, the emergence of new vessels from pre-existing ones.20 Both of these steps require anastomosis, the fusion of vessels segments to eliminate dead-ends and allow for blood circulation. The growth of clinically relevant tissues in vitro similarly requires the formation of blood vessels and their anastomosis in order to provide closed blood circulation on all scales, from the surgically accessible dimension (1–2 mm)21 and down to capillary dimension.
Many investigators have contributed to our understanding of vascularization, specifically anastomosis, by utilizing different models both in vivo and in vitro. Some studies deserve particular attention: early work by Levenberg et al.22 and Koike et al.23 showed that capillaries could be grown in 3-D matrices in vitro and that these capillaries spontaneously connected (anastomosed) with host vasculature and became functional after implantation in mice. However, these approaches are constrained with respect to the cellular density and dimension of constructs prepared in vitro by the diffusion of oxygen (the Krogh length). A recent study by Cheng et al. utilized both in vitro technique and in vivo model to provide insights in mechanical and biomolecular mechanisms involved in anastomosis.24 Additionally, several studies have looked at vascular networks in vitro in a format of 3-D microfluidic devices.25–31 Specifically, Chrobak et al. and Zheng et al. have successfully demonstrated large-scale, 3-D, perfusable vascularized tissue in vitro; these studies represent a step toward fabrication of thick tissues based on the creation of microvessels that can traverse macroscopic distances and provide connections for the delivery of nutrients and blood. Nevertheless, it remains challenging to bridge from the fabricated microvessels to pervasive capillary structure. Tackling this challenge could be enabled by the appropriate induction of anastomosis. Distinct approaches have shown the occurrence of anastomosis between two angiogenic sprouting events and perfusion at capillary scale.25,26,28–30 These approaches based on confining micro-scale tissue constructs within microfluidic devices allow tight control of capillary-scale growth processes. However, they are incompatible with engineering of large-scale tissues due to the limited volume of the tissue. These preliminary successes point to the need to understand the dynamics of anastomosis in more detail and for a readily available tool with which anastomosis can be generated in large volumes of tissue. These specific challenges motivated our effort to develop a simple assay to study anastomosis based on parallel action of sprouting angiogenesis and vasculogenesis.
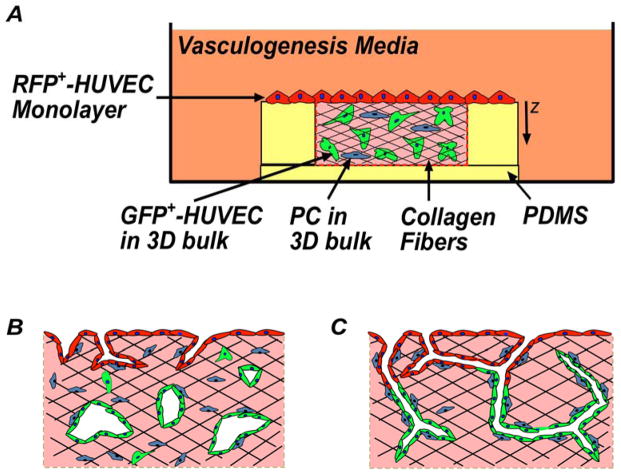
In this study, we exploit a 3-D culture platform32,33 to focus on the cellular dynamics during and post anastomosis (Fig. 1). Our system is comprised of an endothelium seeded on top of matrix of type I collagen of well-defined dimensions and seeded with cells. This design represents a simple mimic of the architecture of the endothelium of a mature vessel adjacent to a cellularized tissue. Our base case was a homotypic co-culture, with endothelial cells (Human Umbilical Vein Endothelial Cells, HUVECs) initially in two distinct sub-populations: on the surface of the collagen and in the bulk collagen. To enable the identification and tracking of these two populations (spatial distribution of cell populations, “population tracking”) we labeled them prior to culture: RFP+-HUVECs in the monolayer and GFP+-HUVECs in the bulk collagen. We also generated heterotypic co-cultures with the incorporation of perivascular cells (Human Brain Perivascular Cells, HBPVCs) in the bulk collagen (blue cells in Fig. 1A). In the presence of pro-angiogenic media, this platform allows for sprouting angiogenesis from the endothelium and vasculogenesis in the bulk collagen (Fig. 1B). Across the conditions shown in Figure 2, we performed immunohistological and fluorescence confocal microscopy; analyzed these images to extract qualitative information about the structure and quantitative information on distributions of individual sub-populations (those originating at monolayer and those originating in bulk); and captured live 3-D images of homotypic co-culture to clarify cell-scale dynamics of migration on pre-existing vessels in bulk.
Fig. 1. Schematic diagrams of anastomosis in homotypic co-culture of endothelial cells.
RFP+-HUVECs (red) form a quiescent endothelium. GFP+-HUVECs (green) and pericytes (blue) in 3-D matrix of collagen (pink). Fibers formed within the collagen (black). (A) Overall experimental set-up, side-view. (B) Sprouting angiogenesis occurs from the endothelium (RFP+-HUVECs) in the presence of pro-angiogenic growth factors. GFP+-HUVECs undergo vasculogenesis. (C) Hypothesis: Anastomosis occurs between sprouting angiogenesis and vasculogenesis. Pericytes are recruited to cover the nascent endothelial cell tubules to provide stability.
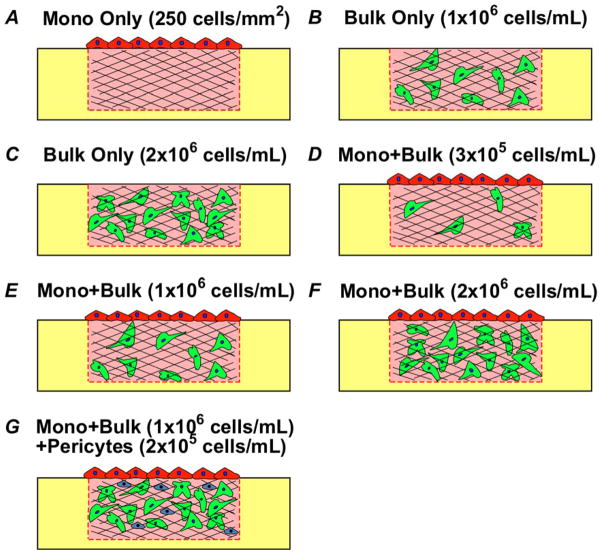
Fig. 2. Schematic diagrams of experimental configurations and conditions.
(A) Monolayer (Mono) only. (B–C) Bulk only, with bulk density of 1×10⁶ cells/mL (B) and 2×10⁶ cells/mL (C). (D–F) Mono + Bulk, with bulk density of 3×10⁵ cells/mL (D), 1×10⁶ cells/mL (E), and 2×10⁶ cells/mL (F). (G) Mono + Bulk + Pericytes, with bulk density of 1×10⁶ cells/mL and PCs density of 2×10⁵ cells/mL.
We exploited this platform to test the hypotheses that 1) vascular anastomosis would occur between sprouts formed from the endothelium and tubes formed by vasculogenesis (Fig. 1C); and 2) this process would depend on the density of cells in the bulk and presence of pericytes. We further exploited the ability to perform population tracking in order to investigate the dynamics of cell migration during anastomosis.
Results and Discussion
Culture configurations
Figure 2 presents the specific configurations used in this study: 1) Mono Only (Fig. 2A) – this configuration represents a confluent monolayer that mimics an endothelium from which angiogenesis will occur upon; 2) Bulk Only (Fig. 2B–C) – this configuration resembles the process of vasculogenesis where ECs self-assemble to form lumenized tubes; 3) Mono + Bulk (Fig. 2D–F) – this configuration allows us to assess the interactions of the two process – angiogenic sprouting from an endothelium and vasculogenesis in the bulk collagen – occurring in parallel; 4) Mono + Bulk + Pericytes (Fig. 2G) – this configuration incorporates PCs in the system, which serves as a comparison to Mono + Bulk as well as providing insights in the effects of PCs on vessel maturation.
Independent angiogenesis and vasculogenesis
We first examined angiogenesis and vasculogenesis individually in this platform. These mono-cultures represent controls for the behaviors we observe in the homotypic co-culture. Previous studies have used this format to study angiogenesis and vasculogenesis, and showed that these two processes can be recapitulated with this specific geometry using a pro-angiogenic media containing vascular endothelial growth factor (VEGF), basic fibroblast growth factor (bFGF) and phorbol-12-myristate-13-acetate (PMA).32–34
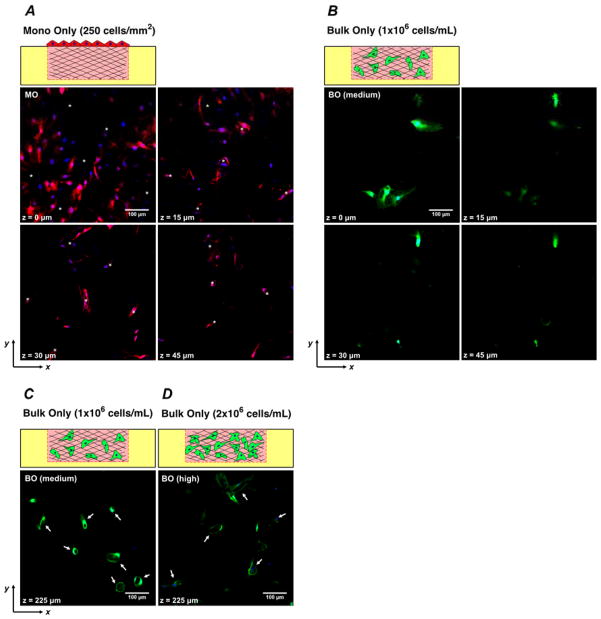
In the angiogenesis model, multi-cellular, lumenized sprouts emerged from the planar configuration of monolayer cells (MCs) into the bulk collagen (Fig. 3A) by Day 7. The horizontal (xy) cross-section of the matrix acquired by confocal fluorescence microscopy in Figure 3A shows that the angiogenic sprouts led by single cells are continuous extensions from the monolayer and the vascular structures are present at all depths up to 45 μm; the greatest depths at which we observed sprouts in this configuration was ~100 μm. In the vasculogenesis model, with bulk cells (BCs) density of 1×10⁶ cells/mL (hereafter referred as “medium”), the cells formed a minimum of vacuoles but did not undergo tubulogenesis (formation of multicellular, lumenized structures) in the bulk collagen by Day 7 (Fig. 3B, Fig. 3C); more extensive vacuoles formed at greater depths (Fig. 3C). At a density of BCs of 2×10⁶ cells/mL (hereafter referred as “high”), the cells formed more, larger vacuoles at small depths (data not shown) and underwent tubulogenesis at greater depths (Fig. 3D). No extended tubes were observed at Day 7. This density-dependence of the vasculogenesis agrees with our previous work32 with this platform and points to bulk density of ECs as an important parameter in tuning the properties of the homotypic co-culture.
Fig. 3. Fluorescent confocal sections of angiogenesis and vasculogenesis monoculture models after 7 days of culture.
(A) Fluorescence confocal micrographs of horizontal (xy) cross-sections of the configuration of Monolayer Only, “MO” at z = 0, 15, 30 and 45 μm depths beneath surface of matrix. (B) Fluorescence confocal micrographs of the configuration of Bulk Only at 1×10⁶ cells/mL, “BO (medium)” at z = 0, 15, 30 and 45μm. (C) Fluorescent confocal image of the configuration of BO (medium) at z = 225 μm. (D) Fluorescent confocal image of the configuration of Bulk Only at 2×10⁶ cells/mL, “BO (high)”, at z = 225 μm. Asterisk: Angiogenic invasion from monolayer with lumenal structures. Arrow: Lumenal structures formed by vasculogenesis.
Anastomosis between the sub-populations of cells
In vivo, angiogenic sprouts from an endothelium, invade into the bulk tissue, and eventually anastomose with a pre-existing vascular network.20,35 However, we are unaware of observation of anastomosis between angiogenic sprouts and tubes formed by vasculogenesis, in vitro. The recapitulation of this process in vitro could provide a basis for rapidly forming connections between engineered microvessels (e.g., [Zheng et al., 2012]) and pervasive capillary structure in engineered tissues. In order to model anastomosis between these two processes, we used a configuration where RFP+-HUVECs were seeded on collagen as MCs (250 cells/mm2) to generate angiogenic invasions, and GFP+-HUVECs were seeded as BCs at medium (1×10⁶ cells/mL) density to undergo vasculogenesis, simultaneously (Fig. 2E).
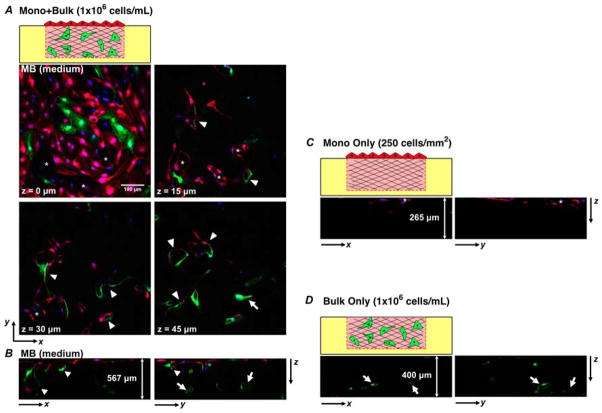
Figure 4A presents fluorescent micrographs that show the qualitative features observed for the medium density of GFP+-HUVECs in the bulk after Day 7 of homotypic co-culture. We observe that BCs migrated upwards and became part of the monolayer (green cells present in monolayer at z = 0 μm). Further, lumenized sprouts formed of MCs emerged from surface (z = 0 μm) and propagated into the bulk (labeled with asterisks at z = 15 and 30 μm). Lumenized structures in the bulk were formed of BCs (arrow at z = 45 μm). Additionally, an abundance of lumenized, multicellular structures formed of both monolayer and bulk cells were observed throughout the captured depth (labeled with arrow heads at z = 15, 30, and 45 μm).
Fig. 4. Fluorescence confocal sections of various configurations after 7 days of culture.
(A) Horizontal cross-sections at z = 0, 15, 30 and 45 μm of the configuration of Mono + Bulk with 1×10⁶cells/mL in bulk, “MB (medium)”. (B–D) Vertical cross-sections showing zx- and zy-sections from MB (medium) culture in frame (A) (B –depth of the z-stack is ~ 567 μm), from MO culture (C –depth of the z-stack is ~ 265 μm), and from BO (medium) culture (D –depth of the z-stack is ~ 400 μm). Asterisk: Angiogenic invasion from monolayer with lumen structures. Arrow: Lumen structures formed by de novo vasculogenesis. Arrowhead: lumenized structures formed by anastomosis of cells from monolayer (red) and bulk (green).
Looking more closely in Figure 4B, we observe that MCs were present as deep as ~ 400 μm (red signals in the bulk collagen at a greater depth) as part of a lumen structure whereas no MCs traveled further greater than ~ 100 μm in the configuration of “Mono Only” (Fig. 4C). This comparison suggests that BCs or the tubes structures formed by BCs facilitated the migration of MCs. Notably, the intermixed lumen structures were significantly larger than the angiogenic sprouts formed by pure angiogenesis in Figure 3A. Furthermore, Figure 4A and Figure 4B show that several multi-cellular lumen structures appeared at all depths, in contrast to the angiogenic sprouts led by single cells in Figure 3A. The observation that lumen structures were enlarged and became multicellular suggests that angiogenesis was enhanced by the presence of BCs. Compared to the vasculogenesis experiments (Fig. 3B, Fig. 4D), lumen structures formed in the bulk closer to the top surface of the gel via vasculogenesis (Fig. 4A, white arrow at z = 45 μm) whereas cells did not undergo tubulogenesis at this depth in the configuration of Bulk Only (“medium”, Fig. 3B). This observation indicates that the presence of MCs promoted vasculogenesis by BCs with a medium density. Importantly, the observations that 1) lumenized angiogenic sprouts extended into the bulk as continuous lumen structures, 2) BCs underwent vasculogenesis in the bulk collagen and 3) the mixed composition of cells suggest that anastomosis occurred between sprouting angiogenesis originated from the monolayer and open-lumen vascular structures in the bulk formed by vasculogenesis.
In contrast to our hypothetical mode of interaction between MCs and BCs (Fig. 1C), the lumenized invasions presented a locally mixed composition with respect to the sub-populations of cells: At the monolayer, invasions were predominately composed of RFP+-HUVECs (MCs) (Fig. 4A, z = 15 μm, star and arrowheads); in the bulk, tubes were formed of purely of GFP+-HUVECs (BCs) (Fig. 4A, z = 45 μm, arrow) and of mixture of MCs and BCs (arrowheads in Fig. 4A, Fig. 4B). Comparison with Mono Only (Fig. 4C) or Bulk Only (medium, Fig. 4D) suggests that the larger vessel structures were not simply the result of extensive vasculogenesis or pure anastomosis. We will return to a further consideration of the process that led to this intermixing after a global quantification of the degree of migration as a function of culture conditions.
Migration of monolayer cells into the bulk
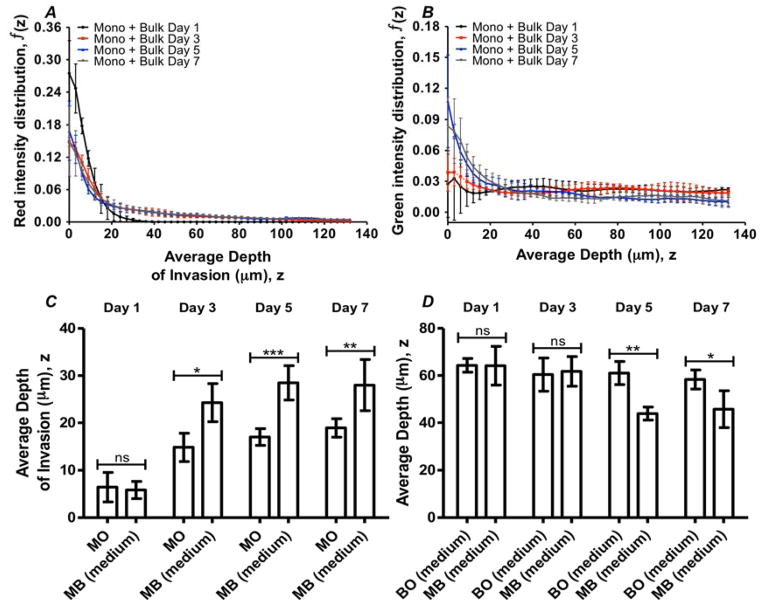
We sought to understand how the inclusion of ECs in the bulk influenced the process of cellular invasions during sprouting angiogenesis. To characterize the distribution of red and green cells in a stack, we calculated the total intensity of red (for RFP+-HUVECs) and green (for GFP+-HUVECs) in each image within the stack; we normalized the intensities of an image with respect to the total intensity of the stack (see Materials and methods). To characterize the progression of cells as they migrated, we quantified standard configurations (Mono + Bulk, medium) with end-points of 1, 3, 5, and 7 days. Figures 5A and 5B present this normalized intensity as a function of depth into the matrix for RFP+-HUVECs (originating from the endothelium) and GFP+-HUVECs (originating from the bulk) respectively. At Day 1 of culture (Fig. 5A, black), the presence of MCs at the monolayer interface (z = 0 μm) was found to be the highest compared to 3, 5 and 7 days (Fig. 5A, red, blue and grey, respectively). This trend suggests that MCs progressively left the monolayer (lowering of red signal at z = 0 μm) and penetrated further into the collagen at later days. Conversely, for the cells originally seeded in the bulk collagen, the intensity at the surface (z =0 μm) rose toward the surface with time (Fig. 5B). We associate this increase in intensity with the incorporation of BCs into the monolayer, as is seen in Figure 4A. Beyond a depth of 25 μm, the distributions of BCs remained similar at different end-points of culture time (Fig. 5B). We note that an alternative explanation for the variation in normalized intensities could be due to cell proliferation or apoptosis in a spatially dependent manner. However, we favor the interpretation of cell migration because of the noted correlation with qualitative images and lack of evidence of apoptosis and mitosis during the culture period. We note that there is a small loss of cellularity up to 25% and we propose that this may be due to migration of cells out of the field of view.
Fig. 5. Depth distribution of cell populations with time.
(A–B) Distributions of the fluorescence intensity in the depth measured from the position of the monolayer. Cells initially seeded on the surface of the gel (RFP+-HUVECs) (A); cells initially distributed within the bulk (GFP+-HUVECs) of the gels (B). BCs were seeded at a density of 1×10⁶ cells/mL; MCs at 250 cells/mm2. Time-points of Day 1 (black), Day 3 (red), Day 5 (blue), and Day 7 (grey) are shown. (C) Comparison of intensity-weighted average depth of invasion in Mono Only, “MO” and Mono + Bulk (medium), “MB (medium)” configurations. (D) Comparison of intensity-weighted average depth of BCs in Bulk Only (medium), “BO (medium)” and Mono + Bulk (medium), “MB (medium)” configurations. Error bar: Standard Deviation. (ns: not significant; *: p < 0.05; **: p < 0.01; ***: p < 0.001)
To further characterize the progression of these distributions of the two populations of cells, we calculated the first moments (or intensity weighted average depth; see Materials and methods) of the intensity distributions in configurations of Mono Only, Bulk Only (medium) and Mono + Bulk (medium), at designated time-points (Fig. 5C, 5D). We performed unpaired t-tests to compare red or green intensity of Mono + Bulk (medium) to Mono Only and Bulk Only respectively at each time-point. The tests identified significant differences in the average depth of MCs between Mono + Bulk (medium) and Mono Only at later time-points, indicating a role of BCs in promoting the migratory behavior of MCs (Fig. 5C). Figure 5C also shows that after 3 days of culture, the average depth of MCs in both Mono Only and Mono + Bulk (medium) approach a plateau at ~ 20 μm and ~ 30 μm respectively. We also note that as the culture time progressed, distribution of BCs shifted towards the monolayer, as indicated by lower values of average depth; this net migration of BCs was significantly larger for the Mono + Bulk (medium) than for the Bulk Only (medium) at Day 5 and Day 7 (Fig. 5D). This phenomenon suggests that the presence of MCs drove an upward migratory behavior of BCs. These results confirm the qualitative observations of inter-migration of MCs into the bulk (Fig. 4A, 4B) and presence of BCs on the monolayer (Fig. 4A).
Different cellular conditions: network robustness
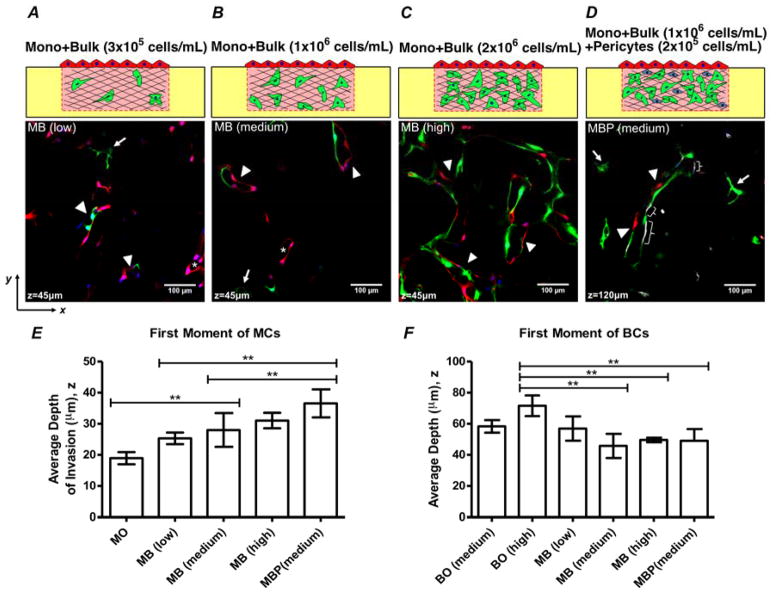
To further explore the dependence of angiogenic invasion on cellular composition, we examined the impact of different cellular conditions on the ability of MCs to migrate into the bulk and anastomose with BCs. We first explored the idea that the depth to which MCs migrate would depend on the presence and concentration of BCs in the bulk. We tested this hypothesis by exposing the MCs to a collagen containing BCs at a low bulk EC density (3×10⁵ cells/mL - Fig. 2D) and a high bulk EC density (2×10⁶ cells/mL - Fig. 2F), to compare with the medium bulk EC density case (1×10⁶ cells/mL - Fig. 2E). In addition, we introduced pericytes (PCs) to the anastomosis model at a concentration of 2×10⁵ cells/mL (Fig. 2G), a ratio of 1:5 to BCs36, because PCs are known to associate with blood vessels and aid in their stabilization by providing quiescence cues to the morphogenetic vasculature.34,37
Figures 6A–C present fluorescent micrographs across configurations of anastomosis models with different bulk EC densities after Day 7 of homotypic co-culture. We first observe that lumen structures formed of cells from both sub-populations appeared in all three configurations indicated by white arrowheads (Fig. 6A–C). Lumenized angiogenic sprouts formed purely of MCs (RFP+-HUVECs; asterisks) as well as lumens evolved via vasculogenesis from purely BCs (GFP+-HUVECs; white arrows) were present at z = 45 μm in both Mono + Bulk (low; Fig. 6A) and Mono + Bulk (medium; Fig. 6B). The Mono + Bulk (high) condition presents no structures of pure origin; we see only lumenized structures formed of both monolayer and bulk cells (arrow head; Fig. 6C). We further observe in Figure 6A–C that, although MCs intermixed with BCs at low BC density, as the density of BCs increased, lumens were more highly branched and interconnected. This characteristic is maximized in Mono + Bulk (high), with a dramatically larger number of the vascular structures present. Additionally, association between MCs and BCs became stronger as the density of BCs increased, as indicated by fewer individual angiogenic sprouts or lumens formed purely of BCs.
Fig. 6. Comparison across configurations at Day 7.
(A–D) Fluorescence confocal micrographs of horizontal planes within co-cultures after 7 days in culture. (A) Mono + Bulk with bulk density of 3×10⁵ cells/mL, “MB (low)” (B) Mono + Bulk with bulk density of 1×10⁶ cells/mL, “MB (medium)”. (C) Mono + Bulk with bulk density of 2×10⁶ cells/mL, “MB (high)”. (D) Mono + Bulk (medium) + Pericytes with BC density of 1×10⁶ cells/mL and PCs density of 2×10⁵ cells/mL, “MBP (medium)”. Asterisk: angiogenic invasion from monolayer with lumen structures. Arrow: Lumen structures formed by de novo vasculogenesis. Arrowhead: Mixed cell lumen structures formed by anastomosis. Brace: staining of pericytes. (E) Comparison of intensity-weighted depth of MCs across configurations at Day 7. (F) Comparison of intensity-weighted depth of BCs distribution across configurations at Day 7. Error bars: Standard Deviation. (*: p< 0.05; **: p < 0.01)
Figure 6D presents a fluorescent micrograph of Mono + Bulk (medium) + Pericytes at z = 120 μm. Once again, we can observe lumens formed via vasculogenesis (white arrows) as well as with intermixing of MCs and BCs (white arrowheads). We also identify a co-localization of PCs with vessel structures in the bulk collagen (Fig. 6D, white braces). Although further investigation is required, the observation that PCs are incorporated into the vessel structures to aid vessel maturation is consistent with expectations based on the literature.
Figures 6E–F present comparisons of average depths of both MCs and BCs at Day 7 across all configurations. Quantitatively, MCs migrated significantly deeper into the bulk collagen for the configurations of Mono + Bulk (medium), Mono + Bulk (high), and Mono + Bulk (medium) + Pericytes compared to the case of Mono Only (Fig. 6E). This observation suggests that the incorporation of BCs promoted the migration of MCs, even at low densities. Although more extensive lumen structures were present as the density of BCs increases (Fig. 6A–C), there is no statistically significant difference in the invasion depth of MCs among Mono +Bulk (low), Mono + Bulk (medium) and Mono + Bulk (high) (Fig. 6E). However, as the density of the BCs increases, instead of forming purely angiogenic sprouts, the MCs were incorporated into the lumen structures, which led to the intermixing feature via anastomosis. Looking closer at Mono + Bulk (medium) and Mono + Bulk (medium) + Pericytes, under the same cellular conditions but with the incorporation of pericytes in the bulk collagen, MCs migrated significantly deeper (Fig. 6E). Along with the qualitative observation of association of PCs with tubes (Fig. 6D), this increased invasion distance suggests that PCs facilitated vessel maturation in the bulk and in turns promoted the migration of MCs by allowing MCs to migrate along stable vessel structures. Additionally, the shift of BCs toward monolayer was observed quantitatively in the configurations where MCs were present except Mono + Bulk (low) (Fig. 6F). This observation is cohesive with the characteristic time-dependent shift of BCs in the case of Mono + Bulk (medium) in comparison to Bulk Only (medium) in Figure 5D which suggests that MCs promoted the upward migration of BCs.
Increased migration and intermixing
The intermixing of the two cell sub-populations (as seen clearly in Fig. 6A–C) was an unanticipated feature of the interactions during the process of anastomosis. The ability of individual MCs to rapidly incorporate into endothelial structures in the bulk, and the integration of BCs into the monolayer were striking observations. To explain these phenomenon, we hypothesize that the existing lumen structures serve as cellular tracks for MCs to migrate along; in other words, MCs prefer to migrate along the established tube structures instead of the extracellular matrix, a phenomenon previously reported in other contexts38,39.
To test this hypothesis, an experiment with delayed seeding of MCs was conducted to examine the effects on the migration of MCs due to pre-existing vessel structures in the bulk collagen. Delayed seeding experiment was performed with culture of BCs in the collagen matrix for 4 days in pro-angiogenic media. At the end of the 4th day, RFP+-HUVECs were seeded on the surface of the collagen (hereafter referred as “delayed co-culture”) and the co-culture was carried on under the same conditions and terminated at designated time-points for comparison with the configuration of Mono + Bulk (medium). In other words, after four days of pre-culture of the BCs, the co-culture was cultured an additional period of one, three and five days and compared to co-seeding of bulk and monolayer cells cultured for these same periods.
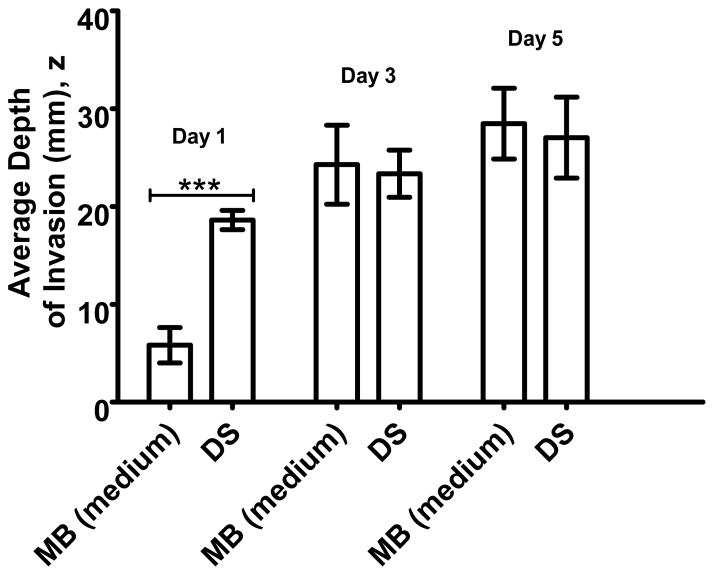
We observe a significant difference on Day 1 between regular and delayed co-cultures (Fig. 7): In the delayed co-culture, the depth of invasion reached nearly 70% of the maximum observed for the regular case within the first day of co-culture; in the regular case, the MCs reached the same depth as in the delayed co-culture by Day 3. One possible origin of this behavior is that the rapid, early migration of MCs in the delayed case was facilitated by the collagen degradation during the pre-culture of BCs as Stratman34 and others40,41 have demonstrated the central role played by proteolysis during vasculogenesis and angiogenesis. Another possible mechanism is that the pre-existing lumen structures facilitate the migration of MCs. In other words, MCs were in close contacts with the lumen structures formed by BCs and utilized the lumen structures to migrate. This facilitation could be due to physical support provided by the tube structures as well as active surface interactions mediated by ligand-receptor pairs spanning the junctions between cells. Finally, another possible contributor is the pro-angiogenic effects of ECs42 in the bulk on MCs; that is in the delayed seeding experiment, BCs were proliferating and secreting pro-angiogenic factors in the period of pre-culture. This extra time of secretion of pro-angiogenic factors could drive faster or more directed migration of MCs in the delayed co-culture compared to regular conditions (Mono + Bulk, medium), especially on Day 1.
Fig. 7. Invasion as a function of time of seeding.
Comparison of intensity-weighted average depth of invasion of MCs in Mono + Bulk (medium), “MB (medium)” and Delayed Seeding, “DS”, at co-culture time-points of Day 1, Day 3 and Day5. The density of BCs in both configurations is 1×10⁶ cells/mL. (***: p< 0.001)
Cellular track hypothesis
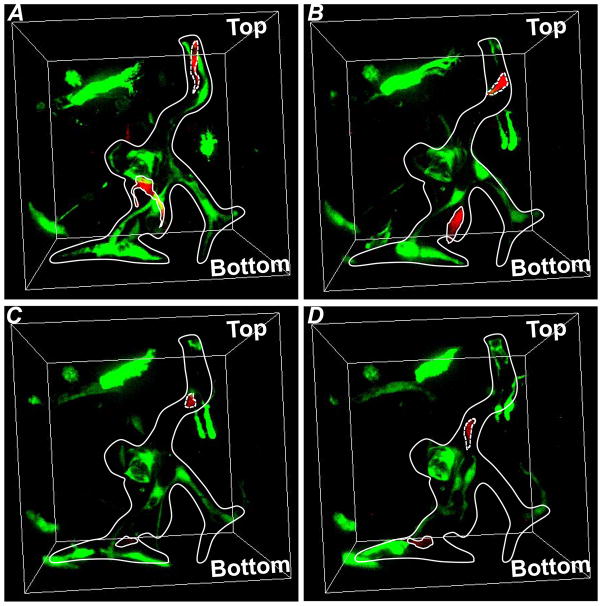
In order to assess the possible contribution of facilitated migration along pre-existing vessel structures, we performed a live imaging experiment (Fig. 8, Movie S.1). After seven days of culture in pro-angiogenic media in a standard incubator, a series of horizontal confocal sections was captured with a time interval of 1 hour up to 13 hours for the configuration of Mono + Bulk (medium). Figure 8 shows a vascularized lumen structure composed of both RFP+-HUVECs (MCs) and GFP+-HUVECs (BCs). The structure of the lumen changed dramatically during the time of imaging. Specifically, a single RFP+-HUVEC (MC) (circled by dashed line) migrated along the lumenal tube and traveled from the top to the middle point in the field of view (Fig. 8). Similarly, another RFP+-HUVEC (MC) (circled by solid line) in the middle of the field of view migrated toward the bottom along the lumen structure (Fig. 8). This observation is compatible with the hypothesis that pre-existing cellular structures act as conduits for cellular migration. We propose that this mechanism plays a role in the acceleration of EC migration and the formation of the mixed composition of tubes observed at later time points. We note that this observation does not exclude the possibility that proteolysis and secretion of growth factors operate in parallel with the process to increase the rate of sprouting and migration.
Fig. 8. Live tracking of individual cells in Mono + Bulk (medium) on Day 7.
(A) Time-point 1. (B) Time-point 5. (C) Time-point 9. (D) Time-point 14. Dashed line: cell 1; Solid line: cell 2. Each time point was separated by one hour.
Materials and methods
Reagents
The following cells, reagents, and materials were used: Human umbilical vein endothelial cells (HUVECs), 1× Medium 199 (1× M199), fetal bovine serum (FBS), L-glutamine, penicillin/streptomycin, trypsin/EDTA, HEPES buffered saline solution (Lonza); endothelial cell growth supplement (ECGS), basic fibroblast growth factor (bFGF), phosphate buffered saline (PBS) (Millipore); vascular endothelial cell growth factor (VEGF) (R&D Systems); rat tails (Pel-Freez Biologicals, Rogers AR); phorbol-12-myristate-13-acetate (PMA) (Cell Signaling Technology, Danvers, MA); (poly)ethylenimine (PEI) (MW 750,000) (Sigma-Aldrich, St. Louis, Missouri); heparin solution, 4′,6-diamidino-2-phenylindole (DAPI), 10× Medium 199 (10× M199) (Invitrogen); Acetic Acid (Mallinckrodt Chemicals); L-ascorbic acid (Acros Organics, Atlanta, GA); Bovine Serum Albumin, Triton X-100 (MP Biomedicals, Inc., Solon, OH); (poly)-dimethylsiloxane (PDMS) (Sylgard® 184, Dow Corning, Midland, Michigan); glass coverslips (Fisher Scientific); Sodium Hydroxyde (NaOH) (VWR); Biopsy Punches (Miltex by Kai); Glutaraldehyde (Fluka); Formaldehyde (Polysciences, Inc.).
Cell Culture Maintenance, Virus Production, Fluorescent Protein Transduction and Collagen Stock Solution
HUVECs were used in passages 3–8. For expansion and maintenance, cells were cultured in M199 containing 20% FBS, 30 μg/mL of ECGS, 5 Units/ml of heparin solution, 2 mM of L-glutamine, and 150 U/ml of penicillin/streptomycin. This growth media (GM) was changed every 2–3 days. Human Brain Vascular Pericytes (PCs) were used in passages 2–5. PCs were cultured in PM containing 5% Fetal Bovine Serum (FBS) and 1% penicillin/streptomycin. Both cell types were maintained at 5% CO2 and 37°C. The constructs for lentivirus production were kindly provided by Dr. J. Lammerding’s lab and were re-constructed to have mRuby2 and mNeonGreen fluorescent proteins respectively in-house with the help from Dr. Matthew Paszek’s lab. The lentivirus production was carried out using 2nd generation packaging systems following a protocol provided by Dr. Matthew Paszek. A batch of HUVECs was transduced with viruses containing sequence of Red Fluorescent Protein (RFP) that is expressed constitutively inside the cell. Another batch was transduced with virus containing sequence of Green Fluorescent Protein (GFP) in a similar fashion.
Collagen was extracted from rat tails as described previously.33 Acidic collagen solution was then lyophilized, and the dry mass was determined. The collagen was re-suspended in 0.1% v/v acetic acid to 15 mg/mL stock solution.
Preparation of Suspension of Cells in Collagen
Cells at 75–95% confluency were washed with 1× PBS, removed from culture flasks with 0.025% trypsin-EDTA, neutralized with GM, centrifuged, and re-suspended to a density of 3×10⁶ cells/mL. Cell-seeded collagen gels were prepared by mixing 10× M199 (1:10; compared to the desired final mixture volume), NaOH, 1N (1:50, compared to the required collagen stock volume), 1× M199 (as the last component added to complete final mixture volume), re-suspended HUVECs/PCs, and stock collagen solution. Both collagen solution and culture wells were kept on ice while preparing the suspension. NaOH, 10× M199, 1× M199, and collagen were mixed prior to adding cells in order to neutralize the collagen. The final pH of the solution was ~ 7.4. The working concentration of collagen was 6 mg/mL and the density of GFP+-HUVECs was 0.3 - 2×10⁶ cells/mL. A volume of 1 mL of GM containing 50 μg/mL of L-ascorbic acid, 50 ng/ml of TPA, 40 ng/ml of VEGF, and 40 ng/mL of bFGF was added to each well. We call this formulation Vasculogenesis Media (VM).
Preparation of PDMS Wells
Figure 9 depicts the process steps involved in making PDMS wells for the well assay. Uncured PDMS was poured onto a plexi-glass mold with an array of cylindrical posts 2-mm high and 4-mm in diameter. The mold had additional height to make a 2-mm thick base for each well. The mold with uncured PDMS was placed in an oven at 60°C for 2 hrs. Wells were separated from the master mold. Individual wells were separated from the array using a biopsy punch with an 8-mm diameter opening. An individual well of PDMS (Fig. 9C) was placed in the center of a well in a 24-well plate. The surface of PDMS wells was treated with oxygen plasma, dip-coated with 1% PEI for 10 minutes, and allowed to react with 0.1% glutaraldehyde for 30 minutes. These steps lead to covalent binding of collagen to the surfaces. Several rinses were performed thoroughly between each coating to avoid excess residuals of these chemicals. The 24-well plates containing coated PDMS wells were kept at 4°C before being loaded with cell-seeded (GFP+-HUVECs/PCs) or pure collagen. Cell-seeded or pure collagen were delivered to each well, a flat PDMS slab was positioned on top of the PDMS well, and the collagen was gelled inside an incubator for 30 minutes at 37°C.
Fig. 9. Generating PDMS wells for vertical anastomosis assays.
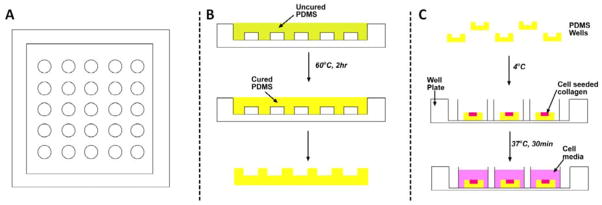
(A) A plexi-glass mold formed by machining. (B) Uncured PDMS is molded onto the posts and cured. (C) Individual wells are punched out of the array of wells, placed in a standard well plate, seeded with cells and bathed in cell culture media.
Culture in Wells
Following gelation of collagen at 37°C for 30 minutes, a volume of RFP+-HUVECs suspension in GM was allowed to sit on the surface of the collagen-filled PDMS well for 2 hours inside an incubator. This volume of cell suspended media is pre-determined to deposit a cell concentration of 250 cells/mm2 of RFP+-HUVECs on the surface of the entire well to ensure a confluent monolayer of cells. VM was used to maintain the well assays. VM was replenished every 2 days.
Immunostaining
Cultures were fixed at designated time-points with 3.7% formaldehyde in PBS for 30 minutes, wash with 1× PBS carefully followed by blocking/permeablizing with 3% BSA, 0.5% Triton-X100 in 1× PBS for 1 hour at room temperature. The wells were then incubated with rabbit primary antibody to αSMA (Abcam ab32575) with ratio of 1:100 to 1% BSA in 1× PBS at 4°C over night. The wells were thoroughly washed then incubated with Alexa Fluor® 647 Goat Anti-Rabbit IgG (Life Technologies P36930), DAPI, dilactate (Sigma-Aldrich) with a ratio of 1:100 and 1:1000 to 1% BSA in 1×PBS, respectively.
Microscopy and Image Analysis
Stacks of images of horizontal sections (567 μm by 567 μm) were acquired at 3 μm-intervals in the vertical direction using confocal microscopy (Zeiss 710). A water immersion 25× Carl Zeiss objective with a numerical aperture of 0.8 was used. The normalized pinhole was 28 μm and the scan zoom was set to 0.6. The end position used to collect a stack was varied but was always greater than 150 μm. Every well was taken to represent an independent experiment. Three locations away from the wall were randomly selected for a given culture well, and the average of stacks acquired at these positions in each well was reported as an independent experimental value (average of the normalized intensities, with respect to the total intensity in a stack, over the three positions at each depth – see Eq. 1 for normalization). A custom Matlab® code was created to separate the red and green channels from the collected image stacks and to perform subsequent analyses (Fig. 10). To extract intensity distributions through the depth of the culture, f (z), the total intensity of each color channel in each slice, ΣmIz(m), was calculated and normalized with respect the total intensity in that channel in the entire stack:
| (1) |
where m is the index of the pixels and z is the index of the slices. The slice z = 0 of the stack of images was defined as the slice with highest intensity in the red channel which represents the monolayer.
Fig. 10. Analysis method for vertical anastomosis assay.
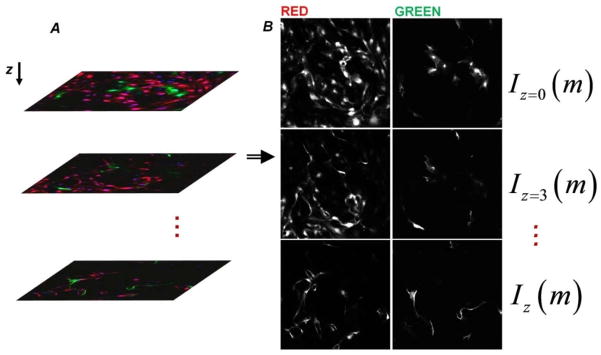
(A) Stacks of 3μm-spaced images were collected using confocal microscopy. Every well represents an independent experiment. Three random non-overlapping locations within a well were used for averaging. (B) A custom Matlab® code was created to separate the red and green channels from the collected image stacks. The total intensity of an image (I) is tracked along z-direction to characterize the distribution of red and green structures. m is the linear index of the intensity matrix elements.
To characterize the depth distributions we calculated the depth-weighted average or first moment of the intensity distribution, μ1, as follows:
| (2) |
Conclusions
This study utilized 3-D assays to recapitulate angiogenesis, vasculogenesis and a combination of both, in vitro with a focus on understanding the cell dynamics during and after anastomosis. We present the first reported evidence that anastomosis can occur between angiogenic sprouts and tubes formed by vasculogenesis in such a homotypic co-culture system. In this study, ECs originally in the monolayer via sprouting angiogenesis, extended continuously into the bulk collagen, while ECs originally in the bulk collagen underwent vasculogenesis; after the two processes anastomosed, ECs inter-dispersed themselves in the vascular structures. This cellular interaction in vitro could be analogous to the context of wound healing where the dispersed endothelial progenitor cells in disrupted tissue in the wound bed undergo vasculogenesis while sprouting angiogenesis occurs from intact vessels in the surrounding tissue.43,44
We found that this process of anastomosis presented is dependent on seeding density of ECs in the bulk collagen: higher densities of ECs in the bulk collagen led to more highly interconnected vessels with the incorporation of cells from the monolayer in the vessel structures in the bulk. Additionally, vasculogenesis in the bulk was promoted with increasing seeding density in the bulk, with larger and more highly branched lumen structures formed.
The unexpected feature of the anastomosis process in our system was that the populations of MCs and BCs did not connect with each other to form a hybrid vessel with a sharp transition between cells of distinct origin (Fig. 1C). Instead, these populations were found intermixed, with monolayer cells interspersed among bulk cells in vessel structures (Fig. 4A, Fig. 6) and bulk cells incorporated into the surface endothelium (Fig. 4A). Live microscopy indicated that cellular migration along pre-existing vessel structures plays a role in this dispersal process. This process, in which cellular networks act as tracks (“cellular tracks”), has been described in several other contexts, for example: networks of follicular dendritic cells served as a substratum for movement of follicular B cells within lymph nodes38, angiogenic sprouts are found to be closely associated (or migrating) over astrocytic tracks39, and motility of EC-associated pericytes depends on the presence of endothelial tubes45.
Although in vivo and in vitro studies have studied cell dynamics by inducing the cell migrations through wound models46–49, we have lacked tools with which to look at cell dynamics in anastomosis of blood vessel. This study showed that ECs are highly motile during and after anastomosis. The migratory behaviors of ECs along the cellular networks are potentially among the pre-requisites for remodeling and maturation of blood vessels, and need to be considered in the studies of blood vessel formation. The simple experimental platform introduced here provides a new basis for studying anastomosis in vitro and could open a new route to the formation of extensive networks of capillaries in engineered tissues.
Supplementary Material
Insight, Innovation, Integration.
We introduce a homotypic co-culture that allows for tracking of the dynamics of distinct populations of endothelial cells originating in an endothelium and an adjacent 3-D matrix. This strategy provides a new route to the study of anastomosis in vitro, elucidates the role of cellular migration within vascular remodeling, and suggests a means to accelerate the vascularization of engineered tissue constructs.
Acknowledgments
We acknowledge the technical assistance of G. Swan from the Chemical and Biomolecular Engineering Department, M. Paszek for assistance with the preparation of viruses, and J. Lammerding for RFP and GFP constructs. We acknowledge the Life Sciences Core Laboratories Center at Cornell University. We acknowledge the US National Institutes of Health (NIH) (RC1 CA146065 and the Cornell Center on the Microenvironment and Metastasis grant no. NCI-U54 CA143876); the Human Frontiers in Science Program; the Cornell Nanobiotechnology Center (no. NSF-STC; ECS-9876771); the Cornell Center for Nanoscale Science and Technology (no. NSF-NNIN ECS 03-35765); an Empire State Development Division of Science, Technology and Innovation (NYSTAR) Center for Advanced Technology (CAT) award. AD-S acknowledges partial support from the Sloan Foundation graduate fellowship.
References
- 1.Carmeliet P. Angiogenesis in life, disease and medicine. Nature. 2005;438:932–6. doi: 10.1038/nature04478. [DOI] [PubMed] [Google Scholar]
- 2.Folkman J. Angiogenesis: an organizing principle for drug discovery? Nat Rev Drug Discov. 2007;6:273–86. doi: 10.1038/nrd2115. [DOI] [PubMed] [Google Scholar]
- 3.Carmeliet P, Jain RK. Angiogenesis in cancer and other diseases. Nature. 2000;407:249–57. doi: 10.1038/35025220. [DOI] [PubMed] [Google Scholar]
- 4.Staton CA, et al. Current methods for assaying angiogenesis in vitro and in vivo. Int J Exp Pathol. 2004;85:233–48. doi: 10.1111/j.0959-9673.2004.00396.x. [DOI] [PMC free article] [PubMed] [Google Scholar]
- 5.Davis GE, Stratman AN, Sacharidou A, Koh W. Int Rev Cell Mol Biol. Vol. 288. Elsevier Inc; 2011. Molecular basis for endothelial lumen formation and tubulogenesis during vasculogenesis and angiogenic sprouting; pp. 101–65. [DOI] [PMC free article] [PubMed] [Google Scholar]
- 6.Potente M, Gerhardt H, Carmeliet P. Basic and therapeutic aspects of angiogenesis. Cell. 2011;146:873–87. doi: 10.1016/j.cell.2011.08.039. [DOI] [PubMed] [Google Scholar]
- 7.Ahmed Z, Bicknell R. Angiogenic signalling pathways. Methods Mol Biol. 2009;467:3–24. doi: 10.1007/978-1-59745-241-0_1. [DOI] [PubMed] [Google Scholar]
- 8.Geudens I, Gerhardt H. Coordinating cell behaviour during blood vessel formation. Development. 2011;138:4569–83. doi: 10.1242/dev.062323. [DOI] [PubMed] [Google Scholar]
- 9.Eilken HM, Adams RH. Dynamics of endothelial cell behavior in sprouting angiogenesis. Curr Opin Cell Biol. 2010;22:617–25. doi: 10.1016/j.ceb.2010.08.010. [DOI] [PubMed] [Google Scholar]
- 10.Lamalice L, Le Boeuf F, Huot J. Endothelial cell migration during angiogenesis. Circ Res. 2007;100:782–94. doi: 10.1161/01.RES.0000259593.07661.1e. [DOI] [PubMed] [Google Scholar]
- 11.Jakobsson L, et al. Endothelial cells dynamically compete for the tip cell position during angiogenic sprouting. Nat Cell Biol. 2010;12:943–53. doi: 10.1038/ncb2103. [DOI] [PubMed] [Google Scholar]
- 12.Featherstone J, Griffiths S. From the analyst’s couch. Drugs that target angiogenesis. Nat Rev Drug Discov. 2002;1:413–4. doi: 10.1038/nrd824. [DOI] [PubMed] [Google Scholar]
- 13.Carmeliet P, Jain RK. Molecular mechanisms and clinical applications of angiogenesis. Nature. 2011;473:298–307. doi: 10.1038/nature10144. [DOI] [PMC free article] [PubMed] [Google Scholar]
- 14.Metcalfe AD, Ferguson MWJ. Tissue engineering of replacement skin: the crossroads of biomaterials, wound healing, embryonic development, stem cells and regeneration. J R Soc Interface. 2007;4:413–37. doi: 10.1098/rsif.2006.0179. [DOI] [PMC free article] [PubMed] [Google Scholar]
- 15.Atala A, Bauer SB, Soker S, Yoo JJ, Retik AB. Tissue-engineered autologous bladders for patients needing cystoplasty. Lancet. 2006;367:1241–6. doi: 10.1016/S0140-6736(06)68438-9. [DOI] [PubMed] [Google Scholar]
- 16.L’Heureux N, et al. Human tissue-engineered blood vessels for adult arterial revascularization. Nat Med. 2006;12:361–5. doi: 10.1038/nm1364. [DOI] [PMC free article] [PubMed] [Google Scholar]
- 17.Ikada Y. Challenges in tissue engineering. J R Soc Interface. 2006;3:589–601. doi: 10.1098/rsif.2006.0124. [DOI] [PMC free article] [PubMed] [Google Scholar]
- 18.Krogh A. The number and distribution of capillaries in muscles with calculations of the oxygen pressure head necessary for supplying the tissue. J Physiol. 1919;52:409–15. doi: 10.1113/jphysiol.1919.sp001839. [DOI] [PMC free article] [PubMed] [Google Scholar]
- 19.Choi NW, et al. Microfluidic scaffolds for tissue engineering. Nat Mater. 2007;6:908–15. doi: 10.1038/nmat2022. [DOI] [PubMed] [Google Scholar]
- 20.Risau W. Mechanisms of angiogenesis. Nature. 1997;386:671–4. doi: 10.1038/386671a0. [DOI] [PubMed] [Google Scholar]
- 21.Chang EI, et al. Vascular anastomosis using controlled phase transitions in poloxamer gels. Nat Med. 2011;17:1147–52. doi: 10.1038/nm.2424. [DOI] [PubMed] [Google Scholar]
- 22.Levenberg S, et al. Engineering vascularized skeletal muscle tissue. Nat Biotechnol. 2005;23:879–84. doi: 10.1038/nbt1109. [DOI] [PubMed] [Google Scholar]
- 23.Koike N, et al. Tissue engineering: creation of long-lasting blood vessels. Nature. 2004;428:138–9. doi: 10.1038/428138a. [DOI] [PubMed] [Google Scholar]
- 24.Cheng G, et al. Engineered blood vessel networks connect to host vasculature via wrapping-and-tapping anastomosis. Blood. 2011;118:4740–9. doi: 10.1182/blood-2011-02-338426. [DOI] [PMC free article] [PubMed] [Google Scholar]
- 25.Chan JM, et al. Engineering of in vitro 3D capillary beds by self-directed angiogenic sprouting. PLoS One. 2012;7:e50582. doi: 10.1371/journal.pone.0050582. [DOI] [PMC free article] [PubMed] [Google Scholar]
- 26.Song JW, Bazou D, Munn LL. Anastomosis of endothelial sprouts forms new vessels in a tissue analogue of angiogenesis. Integr Biol (Camb) 2012;4:857–62. doi: 10.1039/c2ib20061a. [DOI] [PMC free article] [PubMed] [Google Scholar]
- 27.Zheng Y, et al. In vitro microvessels for the study of angiogenesis and thrombosis. Proc Natl Acad Sci U S A. 2012;109:9342–7. doi: 10.1073/pnas.1201240109. [DOI] [PMC free article] [PubMed] [Google Scholar]
- 28.Yeon JH, Ryu HR, Chung M, Hu QP, Jeon NL. In vitro formation and characterization of a perfusable three-dimensional tubular capillary network in microfluidic devices. Lab Chip. 2012;12:2815–22. doi: 10.1039/c2lc40131b. [DOI] [PubMed] [Google Scholar]
- 29.Moya ML, Hsu Y-H, Lee AP, Hughes CCW, George SC. In Vitro Perfused Human Capillary Networks. Tissue Eng Part C Methods. 2013 doi: 10.1089/ten.TEC.2012.0430. [DOI] [PMC free article] [PubMed] [Google Scholar]
- 30.Chiu LLY, Montgomery M, Liang Y, Liu H, Radisic M. Perfusable branching microvessel bed for vascularization of engineered tissues. Proc Natl Acad Sci U S A. 2012;109:E3414–23. doi: 10.1073/pnas.1210580109. [DOI] [PMC free article] [PubMed] [Google Scholar]
- 31.Chrobak KM, Potter DR, Tien J. Formation of perfused, functional microvascular tubes in vitro. Microvasc Res. 2006;71:185–96. doi: 10.1016/j.mvr.2006.02.005. [DOI] [PubMed] [Google Scholar]
- 32.Koh W, Stratman AN, Sacharidou A, Davis GE. In vitro three dimensional collagen matrix models of endothelial lumen formation during vasculogenesis and angiogenesis. Methods Enzymol. 2008;443:83–101. doi: 10.1016/S0076-6879(08)02005-3. [DOI] [PubMed] [Google Scholar]
- 33.Cross VL, et al. Dense type I collagen matrices that support cellular remodeling and microfabrication for studies of tumor angiogenesis and vasculogenesis in vitro. Biomaterials. 2010;31:8596–607. doi: 10.1016/j.biomaterials.2010.07.072. [DOI] [PMC free article] [PubMed] [Google Scholar]
- 34.Stratman AN, et al. Endothelial cell lumen and vascular guidance tunnel formation requires MT1-MMP-dependent proteolysis in 3-dimensional collagen matrices. Blood. 2009;114:237–47. doi: 10.1182/blood-2008-12-196451. [DOI] [PMC free article] [PubMed] [Google Scholar]
- 35.Lenard A, et al. In vivo analysis reveals a highly stereotypic morphogenetic pathway of vascular anastomosis. Dev Cell. 2013;25:492–506. doi: 10.1016/j.devcel.2013.05.010. [DOI] [PubMed] [Google Scholar]
- 36.Stratman aN, Malotte KM, Mahan RD, Davis MJ, Davis GE. Pericyte recruitment during vasculogenic tube assembly stimulates endothelial basement membrane matrix formation. Blood. 2009;114:5091–5101. doi: 10.1182/blood-2009-05-222364. [DOI] [PMC free article] [PubMed] [Google Scholar]
- 37.Von Tell D, Armulik A, Betsholtz C. Pericytes and vascular stability. Exp Cell Res. 2006;312:623–9. doi: 10.1016/j.yexcr.2005.10.019. [DOI] [PubMed] [Google Scholar]
- 38.Bajénoff M, et al. Stromal cell networks regulate lymphocyte entry, migration, and territoriality in lymph nodes. Immunity. 2006;25:989–1001. doi: 10.1016/j.immuni.2006.10.011. [DOI] [PMC free article] [PubMed] [Google Scholar]
- 39.Gerhardt H, et al. VEGF guides angiogenic sprouting utilizing endothelial tip cell filopodia. J Cell Biol. 2003;161:1163–77. doi: 10.1083/jcb.200302047. [DOI] [PMC free article] [PubMed] [Google Scholar]
- 40.Rundhaug JE. Matrix metalloproteinases and angiogenesis. J Cell Mol Med. 9:267–85. doi: 10.1111/j.1582-4934.2005.tb00355.x. [DOI] [PMC free article] [PubMed] [Google Scholar]
- 41.Van Hinsbergh VWM, Engelse MA, Quax PHA. Pericellular proteases in angiogenesis and vasculogenesis. Arterioscler Thromb Vasc Biol. 2006;26:716–28. doi: 10.1161/01.ATV.0000209518.58252.17. [DOI] [PubMed] [Google Scholar]
- 42.Galley HF, Webster NR. Physiology of the endothelium. Br J Anaesth. 2004;93:105–13. doi: 10.1093/bja/aeh163. [DOI] [PubMed] [Google Scholar]
- 43.Masuda H. Post-natal endothelial progenitor cells for neovascularization in tissue regeneration. Cardiovasc Res. 2003;58:390–398. doi: 10.1016/s0008-6363(02)00785-x. [DOI] [PubMed] [Google Scholar]
- 44.George AL, et al. Endothelial progenitor cell biology in disease and tissue regeneration. J Hematol Oncol. 2011;4:24. doi: 10.1186/1756-8722-4-24. [DOI] [PMC free article] [PubMed] [Google Scholar]
- 45.Stratman AN, Schwindt AE, Malotte KM, Davis GE. Endothelial-derived PDGF-BB and HB-EGF coordinately regulate pericyte recruitment during vasculogenic tube assembly and stabilization. Blood. 2010;116:4720–30. doi: 10.1182/blood-2010-05-286872. [DOI] [PMC free article] [PubMed] [Google Scholar]
- 46.Castellino F, et al. Chemokines enhance immunity by guiding naive CD8+ T cells to sites of CD4+ T cell-dendritic cell interaction. Nature. 2006;440:890–5. doi: 10.1038/nature04651. [DOI] [PubMed] [Google Scholar]
- 47.Reffay M, et al. Orientation and polarity in collectively migrating cell structures: statics and dynamics. Biophys J. 2011;100:2566–75. doi: 10.1016/j.bpj.2011.04.047. [DOI] [PMC free article] [PubMed] [Google Scholar]
- 48.Poujade M, et al. Collective migration of an epithelial monolayer in response to a model wound. Proc Natl Acad Sci U S A. 2007;104:15988–93. doi: 10.1073/pnas.0705062104. [DOI] [PMC free article] [PubMed] [Google Scholar]
- 49.Reffay M, et al. Interplay of RhoA and mechanical forces in collective cell migration driven by leader cells. Nat Cell Biol. 2014;16:217–23. doi: 10.1038/ncb2917. [DOI] [PubMed] [Google Scholar]
Associated Data
This section collects any data citations, data availability statements, or supplementary materials included in this article.


