

Abstract
Purpose
To create and test an index to indicate both availability and quality of physical activity (PA) resources (PARs), to examine associations between access to quality PARs and changes in PA, and to determine whether this association differed in lower- and higher-income neighborhoods.
Design
Longitudinal, 6-month intervention. Setting. Houston and Austin, Texas.
Subjects
African-American and Hispanic or Latina women.
Measures
Women (N = 410) completed a questionnaire and accelerometry to measure PA. Neighborhoods (N = 163) were classified as lower- or higher-income by median household income at the census-tract level. PARs were audited using the PARA (physical activity resource assessment). Access to quality PARs was determined by a composite index (QPAR) of features, amenities, and incivilities.
Analysis
Repeated measures analyses of variance were used to examine changes in PA by (1) neighborhood income (lower/higher) and QPAR (lower/higher) groups, and (2) neighborhood income (lower/higher) and number of PARs (lower/higher) groups, adjusting for ethnicity, household income, and body mass index.
Results
Women in neighborhoods with lower QPAR scores had small increases in self-reported vigorous PA (M Δ = 327.8 metabolic equivalent of task [MET]-min/wk) and decreases in accelerometer PA (M = −3.4 min/d), compared to those with higher QPAR scores who had larger increases in self-reported vigorous PA (M Δ = 709.8 MET-min/wk) and increased accelerometer PA (M = 3.9 min/d). There was a significant interaction between changes in leisure-time PA, QPAR score, and number of PARs (p =.049). Women with both more PARs and higher QPAR scores reported greater increases in leisure-time PA than women with fewer PARs and lower QPAR scores.
Conclusion
Access to higher-quality PARs can help increase or maintain PA over time regardless of neighborhood income. PAR quality is a separate and distinct, important determinant of PA in ethnic minority women.
Keywords: Physical Activity; Socioeconomic Status; Built Environment; Minority Health; Women; Adults; Prevention Research. Manuscript format: research; Research purpose: modeling/relationship testing; Study design: nonexperimental; Outcome measure: behavioral; Setting: local community; Health focus: fitness/physical activity; Strategy: built environment; Target population age: adults; Target population circumstances: education/income level, geographic location, race/ethnicity
INTRODUCTION
Residence in lower-income neighborhoods has been associated with lower levels of physical activity.1–4 Although residents in lower-income neighborhoods have reported greater energy expenditure and higher levels of active transportation in some cases,5 they also report less moderate to vigorous physical activity (MVPA) and are less likely to meet recommended guidelines for physical activity.6 The theoretical underpinnings of these observed associations, derived from the Ecologic Model of Physical Activity of Spence and Lee,7 posit that macrolevel environmental factors such as neighborhood income may have a direct impact on individual-level physical activity adoption, but this effect may be modified by microlevel environmental factors, such as having high-quality places to do physical activity. Existing cross-sectional data seem to support this relationship, but the complete nature of this relationship has not been definitively described,4,8 in part, because few studies exist that have followed this association longitudinally. Part of the driving force behind these relationships may include lack of places and opportunities to do physical activity, or the belief that when places do exist, they may not be safe or appealing.8,9
Previous cross-sectional studies of physical activity resources (PARs) have focused on sheer availability, the count or density in a neighborhood, or have included the number and quality of features, amenities, and incivilities. Incivilities represent disorder or declining quality such as litter, graffiti tagging, or signs of vandalism, and may reduce the pleasure associated with using a physical activity resource.4,10,11 The availability of resources has been positively associated with physical activity,4,11–13 and lower-income or lower socioeconomic status (SES) neighborhoods tend to have fewer high-quality, accessible PARs than high-income neighborhoods.10,14 For example, in a study of access to trails, men in lower SES neighborhoods had fewer trails available to them and reported lower levels of physical activity than those in high SES neighborhoods.15 However, it is not clear that the mere increased availability of resources has a direct influence on physical activity, as other studies have found that some lower SES neighborhoods actually have higher availability of physical activity resources,14 yet may still have residents with lower levels of physical activity.16,17 The mixed findings suggest that measures of resource availability do not capture subtle features of resources that influence physical activity. There is a need to use a measure that addresses not only availability but also the presence and quality of resource features and user amenities or presence and severity of incivilities,10 addressing both availability and quality.
The number and quality of features offered at a physical activity resource may be an indicator of the amount of use of the resource.18 For example, in a study that observed the use of trails, physical activity levels were inhibited by negative perceptions of poor-quality trails.19 Similar work has shown that increasing play features and amenities at playgrounds leads to significant increases in physical activity among children.20 Resources in low-income or low SES environments may experience higher levels of deprivation with increased incidence of incivilities such as graffiti, trash, and drug paraphernalia, which may discourage physical activity.15 Factors and attributes such as quality, cleanliness, and cost of the resource may be more important than sheer availability for increasing physical activity. To provide more evidence on the impact that the quality of the resource has on physical activity, the development of a standard measure and scoring system to assess the quality of PARs is needed. Using a standardized scoring system for assessing quality will allow investigators as well as community members and policymakers to compare quality across neighborhoods at varying socioeconomic levels and in varying geographic locations.
Observations of the relationship between residence in low-income or low SES neighborhoods and physical activity have helped guide our understanding of their interaction, yet most studies have been cross-sectional in nature, making it difficult to draw definitive conclusions about how neighborhood income or SES and the quality of physical activity resources interact to affect physical activity.21 One study reported that satisfaction with the quality of PARs significantly predicted increases in walking for leisure during a 2-year period.22 There is a need for more longitudinal studies in order to define and document the relationship between the built environment and physical activity. Further, previous studies aimed at exploring these cross-sectional relationships have used self-reported assessment tools, recall methods, and energy expenditure to measure physical activity. Few studies have used objectively measured physical activity as an outcome, which is necessary to identify environmental determinants of physical activity that can be translated into policy.2 This study investigated the relationship of neighborhood income and access to quality PARs to changes in physical activity among African-American and Hispanic or Latina women over time. Study aims were to (1) create and test a single index to indicate both availability and quality of PARs based on the physical activity resource assessment (PARA) instrument,10 (2) examine the association between access to quality PARs and changes in physical activity, and (3) determine whether this association differed in lower- and higher-income neighborhoods. We expected that PAR quantity and quality would independently contribute to physical activity over time, regardless of neighborhood income.
METHODS
Participants
Four hundred ten community-dwelling, African-American (n = 257) and Hispanic or Latina (n = 153) women participated in Health Is Power (HIP; 1R01CA109403), a multisite, longitudinal, community-based, randomized controlled trial to increase physical activity in Houston and Austin, Texas.23–25 Participants were recruited to the study in 2006–2008 via community outreach and media advertisements, as described previously.23,24 Eligible participants self-identified as African-American or Hispanic or Latina, were between the ages of 25 and 60 years; able to read, speak, and write in English or Spanish; a Harris or Travis County resident; not pregnant or planning to become pregnant and not planning on moving in the next 12 months; physically inactive or doing fewer than 30 minutes of physical activity per day on 3 or more days per week; and free from health conditions that would be aggravated by physical activity.26 Only participants with complete baseline and postintervention individual and environmental data (N = 163) were included in the current study.
HIP Procedures
Eligible participants attended a baseline time 1 (T1) health assessment, where they completed interviewer-administered questionnaires, a physical assessment, and were given a packet to complete before the next meeting (approximately 1 week later). The packet contained more detailed questionnaires not found in the interviewer-administered survey and served as a run-in procedure to discourage less interested participants before randomization. Women who completed the packet were randomized into one of two intervention groups: a physical activity group or vegetable and fruit group. The 6-month face-to-face intervention included evidence-based behavioral methods integrated into strategies to promote group cohesion and framed to account for environmental factors contributing to health disparities. Women participated in team-building activities, environmental mapping exercises, and supervised walks or taste tests. After 6 months of intervention activities, women returned to complete identical postintervention time 2 (T2) health assessments. A subsample (n = 59) completed accelerometer assessments by using a 7-day standardized protocol to measure MVPA. Women in the subsample did not differ significantly from the total sample on any variables. All HIP study assessments, measures, and procedures were approved by the Committee for the Protection of Human Subjects at the University of Houston, Texas, and women provided written informed consent before participation.
Covariates and Physical Activity
Covariates
Items assessing ethnicity and individual household income were adapted from the Maternal and Infant Health Assessment Survey,27 derived from the Centers for Disease Control and Prevention’s Pregnancy Risk Assessment Monitoring System Questionnaire.28 These items have been used in samples with diverse ethnicities and income levels.29 Body mass index (BMI) was calculated by using measured height and weight.
Physical Activity
The International Physical Activity Questionnaire (IPAQ) long form was used to measure self-reported physical activity, including work-related, transportation, domestic, and leisure-time physical activity and walking-, moderate- and vigorous-intensity physical activity, over the last 7 days.30 The IPAQ is widely used and reliable (r = 0.8) but has shown relatively low validity (r = 0.3) when compared to accelerometry,31 suggesting measurement of divergent elements of the complex behavioral domains of physical activity. All domains of physical activity, reported as metabolic equivalent of task (MET)-minutes per week, were used in analyses.
Objective physical activity data were collected using a unidirectional Acti-Graph GT1M accelerometer (Acti-Graph, Pensacola, Florida).32 The ActiGraph accelerometer exhibits strong associations between activity counts and measured energy expenditure, is responsive to different intensities of physical activity, and has the lowest amount of variance across measurement devices, indicating strong validity (intraclass correlation coefficient =.87) and overall reliability.33 An individual-specific cut point was applied to determine whether each minute in a 24-hour day (from 12:00 A.M. to 11:59 P.M.) was spent doing moderate- or greater-intensity activity. Minutes spent doing MVPA per valid day were included in analyses. Details of the development of cut points and accelerometry protocol have been published previously.34
Neighborhood Factors
Neighborhood Definition and Data Collection
Neighborhoods (n = 375) were mapped using geographic information systems (GIS) technology in ArcGIS 9.1 (Esri, Redlands, California) and were defined as the area within an 800-m-radius Euclidean buffer surrounding each participants’ residence.35 All assessments were conducted by trained research team members in teams of at least two people following established data collection and safety protocols.10,36,37
Physical Activity Resources
All PARs in all neighborhoods were audited on dimensions of presence and quality of physical activity features, amenities, and overall incivilities using PARA (2010). Features and amenities were rated as 0 = not present, 1 = poor, 2 = mediocre, and 3 = good. Incivilities were rated as 0 =not present, 1 =little/few, 2 =some, 3 =a lot. Higher feature and amenity and lower incivility scores would indicate a better-quality physical activity resource.
Neighborhood Income Status
Participants’ neighborhoods in Austin and Houston, Texas, were classified as lower or higher income on the basis of aggregated median household income at the census-tract level drawn from the 2006–2010 American Community Survey.38
Analyses
Environmental cross-sectional data and longitudinal individual-level data were used to determine the relationship between PARs and physical activity among women. To meet assumptions of normality, all physical activity data were transformed for analyses using an exponential transformation. To determine access to quality PARs, a composite index was created. For an individual resource, the quality score was based on the sum of features and amenities ratings, minus the incivilities ratings. To aggregate the quality score at the neighborhood level, the quality score for each individual resource was summed, and then divided by the total number of resources in the neighborhood. This index aggregated for all PARs in each neighborhood was used to determine an overall access to quality physical activity resources (QPAR) index. To investigate interaction effects, neighborhood income and QPAR scores were dichotomized using a median split. Repeated measures analyses of variance (ANOVA) were used to examine changes in physical activity by neighborhood income (lower versus higher) and QPAR (lower versus higher) groups, adjusting for significant covariates, which included ethnicity, BMI, and individual-level household income. To compare the effects of simple availability (number of resources per neighborhood) with QPAR index, repeated measures analyses were used to examine changes in physical activity by neighborhood income (lower versus higher) and number of resources (lower versus higher) groups. All statistical analyses were conducted in IBM SPSS Statistics Version 20 (SPSS 20 for Windows; IBM Corporation, Armonk, New York).
RESULTS
Individual Characteristics
African-American (n = 121) and Hispanic or Latina (n = 42) women who participated in this study were middle-aged (mean [M] = 46.8 years, SD =8.7), obese (M BMI =34.8 kg/m2, SD = 8.1, range = 20.51–58.64) and nearly half (49.3%) reported an annual household income greater than 400% of the federal poverty level for a family of four in 2007 or greater than $82,600. Self-reported leisure-time physical activity and accelerometer-measured physical activity at T1 and T2 by ethnicity is displayed in Table 1. For the total sample, self-reported physical activity significantly increased (p < .05) in all domains from T1 to T2, except domestic physical activity (results previously published).25 However, there was no significant change in accelerometer-measured physical activity for the overall sample from T1 (M = 19.5 min/d, SD = 19.7) to T2 (M = 19.5 min/d, SD = 16.9).
Table 1.
Physical Activity at Baseline (T1) and Post-Intervention (T2) by Ethnicity*
| African-American (n = 121)
|
Hispanic or Latina (n = 42)
|
|||
|---|---|---|---|---|
| T1 M (SD) | T2 M (SD) | T1 M (SD) | T2 M (SD) | |
| Accelerometer MVPA, min/d | 23.3 (21.3) | 23.3 (18.5) | 9.6 (9.1)† | 11.4 (18.5)‡ |
| Self-reported leisure-time PA, MET-min/wk | 359.4 (683.4) | 744.0 (1046.3) | 117.3 (259.8)§ | 706.2 (997.8) |
MVPA indicates moderate to vigorous physical activity; M, mean; PA, physical activity; and MET, metabolic equivalent of task.
Significantly different from African-American at T1 t = 6.269, p < 0.001.
Significantly different from African-American at T2 t = 2.176, p = 0.038.
Significantly different from African-American at T2 t = −2.05, p = 0.041.
Neighborhood Characteristics
Descriptive information about neighborhoods is presented in Table 2. Neighborhood QPAR index scores ranged from 0 to 45.83 (M =16.6, SD = 9.0, median = 15.0). Median neighborhood household income ranged from $13,421 to $119,260 per year (M =$40,778.54, SD = $17,128.59, median = $38,511.00). After dichotomizing variables to explore interaction effects, 54.3% (N = 88) of participants lived in a neighborhood with a lower QPAR index, 49.1% (N = 80) lived in neighborhoods with a lower number of PARs, and 51.0% (N = 78) lived in neighborhoods with a lower median household income. Pearson correlation coefficients (Table 3) indicated physical activity resource features, amenities and incivilities were significantly associated with one another, and features and amenities were associated with QPAR score.
Table 2.
Neighborhood Median Household Income and Physical Activity Resource Counts, Feature, Amenity, and Incivility Ratings
| Median Household Income | Mean (SD) $40,127 ($17,149) |
Range $13,421–119,260 |
|---|---|---|
| Count | 4.1 (2.8) | 0–17 |
| Features | 6.7 (4.0) | 0–23 |
| Amenities | 11.6 (5.8) | 0–31.5 |
| Incivilities | 2.8 (2.1) | 0–10.7 |
Table 3.
Correlations Between Physical Activity Resource Characteristics and Physical Activity Resource Quality†
| QPAR Index | Number of PARs | Features Score | Amenities Score | Incivilities Score | |
|---|---|---|---|---|---|
| QPAR index | 1 | ||||
| Number of PARs | −0.010 | 1 | |||
| Features score | 0.857* | 0.006 | 1 | ||
| Amenities score | 0.939* | 0.003 | 0.721* | 1 | |
| Incivilities score | −0.068 | 0.049 | 0.213* | 0.106 | 1 |
QPAR indicates quality of physical activity resource score (index of resource features, amenities and incivilities); and PAR, physical activity resource.
Significant at p < 0.01.
Repeated Measures Analyses
After adjusting for ethnicity, age, BMI, education, and individual income, repeated measures ANOVA demonstrated a relationship between QPAR index score and changes in self-reported vigorous (F(1,133) = 3.697, p = .057) and accelerometer-measured (F(1,43) = 4.053, p = .05) physical activity. Regardless of neighborhood income, women who lived in neighborhoods with lower QPAR scores demonstrated a smaller increase in self-reported vigorous physical activity (T1 M = 507.7 MET-min/wk, SD = 2170.5; T2 M =835.5 MET-min/wk, SD = 1698.9; Δ = 327.8 MET-min/wk) and decreases in accelerometer-measured MVPA (T1 M = 21.8 min/d, SD = 22.6; T2 M =18.4 min/d, SD =15.7; Δ=−3.4 min/d) over time, while those with higher QPAR scores demonstrated greater increases in self-reported vigorous physical activity (T1 M = 308.6 MET-min/wk, SD = 839.1; T2 M = 1018.4 MET-min/wk, SD = 1571.3; Δ = 709.8 MET-min/wk) and accelerometer-measured MVPA (T1 M =16.9 min/d, SD =15.1; T2 M =20.8 min/d, SD = 18.4; Δ = 3.9 min/d) over time. These results are displayed in Figures 1 and 2.
Figure 1. Changes in Self-Reported Vigorous PA.
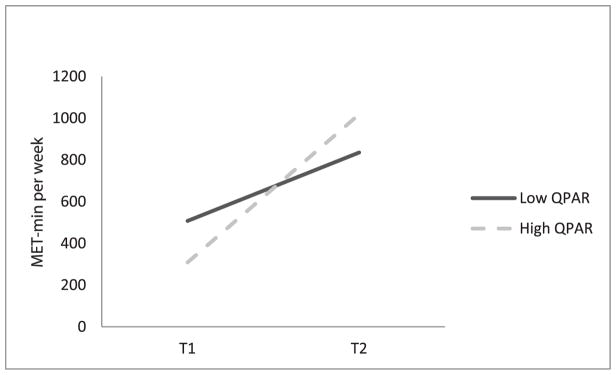
PA indicates physical activity; MET, metabolic equivalent of task; and QPAR, quality of physical activity resource score.
Figure 2. Changes in Accelerometer-Measured PA.
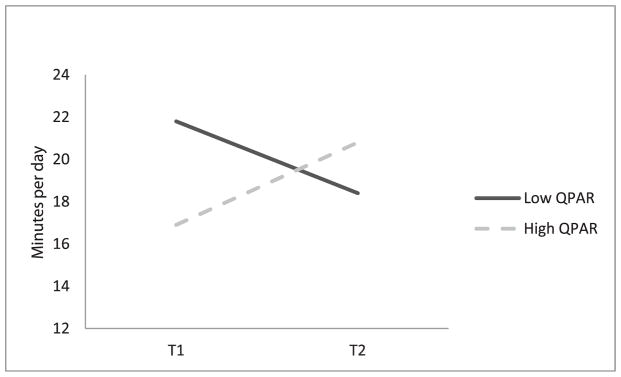
PA indicates physical activity; and QPAR, quality of physical activity resource score.
Repeated measures ANOVA also demonstrated a significant three-way interaction between changes in self-reported leisure-time physical activity, QPAR index score, and number of PARs (F(1,142) = 3.928, p =.049). Women who lived in close proximity to more resources with higher QPAR scores reported greater increases in leisure-time physical activity than women who lived near many resources with lower QPAR scores, after adjusting for covariates. We also found a three-way interaction approaching statistical significance between changes in domestic physical activity, neighborhood income, and number of PARs (F(1,134) = 3.696, p = .057). Women who did not live in close proximity to resources and lived in a lower-income neighborhood reported decreases in domestic physical activity over time, while women who lived in close proximity to resources reported increases in domestic physical activity over time, regardless of whether they lived in lower- or higher-income neighborhoods, after controlling for covariates. There were no other significant interactions between time, number of PARs, QPAR, and neighborhood income.
DISCUSSION
Having high-quality PARs available in one’s neighborhood appears to enhance physical activity adoption in women, regardless of neighborhood SES. Women who lived in neighborhoods with higher QPAR scores, compared to lower QPAR scores, demonstrated a greater increase in self-reported vigorous physical activity and an increase versus a decrease in accelerometer-measured physical activity over time. Greater access to high-quality resources may significantly impact physical activity, regardless of neighborhood income, and even more striking is that this was true for women regardless of age, ethnicity, body composition, individual income, and educational attainment. This is consistent with previous research that has suggested that having access to PARs is associated with physical activity,4,11–13 but it appears that this relationship may be especially important for adoption of physical activity over time. Consistent with the Ecologic Model of Physical Activity, microlevel environments such as PARs, which support physical activity, are a critical component for making successful intentional changes in this behavior and may buffer more macrolevel environmental factors such as SES.7
The quality of the physical activity resource, in terms of having greater physical activity features and resource amenities with fewer incivilities, was a particularly important driving factor for leisure-time physical activity. Women who lived nearby many resources with higher QPAR scores reported greater increases in leisure-time physical activity than women who lived nearby many resources with lower QPAR scores. This is consistent with one other longitudinal study that evaluated quality of PARs via women’s perceptions of them, rather than objective audits.22 This comes as somewhat of a surprise given that other studies have not found high correspondence between objective audits and perceptions of neighborhood built environments39; however, perhaps the discrete and more memorable boundaries of a particular physical activity resource may contribute to more accurate perceptions of quality. Regardless, taken together these studies suggest that quality of the physical activity resource is very important for physical activity adoption, and this is among the first studies to associate objective reports of quality with objectively measured physical activity over time, and opens the door to additional investigations in this arena.
This study relied on a sizeable sample of African-American and Hispanic or Latina women, using multiple measures of physical activity. Although accelerometers are widely considered state of the art in physical activity measurement, cost constraints limited their use to a subsample, which may have affected the power to detect effects. Although our findings are generalizable to overweight, minority women living in urban and suburban neighborhoods, the quality of the data and consistency of the findings may inform research and practice among other populations and neighborhoods. One limitation of this study was our use of a median split to define income groups. We chose to use a median split because our sample was primarily middle to high income. Future studies with a more diverse sample could dichotomize on the basis of federal poverty level or average state or federal household income. This study boasts a census sample of PARs in a diverse, clearly defined range of neighborhoods. Additional strengths include trained assessors and a carefully crafted, simple, and reliable assessment instrument that can be used by scientists, practitioners, and community members.
Results suggest an independently beneficial effect of higher-quality PARs, after accounting for neighborhood SES, on physical activity in ethnic minority women. This finding is particularly important for women residing in lower SES areas who may do disproportionately less physical activity and have a higher prevalence of obesity than those residing in higher SES areas. In addition, women, as family gatekeepers, may be particularly influential in increasing children’s physical activity, so these findings may have farther reaching impact toward reducing chronic conditions that develop over a lifetime of physical inactivity. An affection for using PARs that develops in childhood may help influence behavior well into adulthood and fosters appreciation for the benefits that high-quality resources can bring to a community.
The QPAR index shows promise for guiding future planning and community initiatives. The holistic understanding of how availability and quality factors work together can inform policy and community efforts to increase and improve PARs. Findings underscore that the “if you build it they will come” strategy of urban planning and health promotion would be greatly enhanced by improving and maintaining existing PARs for maximum community benefit. Having access to higher-quality resources may help increase or maintain physical activity over time in vulnerable populations, regardless of other neighborhood SES attributes.
SO WHAT? Implications For Health Promotion Practitioners and Researchers.
What is already known on this topic?
Residence in low socioeconomic status (SES) neighborhoods and not having access to high-quality places to do physical activity has been associated cross-sectionally with lower levels of physical activity.
What does this article add?
This study found that having high-quality physical activity resources available in one’s neighborhood appears to enhance physical activity adoption in women, regardless of neighborhood SES. This finding is consistent with previous research that has suggested that having access to physical activity resources is associated with physical activity, and adds that this relationship may be especially important for adoption of physical activity over time in ethnic minority women.
What are the implications for health promotion practice or research?
The QPAR index shows promise for guiding future planning and community initiatives that will enhance availability and quality of physical activity resources. These initiatives have the potential to be effective for increasing physical activity in high and low SES neighborhoods.
Acknowledgments
The Health Is Power (HIP) project was funded by a grant (1R01CA109403) from the National Institutes of Health National Cancer Institute awarded to Dr Lee at the University of Houston.
Contributor Information
Rebecca E. Lee, College of Nursing and Health Innovation, Arizona State University, Phoenix, Arizona.
Scherezade K. Mama, Department of Health Disparities Research, The University of Texas M.D. Anderson Cancer Center, Houston, Texas.
Heather J. Adamus-Leach, Texas Obesity Research Center, Department of Health and Human Performance, University of Houston, Houston, Texas. Faculty of Kinesiology, University of Calgary, Calgary, Alberta, Canada.
Erica G. Soltero, Texas Obesity Research Center, Department of Health and Human Performance, University of Houston, Houston, Texas.
References
- 1.Abeyta IM, Tuitt NR, Byers TE, Sauaia A. Effect of community affluence on the association between individual socioeconomic status and cardiovascular disease risk factors, Colorado, 2007–2008. Prev Chronic Dis. 2012;9:E115. doi: 10.5888/pcd9.110305. [DOI] [PMC free article] [PubMed] [Google Scholar]
- 2.Boone-Heinonen J, Evenson KR, Song Y, Gordon-Larsen P. Built and socioeconomic environments: patterning and associations with physical activity in US adolescents. Int J Behav Nutr Phys Act. 2010;7:45. doi: 10.1186/1479-5868-7-45. [DOI] [PMC free article] [PubMed] [Google Scholar]
- 3.Lee RE, Adamus-Leach HJ, Cheung KC, et al. Researching those who have the most to gain: focused physical activity promotion in lower socioeconomic populations. Curr Cardiovas Risk Rep. 2012;6(4):355–361. [Google Scholar]
- 4.Lee RE, Cubbin C, Winkleby M. Contribution of neighbourhood socioeconomic status and physical activity resources to physical activity among women. J Epidemiol Community Health. 2007;61(10):882–890. doi: 10.1136/jech.2006.054098. [DOI] [PMC free article] [PubMed] [Google Scholar]
- 5.Turrell G, Haynes M, Wilson LA, Giles-Corti B. Can the built environment reduce health inequalities: a study of neighbourhood socioeconomic disadvantage and walking for transport. Health Place. 2013;19:89–98. doi: 10.1016/j.healthplace.2012.10.008. [DOI] [PubMed] [Google Scholar]
- 6.Sallis JF, Saelens BE, Frank LD, et al. Neighborhood built environment and income: examining multiple health outcomes. Soc Sci Med. 2009;68(7):1285–1293. doi: 10.1016/j.socscimed.2009.01.017. [DOI] [PMC free article] [PubMed] [Google Scholar]
- 7.Spence JC, Lee RE. Toward a comprehensive model of physical activity. Psychol Sport Exerc. 2003;4:7–24. [Google Scholar]
- 8.Lee RE, Cubbin C. Striding toward social justice: the ecologic milieu of physical activity. Exerc Sport Sci Rev. 2009;37(1):10–17. doi: 10.1097/JES.0b013e318190eb2e. [DOI] [PMC free article] [PubMed] [Google Scholar]
- 9.McAlexander KM, Banda JA, McAlexander JW, Lee RE. Physical activity resource attributes and obesity in low-income African Americans. J Urban Health. 2009;86(5):696–707. doi: 10.1007/s11524-009-9385-0. [DOI] [PMC free article] [PubMed] [Google Scholar]
- 10.Lee RE, Booth KM, Reese-Smith JY, et al. The Physical Activity Resource Assessment (PARA) instrument: evaluating features, amenities and incivilities of physical activity resources in urban neighborhoods. Int J Behav Nutr Phys Act. 2005;2:13. doi: 10.1186/1479-5868-2-13. [DOI] [PMC free article] [PubMed] [Google Scholar]
- 11.Sallis JF, Hovell MF, Hofstetter CR, et al. Distance between homes and exercise facilities related to frequency of exercise among San Diego residents. Public Health Rep. 1990;105(2):179–185. [PMC free article] [PubMed] [Google Scholar]
- 12.Cutumisu N, Spence JC. Sport fields as potential catalysts for physical activity in the neighbourhood. Int J Environ Res Public Health. 2012;9(1):294–314. doi: 10.3390/ijerph9010294. [DOI] [PMC free article] [PubMed] [Google Scholar]
- 13.Karusisi N, Bean K, Oppert JM, et al. Multiple dimensions of residential environments, neighborhood experiences, and jogging behavior in the RECORD Study. Prev Med. 2012;55(1):50–55. doi: 10.1016/j.ypmed.2012.04.018. [DOI] [PubMed] [Google Scholar]
- 14.Estabrooks PA, Lee RE, Gyurcsik NC. Resources for physical activity participation: does availability and accessibility differ by neighborhood socioeconomic status? Ann Behav Med. 2003;25(2):100–104. doi: 10.1207/S15324796ABM2502_05. [DOI] [PubMed] [Google Scholar]
- 15.Michael YL, Perdue LA, Orwoll ES, et al. Physical activity resources and changes in walking in a cohort of older men. Am J Public Health. 2010;100(4):654–660. doi: 10.2105/AJPH.2009.172031. [DOI] [PMC free article] [PubMed] [Google Scholar]
- 16.Cutts BB, Darby KJ, Boone CG, Brewis A. City structure, obesity, and environmental justice: an integrated analysis of physical and social barriers to walkable streets and park access. Soc Sci Med. 2009;69(9):1314–1322. doi: 10.1016/j.socscimed.2009.08.020. [DOI] [PubMed] [Google Scholar]
- 17.Svastisalee C, Schipperijn J, Hostein BE, et al. Exposure to physical activity resources by neighborhood sociodemographic characteristics in Copenhagen. J Phys Act Health. 2012;9(8):1065–1073. doi: 10.1123/jpah.9.8.1065. [DOI] [PubMed] [Google Scholar]
- 18.Kaczynski AT, Potwarka LR, Saelens BE. Association of park size, distance, and features with physical activity in neighborhood parks. Am J Public Health. 2008;98(8):1451–1456. doi: 10.2105/AJPH.2007.129064. [DOI] [PMC free article] [PubMed] [Google Scholar]
- 19.Zoellner J, Hill JL, Zynda K, et al. Environmental perceptions and objective walking trail audits inform a community-based participatory research walking intervention. Int J Behav Nutr Phys Act. 2012;9:6. doi: 10.1186/1479-5868-9-6. [DOI] [PMC free article] [PubMed] [Google Scholar]
- 20.Colabianchi N, Maslow AL, Swayampakala K. Features and amenities of school playgrounds: a direct observation study of utilization and physical activity levels outside of school time. Int J Behav Nutr Phys Act. 2011;8:32. doi: 10.1186/1479-5868-8-32. [DOI] [PMC free article] [PubMed] [Google Scholar]
- 21.Powell LM, Slater S, Chaloupka FJ, Harper D. Availability of physical activity-related facilities and neighborhood demographic and socioeconomic characteristics: a national study. Am J Public Health. 2006;96(9):1676–1680. doi: 10.2105/AJPH.2005.065573. [DOI] [PMC free article] [PubMed] [Google Scholar]
- 22.Cleland VJ, Timperio A, Crawford D. Are perceptions of the physical and social environment associated with mothers’ walking for leisure and for transport: a longitudinal study. Prev Med. 2008;47(2):188–193. doi: 10.1016/j.ypmed.2008.05.010. [DOI] [PubMed] [Google Scholar]
- 23.Lee RE, Mama SK, Medina AV, et al. Multiple measures of physical activity, dietary habits and weight status in African American and Hispanic or Latina women. J Community Health. 2011;36(6):1011–1023. doi: 10.1007/s10900-011-9403-5. [DOI] [PMC free article] [PubMed] [Google Scholar]
- 24.Lee RE, Medina AV, Mama SK, et al. Health is Power: an ecological, theory-based health intervention for women of color. Contemp Clin Trials. 2011;32(6):916–923. doi: 10.1016/j.cct.2011.07.008. [DOI] [PMC free article] [PubMed] [Google Scholar]
- 25.Lee RE, O’Connor DP, Smith-Ray R, et al. Mediating effects of group cohesion on physical activity and diet in women of color: health is power. Am J Health Promot. 2012;26(4):e116–e125. doi: 10.4278/ajhp.101215-QUAN-400. [DOI] [PMC free article] [PubMed] [Google Scholar]
- 26.Thomas S, Reading J, Shephard RJ. Revision of the Physical Activity Readiness Questionnaire (PAR-Q) Can J Sport Sci. 1992;17(4):338–345. [PubMed] [Google Scholar]
- 27.California Department of Public Health. [Accessed December 6, 2013];Maternal and Infant Health Assessment (MIHA) Survey. 2006 Available at: http://www.cdph.ca.gov/data/surveys/Pages/MaternalandInfantHealthAssessment%28MIHA%29survey.aspx.
- 28.Centers for Disease Control and Prevention. [Accessed December 6, 2013];Pregnancy Risk Assessment Monitoring System. 2006 Available at: http://www.cdc.gov/reproductivehealth/PrenatalSmkbk/data_sources_definitions.htm.
- 29.Sarnoff R, Hughes D. Increasing health insurance coverage in the first year of life. Matern Child Health J. 2005;9(4):343–350. doi: 10.1007/s10995-005-0023-5. [DOI] [PubMed] [Google Scholar]
- 30.Sjostrom M. [Accessed December 6, 2013];International Physical Activity Questionnaire (IPAQ) 2001 Available at: http://www.ipaq.ki.se/index.htm.
- 31.Craig CL, Marshall AL, Sjostrom M, et al. International physical activity questionnaire: 12-country reliability and validity. Med Sci Sports Exerc. 2003;35(8):1381–1395. doi: 10.1249/01.MSS.0000078924.61453.FB. [DOI] [PubMed] [Google Scholar]
- 32.ActiGraph. [Accessed December 6, 2013];2009 Available at: http://www.theactigraph.com.
- 33.Welk GJ. Principles of design and analyses for the calibration of accelerometry-based activity monitors. Med Sci Sports Exerc. 2005;37(11 suppl):S501–S511. doi: 10.1249/01.mss.0000185660.38335.de. [DOI] [PubMed] [Google Scholar]
- 34.Layne CS, Mama SK, Banda JA, Lee RE. Development of an ecologically valid approach to assess moderate physical activity using accelerometry in community dwelling women of color: a cross-sectional study. Int J Behav Nutr Phys Act. 2011;8:21. doi: 10.1186/1479-5868-8-21. [DOI] [PMC free article] [PubMed] [Google Scholar]
- 35.Parmenter B, McMillan T, Cubbin C, Lee R. Developing geospatial data management, recruitment, and analysis techniques for physical activity research. J Urban Reg Inf Syst Assoc. 2008;20(2):13–19. [Google Scholar]
- 36.Heinrich KM, Lee RE, Regan GR, et al. How does the built environment relate to body mass index and obesity prevalence among public housing residents? Am J Health Promot. 2008;22(3):187–194. doi: 10.4278/ajhp.22.3.187. [DOI] [PubMed] [Google Scholar]
- 37.Heinrich KM, Lee RE, Suminski RR, et al. Associations between the built environment and physical activity in public housing residents. Int J Behav Nutr Phys Act. 2007;4:56. doi: 10.1186/1479-5868-4-56. [DOI] [PMC free article] [PubMed] [Google Scholar]
- 38.United States Census Bureau. [Accessed December 6, 2013];Median Income in the Past 12 Months 2006–2010 American Community Survey 5-Year Estimates. 2006–2010 Available at: http://factfinder2.census.gov/faces/nav/jsf/pages/searchresults.xhtml?refresh=t.
- 39.McAlexander KM, Mama SK, Medina A, et al. The concordance of directly and indirectly measured built environment attributes and physical activity adoption. Int J Behav Nutr Phys Act. 2011;8:72. doi: 10.1186/1479-5868-8-72. [DOI] [PMC free article] [PubMed] [Google Scholar]