



Abstract
Higher order chromatin structure is emerging as an important regulator of gene expression. Although dynamic chromatin structures have been identified in the genome, the full scope of chromatin dynamics during mammalian development and lineage specification remains obscure. By mapping genome-wide chromatin interactions in human embryonic stem cells (hESC) and four hESC-derived lineages, we uncover extensive chromatin reorganization during lineage specification. We observe that while topological domain boundaries remain intact during differentiation, interactions both within and between domains change dramatically, altering 36% of active and inactive chromosomal “compartments” throughout the genome. By integrating chromatin interaction maps with haplotype-resolved epigenome and transcriptome datasets, we find widespread allelic bias in gene expression correlated with allele-biased chromatin states of linked promoters and distal enhancers. Our results therefore provide a global view of chromatin dynamics and a resource for studying long-range control of gene expression in distinct human cell lineages.
Three-dimensional genome organization is increasingly considered an important regulator of gene expression1-4. Recent high-throughput studies of chromatin structure have begun to shed light on the global organization of our genome4-10. For instance, we and others recently discovered that interphase chromosomes are partitioned into megabase-sized topological domains and smaller sub-domains (also known as topologically associated domains or TADs)6-9. These TADs form the basis for higher level structures referred to as the “A” and “B” compartments5, 6, which are closely linked to DNA replication and nuclear lamina association11, 12. Despite these advances, our understanding of the dynamic nature of chromatin architecture across human cell types and its impact on cellular identity is incomplete. Here, we analyze genome-wide higher order chromatin interactions in H1 hESCs and four hESC derived lineages, Mesendoderm (ME), Mesenchymal Stem Cells (MSC), Neural Progenitor Cells (NPC), and Trophoblast-Like Cells13 (TB). These lineages represent extra-embryonic and embryonic lineages at early stages of development and have been extensively characterized by the Epigenome Roadmap project13, with datasets including mRNA-seq, ChIP-seq for 13-24 histone modifications, base-resolution MethylC-seq, and DNaseI Hypersensitivity in each lineage13, 14. As such, this experimental system provides an opportunity to compare variability in higher-order chromatin structure with underlying gene expression and chromatin state in a genome-wide manner. Further, using a newly developed method to reconstruct haplotypes from Hi-C data15, we have phased the H1 genome to allow for analysis of allele-specific activity and chromatin structure. This represents the most extensive data set generated to date for the analysis of higher-order chromatin structure, allele-specific chromatin structure and state, and allele-specific gene expression.
Results
We present genome-wide higher order chromatin interactions in H1 hESCs and four hESC derived lineages13. We performed Hi-C experiments5 in two biological replicates in H1 hESCs and each of the four H1-derived lineages, generating a total of 3.85 billion unique read pairs (Supplemental Table 1). We normalized the intrinsic biases in Hi-C data16, and confirmed the high reproducibility and accuracy of our Hi-C datasets using several metrics (Supplemental materials, Supplemental Table 2, Extended Data Figure 1a-d).
Extensive A/B compartment switching
Hi-C interaction maps provide information on multiple hierarchical levels of genome organization4. Previous studies demonstrated that the genome is organized into A and B compartments, containing relatively active and inactive regions, respectively5, 11. Currently, it is unclear if the A and B compartments change during differentiation and how this relates to lineage specification. We observe a large degree of spatial plasticity in the arrangement of the A/B compartments across cell types, with 36% of the genome switching compartments in at least one of the lineages analyzed (Supplemental methods; Figure 1a, Extended Data Figure 2a-c). Many of the A/B compartment transitions are lineage-restricted (Figure 1b). Notably, there appears to be a large expansion of the B compartment upon differentiation of hESCs to MSCs or in IMR90 fibroblasts. These two cell types have previously been shown to undergo an expansion of repressive heterochromatin modifications during differentiation13, 17. In this regard, there appears to be a similar redistribution of the spatial organization of their genomes as well. We observe that the regions that change their A/B compartment status typically correspond to a single or series of TADs (Figure 1a,c, Extended Data Figure 2d,e), suggesting that TADs are the units of dynamic alterations in chromosome compartments. Consistent with previous studies of individual loci 18, 19, 20, we found that genes that change from compartment A to B tend to show reduced expression, while genes that change from B to A tend to show higher expression (Figure 1d). In addition, lineage-restricted compartment A regions tend to include more lineage-restricted genes compared to other regions (Extended Data Figure 3a). While statistically significant, the overall patterns of change in expression are subtle. Reasoning that this modest correlation may be due to the possibility that only a subset of genes may be affected by compartment changes, while most genes remain unaffected, we identified a subset of 718 genes with co-variation between gene expression and compartment switching (Supplemental Methods, Extended Data Figure 3b,c, Figure 1e). These genes were enriched for low CpG content promoters (21.8% vs. 15.6% for non-concordant genes, p-value 8e-11, Fisher's Exact Test), and several significant Gene Ontology (GO) terms, most notably related to extra-cellular proteins and extra-cellular matrix (Supplemental Table 3). Taken together, these results indicate that at a global level, there is a high degree of plasticity in the A and B compartments, yet relatively subtle corresponding changes in gene expression, indicating that the A and B compartments have a contributory but not deterministic role in determining cell type specific patterns of gene expression.
Figure 1. Dynamic reorganization of chromatin structure during differentiation of hESCs.
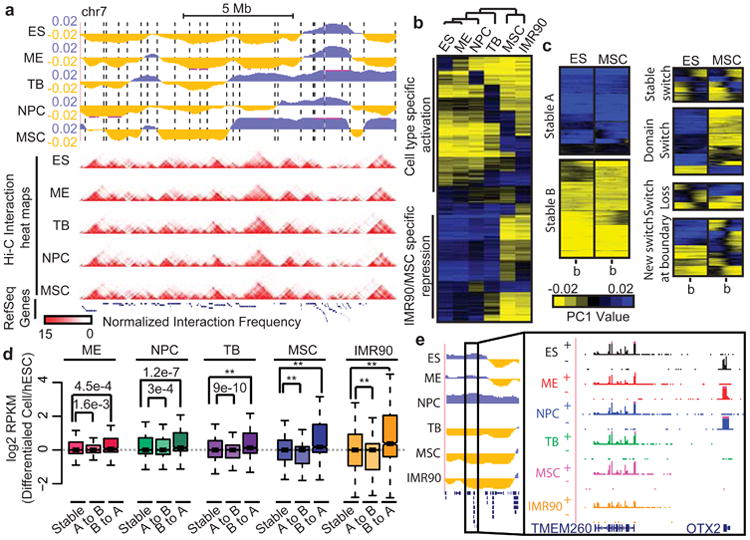
a, First principle component (PC1) values and Hi-C interaction heat maps in H1 ES cells and H1-derived lineages. PC1 values are used to determine the A/B compartment status of a given region, where positive PC1 values represent “A” compartment regions (blue), and negative values represent “B” compartment regions (yellow). Dashed lines indicate TAD boundaries in ESCs. b, K-means clustering (k=20) of PC1 values for 40kb regions of the genome that change A/B compartment status in at least one lineage. c, K-means clustering of PC1 values surrounding TAD boundaries. d, Distribution of fold-change in gene expression for genes that change compartment status (“A to B” or “B to A”) or that remain the same (“stable”) upon differentiation. e, Genome browser of two genes where one (OTX2) shows concordant expression and PC1 values while a second (TMEM260) does not.
Domain level chromatin dynamics
We next examined higher-order chromatin structure at a sub-chromosomal scale. Previous studies indicated that chromosomes are composed of cell type invariant topological domains (TADs)6, 8. Across the six lineages analyzed in this study, we observe that while the positioning of TADs remains stable between cell types (Figure 2a), numerous changes in chromatin structure occur within domains. We observed a phenomenon that within some domains, a large portion of the interactions appears to increase or decrease across the entire domain between cell types (Figure 2b). This suggests that a subset of TADs in a given lineage undergo concerted, domain-wide changes in interaction frequency. Hundreds of TADs underwent such alterations in each lineage (Figure 2b, Extended Data Figure 3d), with the changes in interaction frequency correlated positively with active marks such as DHS, H3K27ac, and with CTCF binding, and negatively with repressive chromatin modifications such as H3K27me3 and H3K9me3 (Figure 2c, See Supplemental Methods for details). TADs that have a concerted increase in intra-domain interaction frequency tend to shift from the B to A compartments, while domains that have a concerted decrease in interaction frequency tend to shift from A to B (Extended Data Figure 3e,f). Consistent with the changes in chromatin state activity, genes within domains that have increased intra-domain interaction frequency tend to be up-regulated while genes within domains that decrease intra-domain interaction frequency tend to be down-regulated (Extended Data Figure 3g,h).
Figure 2. Domain-wide alterations in chromatin interaction frequency and chromatin state.
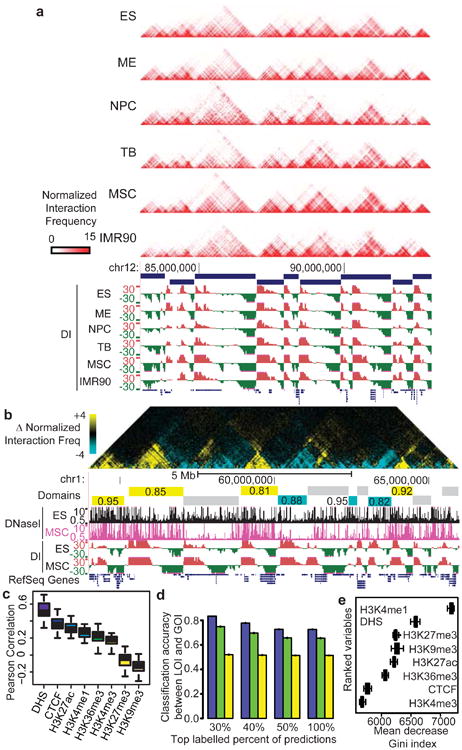
a, Chromatin interaction heat maps in H1 lineages and IMR90 fibroblasts. Also shown are domain calls in ES cells and the directionality index (DI) in each lineage. b, Changes in interaction frequency between ES and MSC. Regions with higher interaction frequency in ES are shown in blue, while regions with higher interaction frequency in MSC are shown in yellow. TADs having a concerted increase or decrease in intra-domain interaction frequency are labeled yellow or blue, respectively, with the fraction of the domain showing increased or decreased interaction frequency listed. Domains that do not show a concerted change are shown in gray. c, Boxplots of Pearson correlations coefficients between interaction frequency changes and chromatin mark changes across TADs. d, Classification accuracy of the Random Forest model in predicting whether a bin increases or decreases in interaction frequency, tested on 10 randomly selected subsets of Hi-C data. Accuracy was also checked using actual data (blue), circularized permutation (green) and a random permutation (yellow) of the data. As expected, randomly permuting the data yields 50% accuracy. Accuracy was also assessed considering the top 30, 40, 50%, or all predictions based on vote frequency difference (error bars show the standard deviation of accuracies from the 10 randomly selected data subsets). e, Ranked chromatin features shown according to importance in classification (mean decrease of Gini index).
Chromatin state and dynamic interactions
In order to understand the relationship between chromatin dynamics and other genomic and epigenomic features, we performed integrative analysis of the Hi-C data along with the plethora of histone modifications, DHS, and CTCF binding data in the six lineages. Specifically, we asked if particular chromatin state patterns predict changes in chromatin interaction frequency. We divided the genome into 40kb bins and computed changes in chromatin features in each bin upon differentiation. We then built a Random Forest classification model based on chromatin features to classify local interacting bins as having either increased or decreased interaction frequency (See Supplementary Methods for details). The model was able to classify regions of the genome that increased or decreased interaction frequency with 73% accuracy (Figure 2d “100%” graph, Extended Data Figure 4a), which increased to over 80% when we consider only the highest confidence predictions as based on the vote frequency difference (Figure 2d, “30%” graph). The Random Forest model not only indicates that chromatin state features provide information on changes in interaction frequency, it also allows us to determine which chromatin marks are most predictive. Specifically, the “mean decrease” of the Gini index for each chromatin mark indicates the importance of a given feature during classification. In this regard, we found that change in H3K4me1 density is the most important feature in predicting changes in long-range chromatin interactions (Figure 2e, Extended Data Figure 4b,c). As H3K4me1 is present mostly at poised or active enhancers21, 22, and as enhancers are known to engage in looping interactions that exist in a cell-type specific manner23, these results suggest that enhancer dynamics may play a role in regulating local interaction changes during lineage specification. Consistent with this hypothesis, 40kb regions with increased interaction frequency tend to have increased enhancer density (Extended Data Figure 4d, e).
Allele specific chromatin organization
Normal diploid human cells contain two copies of each chromosome. Previous studies have revealed substantial differences between alleles in gene expression, DNA methylation, and chromatin states24-29. Apart from studies of individual loci in the genome 30,31,32, little is known about the variability in higher-order chromatin structure between homologous chromosomes. Recent work from our laboratory15 has demonstrated that Hi-C data can be re-purposed to reconstruct chromosome-span haplotypes, which allows for the study of chromatin state and gene expression as a true diploid. We generated chromosome-span haplotypes incorporating ∼93.5% of all heterozygous variants for H1 from a combination of Hi-C datasets, whole genome sequencing, and local conditional phasing15 (Figure 3a). We observe a high level of concordance among the predicted haplotypes and paired sequence reads from datasets with “long insert” sizes (Extended Data Figure 5a), indicating that the reconstructed haplotypes are of high quality. Next, we re-analyzed datasets from Hi-C, mRNA-seq, ChIP-seq, MethylC-Seq, and DNase-seq experiments and determined from which parental haplotype (arbitrarily termed “p1” and “p2”) each sequence read was derived (Figure 3b, Extended Data Figure 5b).
Figure 3. Haplotype-resolved chromatin organization in H1 lineages.

a, Variants per megabase for all (green), phased (orange) and unphased variants (purple) along chromosome 1. The inset zooms in on a ∼1Mb region, where the presence of a variant at each base is indicated by a value of 1. b, Genome browser shots of allele specific chromatin features and strand-specific mRNA-sequencing. c, Genome browser shot of PC1 values along chromosome 2 for the p1 and p2 allele. d, Allele specific compartment A/B patterns and mRNA-seq surrounding the imprinted ZDBF2 gene. e, Boxplots of the difference between alleles of PC1 values. Regions with imprinted genes (p=0.003) and allelic genes (p=0.002) have more variable PC1 values (KS-test). f. Similar to e, but for regions with differential allelic chromatin activity (the number of allelic biased variants per 200kb bin). Regions in the top 0.1% of differential allelic activities (orange) show greater differences in PC1 values compared other regions. (p=1.6e-08 and p=0.0015, respectively, KS-test).
From the haplotype-resolved “A” and “B” compartment patterns across the p1 and p2 alleles in each lineage, we found that homologous chromosomes have highly similar A/B compartment patterns (Figure 3c, Extended Data Figure 5c-e), with only 0.6-2.3% of the genome having different A/B compartments between alleles in any given cell type (Extended Data Figure 5f). Notably, rare regions of the genome do show changes in A/B compartment status between alleles (Figure 3d), but are not enriched for allele-biased or imprinted genes (Extended Data Figure 5g,h). On the contrary, regions of the genome containing allele-biased or imprinted genes have a subtle but statistically significant increase in the variability of A/B compartment scores between alleles (Figure 3e). Likewise, the genomic regions with allelic chromatin states are greater variability in A/B compartment scores (Figure 3f). This indicates that while most allele-biased and imprinted genes do not have differential compartment status between alleles, there may be subtle differences in higher-order chromatin structure between homologous chromosomes at allele-biased regions, reflecting their underlying allele biases in activity. Lastly, similar to A/B compartment patterns, topological domains patterns appear consistent between alleles (Extended Data Figure 6a,b). In summary, these results suggest that the global folding patterns of homologous chromosomes are highly similar.
Allelic imbalances in gene expression
Previous studies of allele-resolved gene expression have identified widespread allelic imbalances in gene expression between alleles24-27, 33. However, it remains unclear to what degree allele-biased gene expression varies among different lineages of a single individual. To address this, we re-analyzed haplotype-resolved mRNA-seq data and identified allelic biases in gene expression across the five H1 lineages. A total of 1,787 genes showed allelic bias in gene expression in one or more lineages studied here, representing ∼24% of all testable genes (FDR 10%, Figure 4a). Most allelic differences in expression are not “on/off” events, but instead reflect biases in the level of expression from each allele (Figure 4b). Further, allele-biased genes include both lineage specific and constitutively expressed genes (Extended Data Figure 6c,d), and patterns of allelic bias can also be constitutive or cell-type variable (Figure 4c,d). Only in rare cases do genes switch expression from one allele to the other between cell types.
Figure 4. Allelic biases in gene expression in H1 lineages.
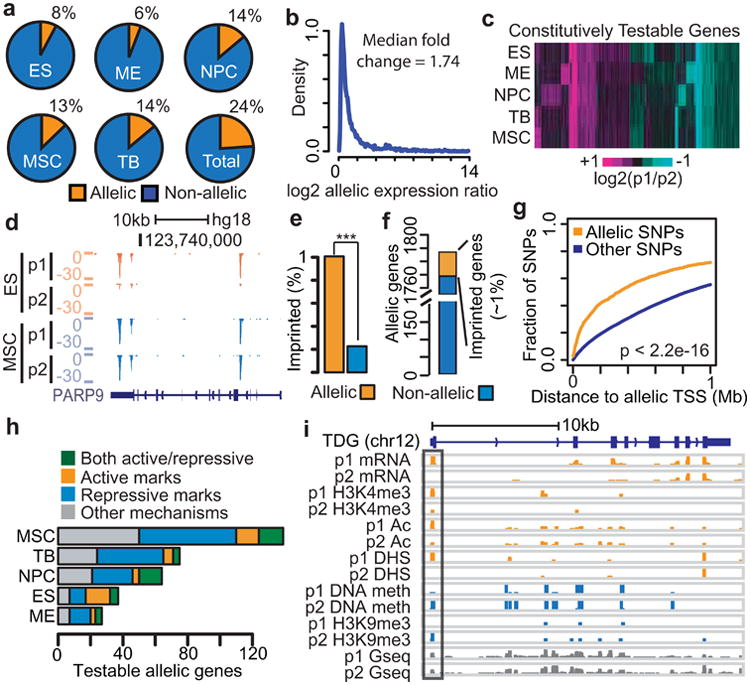
a, Proportion of genes with detectable allelic expression with statistically significant allelic bias. b, Density plot of the absolute value of the fold change in expression (log2) between alleles. c, Heat map showing k-means (k=20) clustering of the allelic expression ratios (log2) at genes with constitutively testable expression. d, Genome browser shot of variable allelic expression of the PARP9 gene. e, Fraction of imprinted genes among allele-biased genes and other genes. (p=4.4e-5, Fisher exact test). f, Fraction of allele-biased genes that are known imprinted genes. g, Cumulative density plot of distances from variants to the nearest allele-specific gene. Allele specific variants are defined using histone acetylation, H3K9me3, H3K27me3, DNaseI HS, and H3K4me3 (p<2.2e-16, KS-test). h, Number of allele-biased genes showing consistent allele specific chromatin states in their promoter regions. Active variants are defined by H3K4me3, DNaseI HS, or histone acetylation. Inactive promoter variants are defined by DNA methylation and H3K9me3/27me3. i, Genome browser shot of mRNA-seq and chromatin features surrounding the TDG gene.
As expected, genes subject to genomic imprinting are enriched among genes with allelic biases in expression (Figure 4e), though these represent ∼1% of allele-biased genes (Figure 4f). While imprinted genes often occur in clusters, the majority of allele-biased gene expression is not clustered in the genome (Extended Data Figure 6e). Taken together, these data suggest that most allelic gene expression is due to mechanisms other than genomic imprinting. One possible regulatory mechanism that could give rise to allele-biased expression would be allelic bias in activity of cis-regulatory elements near these genes. Indeed, regions of the genome that show allele bias in histone acetylation, histone methylation, CTCF, and DNase I hypersensitivity are closer to allele-biased genes than randomly selected genomic regions (Figure 4g). Furthermore, allelic gene expression is strongly correlated with DNA methylation or chromatin modification state at promoters (Figure 4h,i). Of the 247 genes that contain heterozygous variants in their promoter regions and display biased transcription in at least one lineage, a majority exhibit allele-biased chromatin modifications or DNA methylation at the promoter (Figure 4h). Interestingly, 29% of the testable genes that have allele-biased expression show no evidence of allelic bias in chromatin state or DNA methylation at the promoter (Figure 4h), raising the possibility that elements outside of promoters may be responsible for the allelic gene expression.
We identified 726, 969, and 5769 allelic enhancers13 that showed allele bias in histone acetylation, DNase I HS, and DNA-methylation, respectively (Figure 5a). We observed a general concordance in allelic biases between enhancers exhibiting allelic histone acetylation and enhancers showing allelic DHS (Figure 5a). However, we observe only modest concordance between DHS or acetylation defined enhancers with those identified based on allelic DNA-methylation (Figure 5a). This may reflect greater power in identifying differentially methylated regions between the two alleles. Alternatively, this may reflect the presence of “poised” enhancers, where there is not a strict relationship between differences in DNA-methylation and enhancer or DHS state34, 35. Enhancers with allele-biased acetylation are generally located closer to genes that also show allele-biased expression when compared with enhancers that lack allele bias (Figure 5b, Extended Data Figure 6f). A majority (66%) of the 640 allelic genes that display strong Hi-C interactions with allelic enhancers also show concordant allelic activity between the enhancer and promoter (Figure 5c, Extended Data Figure 7, and Supplemental Methods). Additionally, enhancer-gene pairs linked by relatively strong Hi-C interactions show greater correlation between allelic enhancer activity and allelic gene expression compared with pairs linked by weaker Hi-C interactions (Figure 5d). To test if allelic enhancers indeed form specific contacts with allele-biased genes, we performed 4C-seq31, 36 with 6 allele-biased enhancers and identified that 4 out of these 6 allelic enhancers showed specific 4C interactions with a nearby allele-biased gene (Figure 5e, Extended Data Figure 8, Supplemental Table 4). Taken together, our results strongly support that allele-biased enhancer activity is a possible mechanism underlying allele-biased gene expression.
Figure 5. Allele biases at enhancers in H1 lineages.

a, Enrichment of acetylation (top row), DHS (middle) and DNA-methylation (bottom) at enhancers defined as allelic by acetylation (left column), DHS (middle), or DNA-methylation (right). The active allele is in blue, inactive allele in red. b, The distance between allelic genes and enhancers as defined by allelic histone acetylation (purple) compared with randomly selected enhancers (grey). Random enhancers were selected to match the read coverage of allele-biased enhancers. c, Number of allele specific genes linked to concordantly biased allele specific enhancers. Genes linked by “long-range enhancers” are defined using Hi-C interaction frequencies, while “short-range enhancers” are defined as any enhancer less than 20kb from a genes transcription start site. d, Boxplots of the Pearson correlation coefficients between allelic gene-enhancer pairs defined by acetylation (left) or DNaseI (right). Gene-enhancer pairs are grouped into strongly interacting (top 30%), weakly interacting (bottom 30%), and intermediately interacting pairs (others) based on Hi-C interaction frequency (p-values using Welch's t-test). e, Normalized 4C-seq interaction frequencies near the HAPLN1 gene. The 4C-seq bait region is in an allele-biased enhancer near the 3′ end of the EDIL3 gene. Specific interactions called by the LOWESS regression model are shown in black as “bait interacting regions (BIRs).” f, Allele-biased expression of the two alleles of the HAPLN1 gene, histone acetylation levels at the nearby interacting allele-biased enhancer, and allele resolved 4C-seq data (4C-seq p-value from T-test, n=2 for p1 allele, n=2 for p2 allele).
To determine if part of the mechanism of regulation by allele-biased enhancers also involved allelic chromatin looping between distal enhancers and putative target genes, we tested for the presence of allele-biased Hi-C reads at allele-biased enhancers throughout the H1 genome by aggregating all Hi-C reads between allelic enhancers and the promoters of nearby allelic genes. We observed that alleles containing enhancer activity generally have higher numbers of chromatin interactions with the target promoters (Extended Data Figure 9a). This result is confirmed by re-analysis of previous high-resolution 4C-seq results 31. Two loci (HAPLN1 and MAN1C1) show a similar trend between allele bias in enhancer-promoter interactions with the allelic enhancer acetylation and gene expression levels (Figure 5f, Extended Data Figure 9), though the trend in the allelic 4C-seq does not meet statistical significance. The remaining two loci (FAM65B, PXK) appear to have nearly equal interaction frequencies with the target promoters. Taken together, these results suggest that the allele-biased enhancers can impart allele-biased gene expression either through stable higher-order DNA looping between the two alleles or through potential allele specific enhancer-promoter interactions.
Discussion
We have presented genome-wide chromatin interaction maps in H1 hESCs and four H1-derived lineages. We observed dynamic reorganization of higher order chromatin structure during ES cell differentiation at multiple hierarchical scales. We found extensive switching between the “A” and “B” compartments during ES cell differentiation, and observed that distinct subsets of genes have concordant A/B compartments status and expression levels. In this regard, these results are similar to what has been seen with nuclear lamina tethering studies20, 37-39, where the expression of only a subset of genes is affected by compartment changes, while other genes remain unaffected. Changes in compartment status may influence the accessibility of genomic regions to transcription factors or other regulatory proteins, which may be particularly important for certain subsets of genes.
In addition, we have observed local alterations in chromatin interaction frequency within TADs. These local changes are best predicted by changes in levels of H3K4me1 and the density of enhancer elements. This is in agreement with recent 5C studies demonstrating that cell-type specific interaction regions are enriched for Smc1, mediator, and transcription factor binding sites7. Taken together, these results suggest that enhancer elements likely play an important role in shaping local higher-order chromatin structure throughout the genome. In addition, by analyzing patterns of chromatin interactions on each parental allele, we observe relatively minor global changes in higher-order chromatin structure between alleles.
The chromatin interaction maps generated in this study also allowed the reconstruction of chromosome-span haplotypes for the H1 genome. This dataset represents one of the first studies of allele-biased expression across multiple cell types of a single individual as well as analysis of chromatin state at the linked cis regulatory elements. Our dataset will serve as a valuable tool for the community to better understand the gene regulatory networks controlling pluripotency and differentiation of human embryonic stem cells.
Supplementary Material
Acknowledgments
We thank the members of the Ren laboratory for support and critical suggestions throughout the course of this work. This work is funded in part by the Ludwig Institute for Cancer Research, the NIH Roadmap Epigenome Project, and the California Institute of Regenerative Medicine. Y.D. is supported by a postdoctoral fellowship from the Human Frontier Science Program (LT000576/2014-L).
Footnotes
Supplementary Information is linked to the online version of the paper at www.natrue.com/nature
Author Contributions: JD, IJ, SS, and BR conceived the study. JD performed Hi-C and 4C experiments with assistance from AK. JD, IJ, and SS performed the data analysis. AYL performed ChIP-seq experiments for CTCF with assistance from ZY. JAB performed ES cell culture, differentiation, and harvesting. NR and WX provided expertise and assistance in data analysis. YS, YD, VL, JE, and JT provided insights and support with the design and execution of the project. JD and IJ prepared the manuscript with assistance from SS and BR.
Author Information: All data from this study have been deposited in the GEO database under the accession number GSE52457. Reviewers can access the data using the reviewer access link.
The authors declare no competing financial interests.
References
- 1.Smallwood A, Ren B. Genome organization and long-range regulation of gene expression by enhancers. Curr Opin Cell Biol. 25:387–94. doi: 10.1016/j.ceb.2013.02.005. [DOI] [PMC free article] [PubMed] [Google Scholar]
- 2.Phillips JE, Corces VG. CTCF: master weaver of the genome. Cell. 2009;137:1194–211. doi: 10.1016/j.cell.2009.06.001. [DOI] [PMC free article] [PubMed] [Google Scholar]
- 3.Lettice LA, et al. Disruption of a long-range cis-acting regulator for Shh causes preaxial polydactyly. Proc Natl Acad Sci U S A. 2002;99:7548–53. doi: 10.1073/pnas.112212199. [DOI] [PMC free article] [PubMed] [Google Scholar]
- 4.Gorkin DU, Leung D, Ren B. The 3D genome in transcriptional regulation and pluripotency. Cell Stem Cell. 2014;14:762–75. doi: 10.1016/j.stem.2014.05.017. [DOI] [PMC free article] [PubMed] [Google Scholar]
- 5.Lieberman-Aiden E, et al. Comprehensive mapping of long-range interactions reveals folding principles of the human genome. Science. 2009;326:289–93. doi: 10.1126/science.1181369. [DOI] [PMC free article] [PubMed] [Google Scholar]
- 6.Dixon JR, et al. Topological domains in mammalian genomes identified by analysis of chromatin interactions. Nature. 485:376–80. doi: 10.1038/nature11082. [DOI] [PMC free article] [PubMed] [Google Scholar]
- 7.Phillips-Cremins JE, et al. Architectural protein subclasses shape 3D organization of genomes during lineage commitment. Cell. 153:1281–95. doi: 10.1016/j.cell.2013.04.053. [DOI] [PMC free article] [PubMed] [Google Scholar]
- 8.Nora EP, et al. Spatial partitioning of the regulatory landscape of the X-inactivation centre. Nature. 485:381–5. doi: 10.1038/nature11049. [DOI] [PMC free article] [PubMed] [Google Scholar]
- 9.Sexton T, et al. Three-dimensional folding and functional organization principles of the Drosophila genome. Cell. 148:458–72. doi: 10.1016/j.cell.2012.01.010. [DOI] [PubMed] [Google Scholar]
- 10.Rao SS, et al. A 3D Map of the Human Genome at Kilobase Resolution Reveals Principles of Chromatin Looping. Cell. 2014;159:1665–80. doi: 10.1016/j.cell.2014.11.021. [DOI] [PMC free article] [PubMed] [Google Scholar]
- 11.Ryba T, et al. Evolutionarily conserved replication timing profiles predict long-range chromatin interactions and distinguish closely related cell types. Genome Res. 20:761–70. doi: 10.1101/gr.099655.109. [DOI] [PMC free article] [PubMed] [Google Scholar]
- 12.Peric-Hupkes D, et al. Molecular maps of the reorganization of genome-nuclear lamina interactions during differentiation. Mol Cell. 38:603–13. doi: 10.1016/j.molcel.2010.03.016. [DOI] [PMC free article] [PubMed] [Google Scholar]
- 13.Xie W, et al. Epigenomic analysis of multilineage differentiation of human embryonic stem cells. Cell. 153:1134–48. doi: 10.1016/j.cell.2013.04.022. [DOI] [PMC free article] [PubMed] [Google Scholar]
- 14.Maurano MT, et al. Systematic localization of common disease-associated variation in regulatory DNA. Science. 337:1190–5. doi: 10.1126/science.1222794. [DOI] [PMC free article] [PubMed] [Google Scholar]
- 15.Selvaraj S, D JR, Bansal V, Ren B. Whole-genome haplotype reconstruction using proximity-ligation and shotgun sequencing. Nat Biotechnol. 2013 doi: 10.1038/nbt.2728. [DOI] [PMC free article] [PubMed] [Google Scholar]
- 16.Hu M, et al. HiCNorm: removing biases in Hi-C data via Poisson regression. Bioinformatics. 28:3131–3. doi: 10.1093/bioinformatics/bts570. [DOI] [PMC free article] [PubMed] [Google Scholar]
- 17.Hawkins RD, et al. Distinct epigenomic landscapes of pluripotent and lineage-committed human cells. Cell Stem Cell. 6:479–91. doi: 10.1016/j.stem.2010.03.018. [DOI] [PMC free article] [PubMed] [Google Scholar]
- 18.Brown KE, et al. Association of transcriptionally silent genes with Ikaros complexes at centromeric heterochromatin. Cell. 1997;91:845–54. doi: 10.1016/s0092-8674(00)80472-9. [DOI] [PubMed] [Google Scholar]
- 19.Kosak ST, et al. Subnuclear compartmentalization of immunoglobulin loci during lymphocyte development. Science. 2002;296:158–62. doi: 10.1126/science.1068768. [DOI] [PubMed] [Google Scholar]
- 20.Holwerda S, de Laat W. Chromatin loops, gene positioning, and gene expression. Front Genet. 2012;3:217. doi: 10.3389/fgene.2012.00217. [DOI] [PMC free article] [PubMed] [Google Scholar]
- 21.Heintzman ND, et al. Distinct and predictive chromatin signatures of transcriptional promoters and enhancers in the human genome. Nat Genet. 2007;39:311–8. doi: 10.1038/ng1966. [DOI] [PubMed] [Google Scholar]
- 22.Heintzman ND, et al. Histone modifications at human enhancers reflect global cell-type-specific gene expression. Nature. 2009;459:108–12. doi: 10.1038/nature07829. [DOI] [PMC free article] [PubMed] [Google Scholar]
- 23.Sanyal A, Lajoie BR, Jain G, Dekker J. The long-range interaction landscape of gene promoters. Nature. 489:109–13. doi: 10.1038/nature11279. [DOI] [PMC free article] [PubMed] [Google Scholar]
- 24.Heinz S, et al. Effect of natural genetic variation on enhancer selection and function. Nature. doi: 10.1038/nature12615. [DOI] [PMC free article] [PubMed] [Google Scholar]
- 25.McVicker G, et al. Identification of Genetic Variants That Affect Histone Modifications in Human Cells. Science. doi: 10.1126/science.1242429. [DOI] [PMC free article] [PubMed] [Google Scholar]
- 26.Kasowski M, et al. Extensive Variation in Chromatin States Across Humans. Science. doi: 10.1126/science.1242510. [DOI] [PMC free article] [PubMed] [Google Scholar]
- 27.Kilpinen H, et al. Coordinated Effects of Sequence Variation on DNA Binding, Chromatin Structure, and Transcription. Science. doi: 10.1126/science.1242463. [DOI] [PMC free article] [PubMed] [Google Scholar]
- 28.Kuleshov V, et al. Whole-genome haplotyping using long reads and statistical methods. Nat Biotechnol. 2014;32:261–6. doi: 10.1038/nbt.2833. [DOI] [PMC free article] [PubMed] [Google Scholar]
- 29.Xie W, et al. Base-resolution analyses of sequence and parent-of-origin dependent DNA methylation in the mouse genome. Cell. 2012;148:816–31. doi: 10.1016/j.cell.2011.12.035. [DOI] [PMC free article] [PubMed] [Google Scholar]
- 30.Splinter E, et al. The inactive X chromosome adopts a unique three-dimensional conformation that is dependent on Xist RNA. Genes Dev. 25:1371–83. doi: 10.1101/gad.633311. [DOI] [PMC free article] [PubMed] [Google Scholar]
- 31.Holwerda SJ, et al. Allelic exclusion of the immunoglobulin heavy chain locus is independent of its nuclear localization in mature B cells. Nucleic Acids Res. 2013;41:6905–16. doi: 10.1093/nar/gkt491. [DOI] [PMC free article] [PubMed] [Google Scholar]
- 32.de Wit E, et al. The pluripotent genome in three dimensions is shaped around pluripotency factors. Nature. 2013;501:227–31. doi: 10.1038/nature12420. [DOI] [PubMed] [Google Scholar]
- 33.Gimelbrant A, Hutchinson JN, Thompson BR, Chess A. Widespread monoallelic expression on human autosomes. Science. 2007;318:1136–40. doi: 10.1126/science.1148910. [DOI] [PubMed] [Google Scholar]
- 34.Hon GC, et al. Epigenetic memory at embryonic enhancers identified in DNA methylation maps from adult mouse tissues. Nat Genet. 2013;45:1198–206. doi: 10.1038/ng.2746. [DOI] [PMC free article] [PubMed] [Google Scholar]
- 35.Thurman RE, et al. The accessible chromatin landscape of the human genome. Nature. 489:75–82. doi: 10.1038/nature11232. [DOI] [PMC free article] [PubMed] [Google Scholar]
- 36.van de Werken HJ, et al. Robust 4C-seq data analysis to screen for regulatory DNA interactions. Nat Methods. 2012;9:969–72. doi: 10.1038/nmeth.2173. [DOI] [PubMed] [Google Scholar]
- 37.Reddy KL, Zullo JM, Bertolino E, Singh H. Transcriptional repression mediated by repositioning of genes to the nuclear lamina. Nature. 2008;452:243–7. doi: 10.1038/nature06727. [DOI] [PubMed] [Google Scholar]
- 38.Finlan LE, et al. Recruitment to the nuclear periphery can alter expression of genes in human cells. PLoS Genet. 2008;4:e1000039. doi: 10.1371/journal.pgen.1000039. [DOI] [PMC free article] [PubMed] [Google Scholar]
- 39.Kumaran RI, Spector DL. A genetic locus targeted to the nuclear periphery in living cells maintains its transcriptional competence. J Cell Biol. 2008;180:51–65. doi: 10.1083/jcb.200706060. [DOI] [PMC free article] [PubMed] [Google Scholar]
Associated Data
This section collects any data citations, data availability statements, or supplementary materials included in this article.