Abstract
Objective
To determine agreement between spectral domain (SD) and time domain (TD) optical coherence tomography (OCT) image assessments by certified readers of fluid and thickness measurements in eyes treated with ranibizumab or bevacizumab for neovascular age-related macular degeneration (AMD).
Design
Cross-sectional study within the Comparison of AMD Treatments Trials (CATT).
Participants
1213 pairs of SDOCT and TDOCT scans were compared from a subset of 384 eyes during year 2 of CATT.
Methods
Masked readers independently graded OCT scans for presence of intraretinal fluid (IRF), subretinal fluid (SRF), and sub-retinal pigment epithelium (RPE) fluid, and performed manual measurements of retinal, SRF, and subretinal tissue complex thicknesses at the foveal center.
Main Outcome Measures
Agreement on presence of fluid was evaluated with percent agreement, kappa coefficients (k) with 95% confidence intervals (CI), and McNemar tests. Agreement on thickness measurements was evaluated with mean difference (Δ) ± 95% limits of agreement and intraclass correlation coefficients (ICC) with 95% CI.
Results
Between SDOCT and TDOCT, agreement on presence of any fluid was 82% (k=0.46; CI, 0.40–0.52), with 5% more SDOCT scans demonstrating fluid (p<0.001). Agreement on presence of SRF was 87%, and sub-RPE fluid was 80%, with more SDOCT scans demonstrating fluid (both p<0.001). Agreement on IRF was 73% (k=0.47; CI, 0.42–0.52), with 6% more TDOCT scans demonstrating fluid (p<0.001). Mean thickness of retina was 154 and 158 µm (Δ=5 ±67 µm), SRF was 11 and 10 µm (Δ=1.5 ±35 µm), and subretinal tissue complex was 132 and 126 µm (Δ=5 ±86 µm) for SDOCT and TDOCT respectively. Thickness measurements were reproducible for retina (ICC=0.84; CI, 0.83–0.86), SRF (ICC=0.88; CI, 0.86–0.89), and subretinal tissue complex (ICC=0.91; CI, 0.89–0.92), with ≤25 µm difference in these measurements in 71%, 94%, and 61% of paired scans, respectively.
Conclusions
Agreement on fluid presence and manual thickness measurements between paired scans from each OCT modality was moderate. These findings should provide a frame of reference when comparing CATT results with future SDOCT-based trials. Because fluid was detected 5% more frequently with SDOCT, its use may increase frequency of fluid-based treatment. Lower-resolution imaging and artifactual interpretation of dark areas as cystoid edema may explain the greater frequency of IRF detected with TDOCT.
INTRODUCTION
The Comparison of Age-Related Macular Degeneration Treatments Trials (CATT) was a prospective, multicenter, randomized clinical trial that showed equivalent visual acuity (VA) improvement at both 1 and 2 years after the start of bevacizumab or ranibizumab treatment for neovascular age-related macular degeneration (AMD).1,2 Among patients following monthly or pro re nata (PRN) dosing regimens for 2 years, mean VA improvement was equivalent for both anti-vascular endothelial growth factor (VEGF) agents.2 Compared with PRN treatment, monthly dosing produced a small but significantly greater VA gain, a mean difference of 2.4 letters, at the cost of a nearly 2-fold greater number of intravitreal injections at 2 years.2
CATT ophthalmologists administered PRN treatment primarily based on fluid observed on optical coherence tomography (OCT) images. During year 1 of CATT follow-up, OCT images were acquired using a time domain OCT (TDOCT) system.3,4 OCT platforms based on spectral domain technology perform faster scans with improved image registration and higher axial resolution.5,6 Spectral domain OCT (SDOCT) platforms became available during CATT enrollment. In year 2 of the prospective study design, clinical center ophthalmologists were invited to acquire both SDOCT and TDOCT scans of study eyes to investigate how the new SDOCT modality, which was becoming commonplace in retinal care, would compare to TDOCT images for the management of patients enrolled into CATT.2
The Duke Reading Center (Duke University, Durham, NC) trained readers to evaluate CATT OCT scans of eyes with treated neovascular AMD and to classify hyporeflective areas, thought to represent fluid, based on location within the retina (intraretinal fluid, IRF), beneath the retina (subretinal fluid, SRF), or between the retinal pigment epithelium (RPE) and Bruch’s membrane (sub-RPE fluid). Readers were also trained to manually measure the thickness of the neurosensory retina, SRF if present, and RPE elevations caused by sub-RPE fluid, pigment epithelial detachment, and choroidal neovascularization (CNV).7
We and others have previously shown that rigorous reader certification and consistently applied qualitative and quantitative grading protocols produce acceptable reproducibility of TDOCT scan assessments for interventional AMD trials, including CATT.7–9 The purpose of this study was to determine whether fluid was detected equally and whether thickness measurements were equivalent, when assessed on TDOCT and SDOCT, in eyes treated for neovascular AMD. This report presents results from the largest study to date comparing qualitative and quantitative fluid assessments on images obtained with both OCT modalities at the same time point.
METHODS
Participants
All subjects were enrolled in a prospective, multicenter trial that randomized eyes to ranibizumab or bevacizumab intravitreal injections for the treatment of neovascular AMD (CATT, ClinicalTrials.org identifier no. NCT00593450). The design and methods of CATT have been published elsewhere.1,2 Trial protocols required written informed consent from each subject, following the tenets of the Declaration of Helsinki, and received approval from the institutional review boards associated with the 43 participating clinical centers. The Reading Center protocol was approved by the Duke Health System Institutional Review Board. All personal identifiers, medical information, and ophthalmic images were managed according to the guidelines of the Health Insurance Portability and Accountability Act.
Optical Coherence Tomography Imaging
We have previously described the procedures used to certify technicians and readers to acquire and evaluate OCT images.7 All clinical centers were required to use Stratus OCT (Stratus software version 6.0 or higher; Carl Zeiss Meditec, Dublin, CA) macular thickness map and fast macular thickness map protocols to capture radial scan patterns that consisted of 6 radial lines centered on the fovea and evenly spaced 30 degrees apart. The macular thickness map comprised 512 A-scans per 6-mm radial line, and the fast macular thickness map comprised 128 A-scans per 6-mm radial line. Stratus had a superluminescent diode light source with a 25-nm bandwidth, centered at 840-nm wavelength, and an axial resolution of 10 µm.
In year 2 of CATT, clinical centers were invited to transition from TDOCT to SDOCT. During this transition, images were obtained on a TDOCT and a SDOCT system on the same study participant on 4 consecutive study visits when imaging was required. After this 4-visit period, sites obtained images on SDOCT alone. Before undergoing the transition to SDOCT, technicians were certified to perform SDOCT imaging on one of two platforms, the Cirrus HDOCT (Cirrus software version 5.2 or higher; Carl Zeiss Meditec, Dublin, CA) or the Spectralis OCT (Spectralis software version 5.3 or higher; Heidelberg Engineering, Carlsbad, CA), each with distinct scan patterns.
Images were acquired on Cirrus with 2 scan patterns centered on the fovea: a 6-mm × 6-mm macular volume cube with 128 horizontal line scans spaced 47 µm apart and 512 A-scans per line, and 5 consecutive high-resolution 6-mm horizontal line scans spaced 250 µm apart with 4096 A-scans per line. Images were acquired on Spectralis OCT with 2 scan patterns centered on the fovea: a 20-degree × 20-degree (5.7-mm × 5.7-mm) macular volume cube with 49 horizontal line scans with 118 µm between lines and 512 A-scans per line, and 7 horizontal high-resolution horizontal line scans with 240 µm between lines and 1536 A-scans per line. Cirrus and Spectralis had broadband superluminescent diode light sources centered at 840-nm and 870-nm wavelengths, respectively, achieving an axial resolution of 5 µm.
Optical Coherence Tomography Assessment
Two masked readers, randomly selected from a pool of CATT-certified readers at the Reading Center, graded each TDOCT scan. The paired SDOCT scan, obtained at the same visit as the TDOCT scan, was assigned to two other randomly-selected readers. A senior reader arbitrated all discrepant values between masked readers. The Director of Grading (CAT) and the Reading Center Director (GJJ) remained masked to subject identifiers and made final decisions on reader disagreements that remained controversial after arbitration.
The final arbitrated categorical assessments and thickness measurements were used for data analysis. When both readers recorded an equivalent grade, the value was accepted for data analysis without arbitration. When both readers obtained measurements of the same OCT feature with ≤25 µm difference between them, the average was accepted for data analysis without arbitration. Morphometric data were considered discrepant if vertical thickness measurements differed by >25 µm between readers. The Director of Grading and senior readers established values for measurement discrepancies after analysis of aggregated Stratus grading data from a prior interventional study of neovascular AMD.7
According to protocol, readers were required to evaluate every B-scan image from the entire TDOCT radial scan or the entire SDOCT raster scan, before determining presence or absence of fluid anywhere within the scan. Readers independently recorded whether IRF, SRF, and sub-RPE fluid was “present,” “absent”, or “unreadable”. If fluid was present, the reader also graded the following subcategories: (1) fluid in the central 1-mm × 1-mm subfield, and (2) fluid at the foveal center point. Each fluid type was graded as unreadable on an OCT scan when present or absent grades could not be given due to the reader’s qualitative determination that ≥25% of the total number of B-scan images within the OCT scan had insufficient image quality due to any of the following deficits: poor scan saturation with signal void or dark areas involving the inner or outer retinal boundaries; poor focus depth with inner or outer retinal tissue clipping; lateral clipping of scan lines due to incorrect scan length or motion artifact; or poor scan placement with absence of foveal center on radial scans.
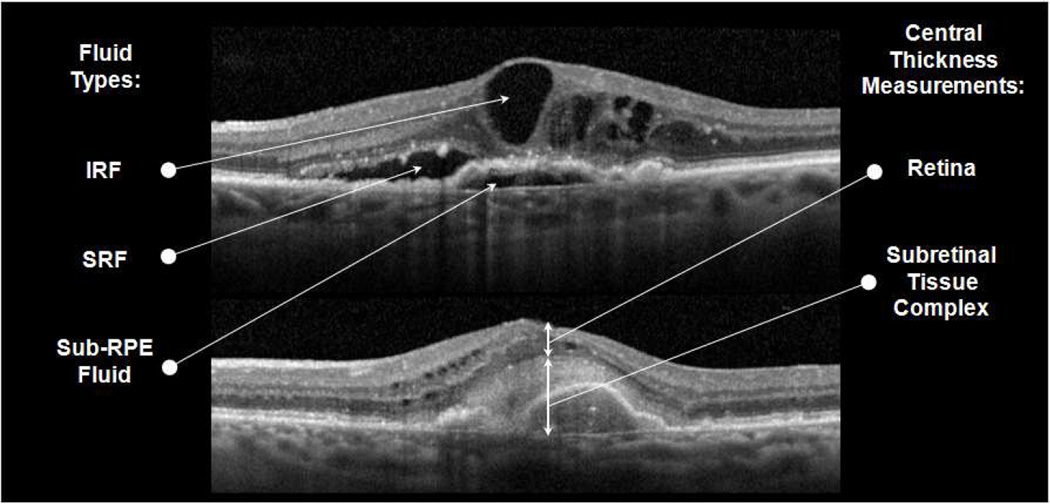
Readers manually measured thickness of 3 separate layers at the foveal center point: (1) retina, measured from inner retinal surface to outer border of the photoreceptor layer; (2) SRF, measured from the outer border of the photoreceptor layer to the inner RPE layer border; and (3) subretinal tissue complex, measured from the inner border of subretinal highly reflective material (comprising CNV, fibrosis, or hemorrhage) or fibrovascular pigment epithelial detachment, or from the inner RPE layer border when no subretinal material was present, to Bruch’s membrane (Figure 1).
Figure 1.
Spectral domain optical coherence tomography scans showing intraretinal fluid (IRF), subretinal fluid (SRF), and sub-retinal pigment epithelium (RPE) fluid (top) and central foveal measurements of retinal thickness and subretinal tissue complex thickness, which includes subretinal highly reflective material and fibrovascular RPE detachment (bottom).
In cases with severe foveal deformation due to CNV and macular edema, readers were trained to use other anatomic features to select the foveal center point, such as photoreceptor layer height, thinning of inner retinal layers, and vascular landmarks from en face fundus images. On TDOCT scans, readers viewed images at standardized dimensions and used a ruler to take measurements on 6 radial line scans. Thickness measurements were converted to micrometers and averaged across all radial line scans. On SDOCT scans, readers selected the horizontal line scan through the foveal center point and then used built-in software digital calipers to take measurements in micrometers.
Analysis of Qualitative and Quantitative Agreement
This study evaluated two tiers of categorical reader agreement on each variable graded on paired SDOCT and TDOCT scans. The first tier of agreement was the ability to determine fluid status among SDOCT and TDOCT readers. For each fluid type, study visits with “present” and “absent” scores were analyzed together as “readable” fluid status, and visits with “unreadable” scores due to unacceptable image quality were analyzed as “unreadable” fluid status. In the first tier of analysis, agreement on “readable” or “unreadable” fluid status was compared among all study visits.
For the second tier of agreement on each variable, we excluded from analysis all visits with “unreadable” scores on either SDOCT or TDOCT scans. Therefore, we only included visits in which both scans had a score of “present” or “absent” fluid. In the second tier of analysis, agreement on “present” or “absent” fluid was compared among eligible study visits. Agreement between the readings of paired scans was assessed with Cohen kappa coefficients (k) and 95% confidence intervals (CI). Agreement coefficients for categorical and continuous variables were interpreted according to Landis and Koch guidelines.10,11 The symmetry of disagreement between readings of the paired scans was evaluated with McNemar chi-squared tests, which determined whether the SDOCT scan was assigned a score for the presence of fluid with greater or lesser frequency than the TDOCT scan.
Manual thickness measurements from SDOCT and TDOCT were reported as mean difference between paired scans and 95% limits of agreement (LA), defined the mean ±1.96 standard deviations (SD) of the difference between paired scans. The distribution of absolute differences between SDOCT and TDOCT was evaluated, and the percentage of scan pairs with ≤25 µm difference was calculated. This 25 µm difference was consistent with the predetermined limit used for manual SDOCT measurement agreement between certified readers in the CATT grading protocol. Measurement differences between paired SDOCT and TDOCT scans were assessed with nonparametric signed rank tests. Bland-Altman plots were used to display the distribution of measurement differences within 95% LA. Agreement on manual measurements was assessed between SDOCT and TDOCT images with intraclass correlation coefficients (ICC) and 95% CI. Data analyses were performed in SAS statistical and graphic software (SAS 9.2 and JMP 10; SAS Institute, Cary, NC). Two-sided p-values <0.05 were considered statistically significant.
RESULTS
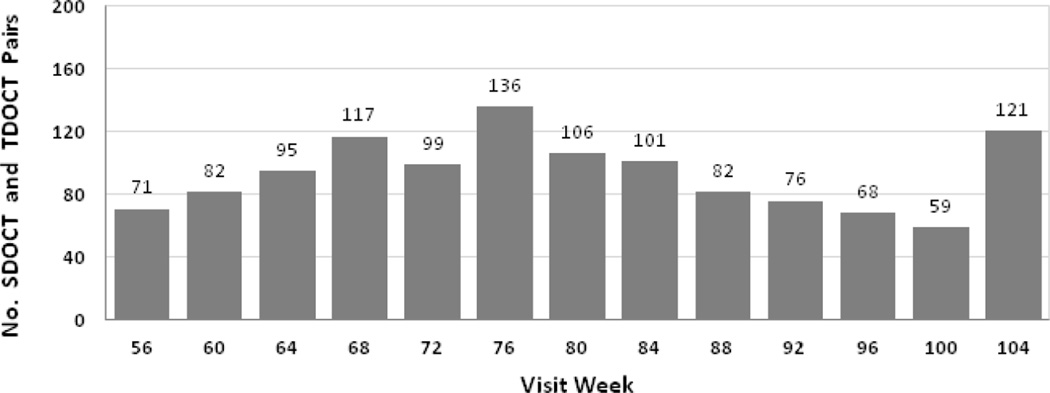
A total of 1213 pairs of SDOCT and TDOCT scans from the same eye and same visit were obtained in year 2 (weeks 56–104) of CATT. Figure 2 shows the number of paired scans obtained at each monthly study visit during year 2. Paired scans were obtained from 384 eyes (384 participants) treated at 35 of the 43 participating clinical centers.
Figure 2.
Distribution of spectral domain (SD) and time (TD) optical coherence tomography (OCT) scan pairs (n=1213 pairs) across all scheduled study visits in year 2 (weeks 56–104).
Readers found all primary fluid types to be readable with significantly greater frequency on SDOCT than TDOCT; however, the readability of both SDOCT and TDOCT scans was excellent for the interpretation of all fluid types (Table 1). The exact agreement rates (range 93–99%) were paradoxically too high to yield meaningful kappa coefficients.12
Table 1.
Readable (R) or unreadable (U) fluid status on paired spectral domain (SD) and time domain (TD) optical coherence tomography.
| Variable | Agree R no. pairs (%) |
Agree U no. pairs (%) |
SD - R TD – U no. pairs (%) |
SD - U TD – R no. pairs (%) |
Total no. pairs |
Exact Agreement % |
P Value* |
|---|---|---|---|---|---|---|---|
| Any Fluid | 1169 (96.4) | 3 (0.2) | 22 (1.8) | 19 (1.6) | 1213 | 96.6 | 0.63 |
| Intraretinal Fluid (cystoid spaces) | 1172 (96.6) | 2 (0.2) | 28 (2.3) | 11 (0.9) | 1213 | 96.8 | 0.006 |
| Intraretinal Fluid, center 1 mm | 469 (97.7) | 2 (0.4) | 6 (1.2) | 3 (0.6) | 480 | 98.1 | 0.32 |
| Intraretinal Fluid, foveal center | 317 (95.4) | 0 (0) | 15 (4.5) | 0 (0) | 332 | 95.4 | -- |
| Subretinal Fluid | 1162 (95.8) | 2 (0.2) | 42 (3.4) | 7 (0.6) | 1213 | 96.0 | < 0.001 |
| Subretinal Fluid, center 1 mm | 361 (97.3) | 1 (0.3) | 9 (2.4) | 0 (0) | 371 | 97.6 | 0.003 |
| Subretinal Fluid, foveal center | 263 (99.2) | 0 (0) | 1 (0.4) | 1 (0.4) | 265 | 99.2 | 1.0 |
| Sub-RPE Fluid | 1105 (91.1) | 18 (1.5) | 55 (4.5) | 35 (2.9) | 1213 | 92.6 | 0.03 |
| Sub-RPE Fluid, center 1 mm | 316 (97.8) | 3 (0.9) | 2 (0.6) | 2 (0.6) | 323 | 98.8 | 1.0 |
| Sub-RPE Fluid, foveal center | 221 (96.5) | 1 (0.4) | 4 (1.7) | 3 (1.3) | 229 | 96.9 | 0.70 |
RPE = retinal pigment epithelium.
P Value based on McNemar test for symmetry between paired proportions.
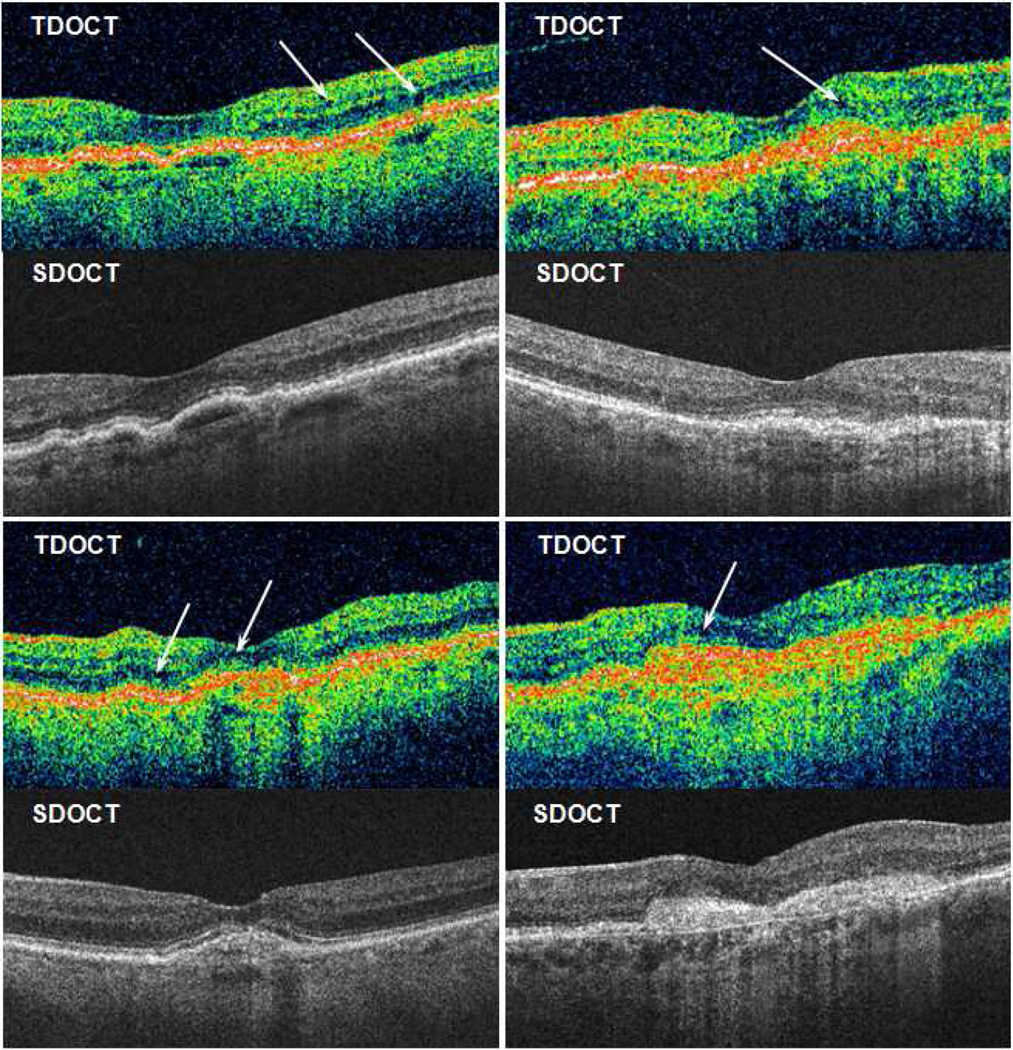
Agreement between TDOCT and SDOCT on the presence or absence of fluid varied among fluid types (Table 2). Overall, there was 82% agreement on whether there was any fluid present (k=0.46; CI, 0.40–0.52), and fluid was detected with 5% greater frequency on SDOCT (p<0.001). There was 87% agreement on SRF (k=0.72; CI, 0.68–0.76), and 80% agreement on sub-RPE fluid (k=0.58; CI, 0.53–0.62), which were detected with 7% and 11% greater frequency on SDOCT, respectively (both p<0.001). In contrast, there was 74% agreement on IRF (k=0.47; CI, 0.42–0.52), which was detected with 6% greater frequency on TDOCT (p<0.001). When comparing Cirrus and Spectralis SDOCT systems each with TDOCT (Table 4 online supplement), agreement on presence of any fluid was similar with Cirrus (80%; k=0.41; CI, 0.34–0.49) and Spectralis (77%; k=0.42; CI, 0.34–0.50). Figure 3 shows the effect of image saturation and axial resolution on IRF detection in paired TDOCT and SDOCT scans.
Table 2.
Agreement on presence of fluid on paired spectral domain (SD) and time domain (TD) optical coherence tomography.
| Variable | Agree present no. pairs (%) |
Agree absent no. pairs (%) |
SD present TD absent no. pairs (%) |
SD absent TD present no. pairs (%) |
Total no. eyes |
Exact Agreement % |
P Value* | Kappa | 95% CI |
|---|---|---|---|---|---|---|---|---|---|
| Any Fluid | 811 (69.4) | 144 (12.3) | 135 (11.5) | 79 (6.8) | 1169 | 81.7 | < 0.001 | 0.46 | 0.40 – 0.52 |
| Intraretinal Fluid (cystoid spaces) | 480 (41.0) | 381 (32.5) | 119 (10.2) | 192 (16.4) | 1172 | 73.5 | < 0.001 | 0.47 | 0.42 – 0.52 |
| Intraretinal Fluid, center 1 mm | 332 (70.8) | 40 (8.5) | 29 (36.7) | 68 (14.5) | 469 | 79.3 | < 0.001 | 0.33 | 0.23 – 0.43 |
| Intraretinal Fluid, foveal center | 49 (15.5) | 177 (55.8) | 11 (3.5) | 80 (25.5) | 317 | 71.3 | < 0.001 | 0.35 | 0.25 – 0.45 |
| Subretinal Fluid | 371 (31.9) | 637 (54.8) | 118 (10.2) | 36 (3.1) | 1162 | 86.7 | < 0.001 | 0.72 | 0.68 – 0.76 |
| Subretinal Fluid, center 1 mm | 265 (73.4) | 55 (15.2) | 25 (6.9) | 16 (4.4) | 361 | 88.6 | 0.16 | 0.66 | 0.56 – 0.75 |
| Subretinal Fluid, foveal center | 157 (59.7) | 61 (23.2) | 13 (4.9) | 32 (12.2) | 263 | 82.9 | 0.005 | 0.61 | 0.51 – 0.71 |
| Sub-RPE Fluid | 324 (29.3) | 555 (50.2) | 174 (15.7) | 52 (4.7) | 1105 | 79.5 | < 0.001 | 0.58 | 0.53 – 0.62 |
| Sub-RPE Fluid, center 1 mm | 229 (72.5) | 29 (9.2) | 32 (10.1) | 26 (8.2) | 316 | 81.6 | 0.43 | 0.39 | 0.26 – 0.52 |
| Sub-RPE Fluid, foveal center | 128 (57.9) | 39 (17.6) | 12 (5.4) | 42 (19.0) | 221 | 75.6 | < 0.001 | 0.43 | 0.31 – 0.55 |
CI = confidence interval, RPE = retinal pigment epithelium.
P Value based on McNemar test for symmetry between paired proportions.
Figure 3.
Four cases with time domain (TD) and spectral domain (SD) optical coherence tomography (OCT) performed at the same study visit. Arrows show subtle dark areas on TDOCT interpreted by readers as cystoid spaces with intraretinal fluid. Readers reported no intraretinal fluid on corresponding SDOCT scans.
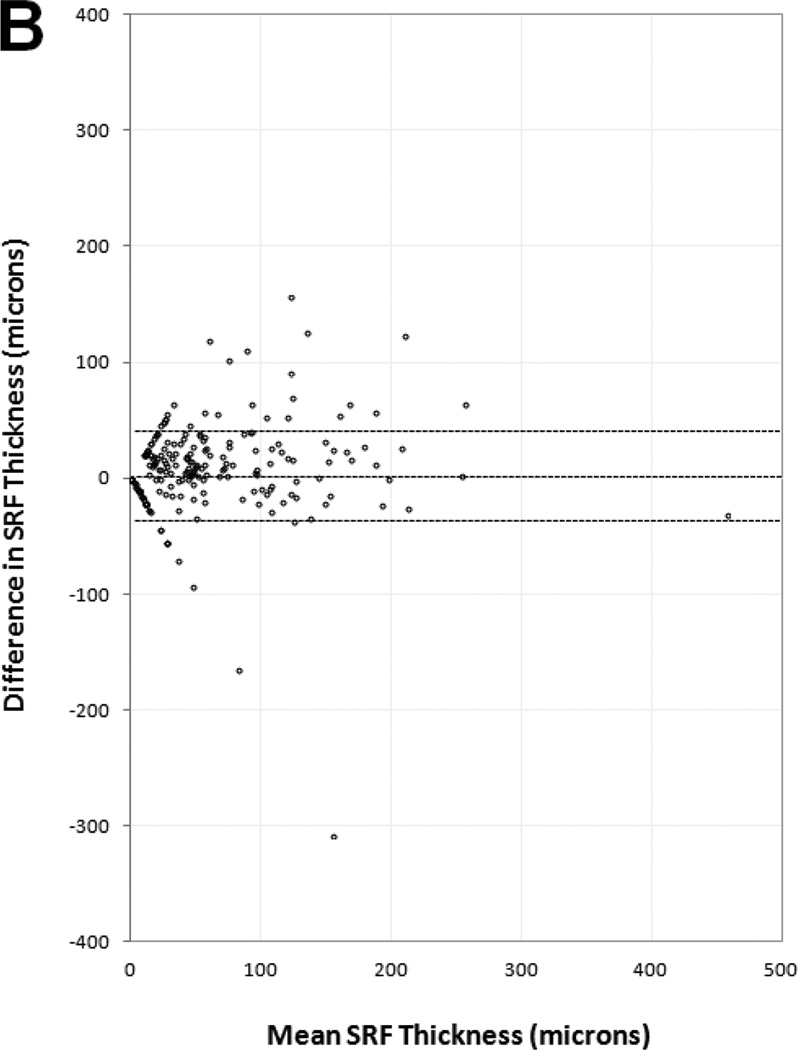
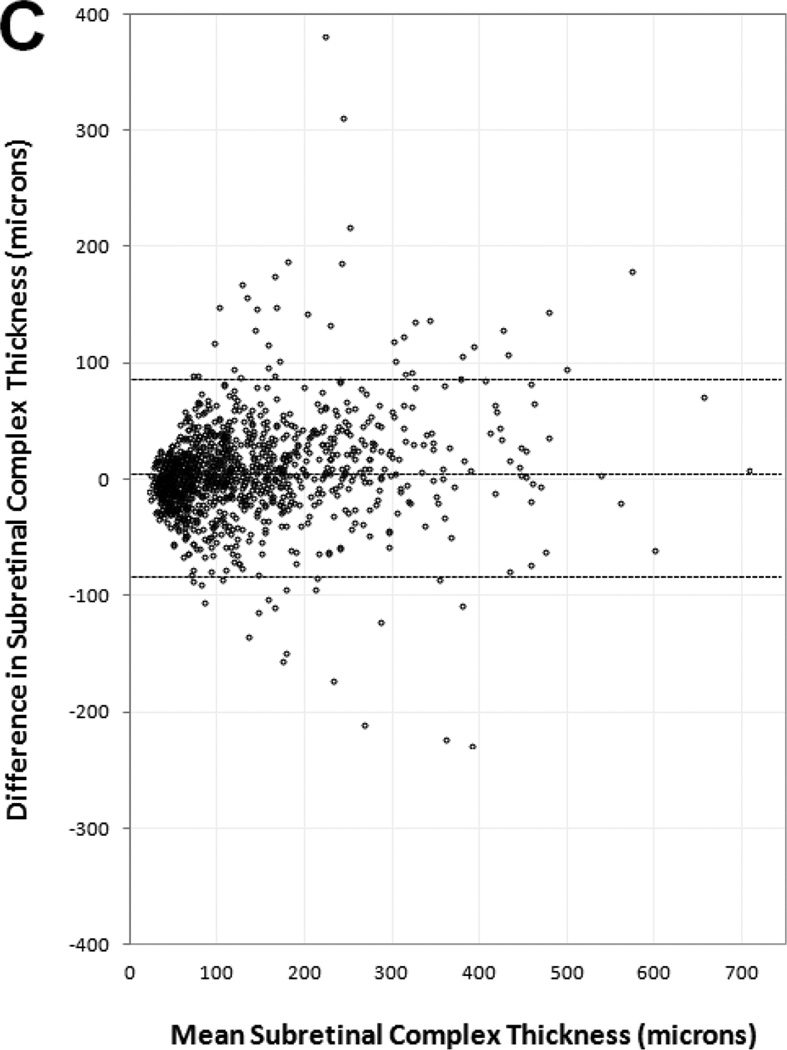
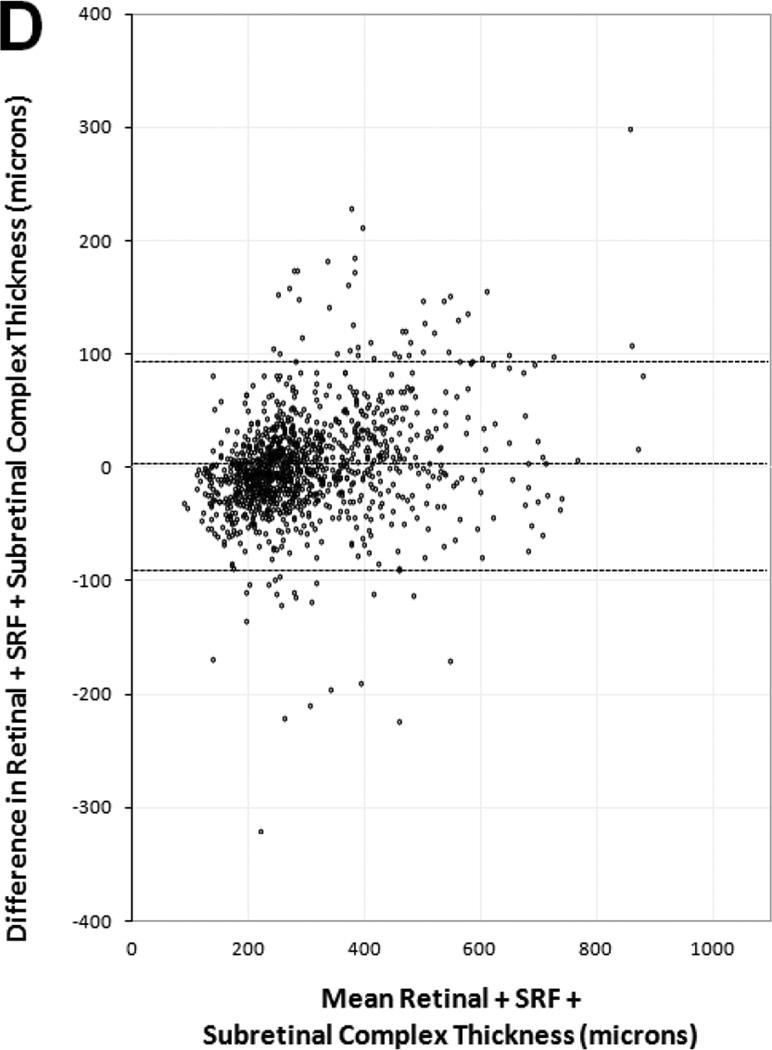
Manual thickness measurements performed by certified readers on paired SDOCT and TDOCT scans resulted in small mean differences that were statistically significant (p<0.001), but clinically similar, for each OCT layer (Table 3). The mean differences and 95% LA (presented as ±1.96 SD) showed retinal thickness was 5 ±67 µm greater on TDOCT than SDOCT, while SRF thickness was 1.5 ±35 µm greater on SDOCT, subretinal tissue complex thickness was 5 ±86 µm greater on SDOCT, and total central foveal thickness was 2 ±94 µm greater on SDOCT. Analysis for the distribution of absolute measurement differences between SDOCT and TDOCT found that 71% of paired scans had retinal thickness difference ≤25 µm, 94% of paired scans had SRF thickness difference ≤25 µm, and 61% of paired scans had subretinal tissue complex thickness difference ≤25 µm (Table 5 online supplement).
Table 3.
Paired differences and intraclass correlations between spectral domain and time domain optical coherence tomography thickness measurements (µm) at the foveal center point.
| Unpaired Data | Paired Data | ||||||
|---|---|---|---|---|---|---|---|
| Thickness Variable | Statistic | Spectral domain |
Time domain |
Difference | P Value* | ICC | 95% CI |
| Retina | No. pairs | 1203 | 1205 | 1198 | |||
| Mean (SD) | 153.5 (65.6) | 158.1 (58.3) | −4.8 (33.4) | ||||
| Min, Median, Max | 0, 150, 508 | 0, 154, 486 | −315, −4.5, 192 | < 0.001 | 0.84 | 0.83 – 0.86 | |
| SRF | No. pairs | 1205 | 1205 | 1200 | |||
| Mean (SD) | 11.3 (36.8) | 10.0 (34.7) | 1.5 (17.6) | ||||
| Min, Median, Max | 0, 0, 442 | 0, 0, 473 | −308, 0, 156 | < 0.001 | 0.88 | 0.86 – 0.89 | |
| Subretinal Tissue Complex | No. pairs | 1203 | 1204 | 1197 | |||
| Mean (SD) | 131.7 (104.9) | 126.1 (96.9) | 5.4 (42.9) | ||||
| Min, Median, Max | 9, 101, 712 | 22, 93.5, 704 | −229, 3, 380 | < 0.001 | 0.91 | 0.89 – 0.92 | |
| Retina + SRF + Subretinal Tissue Complex | No. pairs | 1202 | 1204 | 1197 | |||
| Mean (SD) | 296.4 (128.9) | 294.3 (116.5) | 2.1 (46.9) | ||||
| Min, Median, Max | 52, 263, 1003 | 93.5, 262, 858 | −320, −2, 299 | 0.97 | 0.93 | 0.92 – 0.94 | |
ICC = intraclass correlation coefficient, CI = confidence interval, SD = standard deviation, SRF = subretinal fluid.
P Value based on Wilcoxon signed rank test of paired median difference equal to zero.
Paired scans had comparable agreement (Table 3) on retinal thickness (ICC=0.84; CI, 0.83–0.86), SRF thickness (ICC=0.88; CI, 0.86–0.89), sub-RPE tissue thickness (ICC=0.91; CI, 0.89–0.92), and total central foveal thickness (ICC=0.93; CI, 0.92–0.94). When comparing Cirrus and Spectralis SDOCT systems each with TDOCT (Table 6 and Table 7 online supplements), agreement on total central foveal thickness was similar with Cirrus (mean difference and 95% LA of 2 ±88 µm; ICC=0.92; CI, 0.91–0.93) and Spectralis (mean difference and 95% LA of 8 ±95 µm; ICC=0.94; CI, 0.92–0.95).
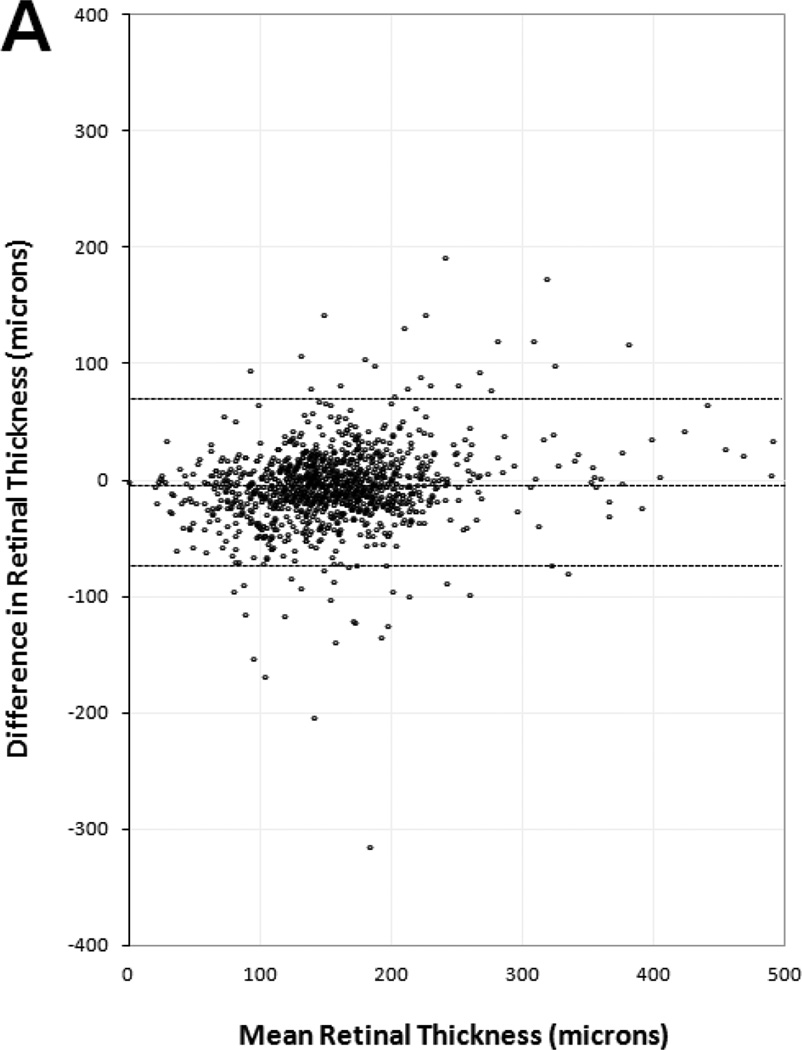
Figure 4 shows Bland-Altman plots for central foveal thickness measurements of each OCT layer. All plots showed clinically similar distribution of positive and negative differences within the 95% LA between paired SDOCT and TDOCT scans. No plots had positive or negative outliers on the ordinate (thickness difference) skewed to either high or low extremes of the abscissa (mean thickness). The plots showed that readers had moderate agreement for measuring very large and small thickness magnitudes on SDOCT and TDOCT images. Significant outliers on Bland-Altman plots occurred in eyes with severe foveal deformation and difficult foveal center point placement. Unequal placement of the foveal center point on such paired scans resulted in large thickness differences in these outliers (Figure 5).
Figure 4.
Bland-Altman plots of spectral domain and time domain optical coherence tomography reader agreement for central foveal thickness measurements of (A) retina, (B) subretinal fluid, (C) subretinal tissue complex, and (D) total thickness of the retina, subretinal fluid, and subretinal tissue complex. Difference in thickness represents spectral domain optical coherence tomography (OCT) minus time domain OCT measurements on paired scans. Dotted lines represent mean difference and 95% limits of agreement.
Figure 5.
Severe foveal deformation caused central foveal thickness measurement differences outside the 95% limits of agreement. In this case, a small difference of foveal center point placement (arrow) by readers using (A) time domain and (B) spectral domain optical coherence tomography produced a difference of 224 µm in total thickness (bracket) from internal limiting membrane to Bruch’s membrane (dotted line).
DISCUSSION
During year 2 of CATT, clinical centers were invited to submit both SDOCT and TDOCT scans of eyes treated for neovascular AMD to the Reading Center, and certified readers evaluated all scans. This report showed that readers were able to grade fluid status on a high percentage (93–99%) of scans from each OCT modality. For the presence or absence of fluid in specific anatomic layers, there was moderate-to-good reader agreement between paired SDOCT and TDOCT scans with adequate image quality. IRF was detected more frequently with TDOCT, whereas all other fluid types were detected more frequently with SDOCT. Our findings were comparable for manual central foveal thickness measurements on paired SDOCT and TDOCT scans. This report provides a basis for interpretation of the TDOCT-based fluid assessments in CATT, and provides data that will be useful to compare the results of CATT with future SDOCT-based trials for neovascular AMD.
We found that careful evaluation of SDOCT scans increased the detection of any fluid in neovascular AMD, and specifically subretinal and sub-RPE fluid, compared with TDOCT. This was after we found that more SDOCT scans were of sufficient signal quality to be graded for presence or absence of subretinal and sub-RPE fluid, compared with TDOCT scans captured at the same visit. Our findings were consistent with Sayanagi et al., who found the greatest difference between SDOCT platforms and a TDOCT system used to monitor neovascular AMD treatment was the ability to detect persistent sub-RPE fluid.13 SDOCT systems have improved superluminescent diode light sources with broader spectral bandwidth than TDOCT, allowing greater axial resolution to discriminate fluid from tissue within the subretinal and sub-RPE spaces and within the subretinal tissue complex created by CNV. Broadband signals are detected by spectrometer and undergo Fourier transformation to identify signal depth, enabling faster scan acquisition and greater scan density. These modifications can reduce confounding motion artifact, improve signal-to-noise ratio, and allow more comprehensive examination for fluid across the entire macula, compared with TDOCT.14,15 Image quality is most improved in deeper layers beneath the retina and through more highly dispersive media, and this difference may have an important effect in PRN treatment regimens. Although IRF is the most common fluid type seen in neovascular AMD, there is evidence to suggest that sub-RPE fluid, when present, is more difficult to eliminate.16,17 During year 1 of CATT, the percent decline in eyes with sub-RPE fluid (18%) after first dose of anti-VEGF treatment was lower than the decline in eyes with IRF (23%) after first dose, consistent with previous findings by Golbaz et al.16,17 Therefore, PRN treatment based on SDOCT fluid detection may require more frequent injections due to enhanced fluid detection in deeper tissue layers.
Although SRF and sub-RPE fluid were detected more frequently with SDOCT, IRF was detected more frequently with TDOCT. With the SDOCT raster scan patterns approved for this study, sampling errors may occur by omitting small parafoveal changes between line scans spaced 47 µm apart on Cirrus scans or 118 µm apart on Spectralis scans. This phenomenon has been shown with thin parafoveal vitreomacular bands that were detected on TDOCT radial scans, but were not sampled by SDOCT raster scans.18 However, IRF can also be a false positive finding on TDOCT, because of lower axial resolution and lower signal-to-noise ratio in dark retinal areas with OCT hyporeflectivity.14,15 Compared with newer SDOCT light sources, TDOCT signal quality may yield poor resolution of the nuclear retinal layers, creating small artifactual dark areas that may be interpreted as IRF cystoid spaces by clinicians or trained readers (Figure 3). The superluminescent diode bandwidth available in TDOCT systems restricts the ability to resolve signal differences less than 10 µm apart in axial height, whereas broader bandwidths used in SDOCT systems enable signal differentiation with pixels of 5 µm or less.19 Expanding the spectral bandwidth requires powerful dispersion compensation to correct for dispersion mismatch and loss of sensitivity caused by variations in eye length among patients.20 SDOCT systems are better-suited to automated numerical dispersion correction than TDOCT, because the entire spectral fringe signal is directly available during signal processing to generate an image.20
The clinical significance of increased SRF and sub-RPE fluid detection and decreased IRF detection with SDOCT remains unclear. Previous CATT reports have shown that SRF and sub-RPE fluid were not significant VA predictors after 1 year.17,21 Multivariate analyses showed that greater total foveal thickness and RPE elevation on OCT at baseline were independently associated with worse visual outcomes; however, fluid present at baseline did not predict VA gain of ≥3 lines.21 After 1 year of follow-up, SRF and sub-RPE fluid had little impact on VA.17 The only fluid type with a significant negative impact on VA over the course of 1 year was IRF.17 Further investigation is warranted to determine the clinical effects of observation versus anti-VEGF treatment when SRF and sub-RPE fluid are missed on TDOCT, and observation versus treatment for trace IRF perceived with TDOCT but not SDOCT.
Studies of automated retinal thickness measurements in normal and diseased eyes have consistently shown poor agreement on central foveal thickness and mean retinal thickness in the central 1-mm subfield.13,19,22,23 We and others have reported that differences in automated central foveal thickness were clinically and statistically significant among different OCT platforms, when compared to each other and to previous histopathology studies.19,24,25 In a previous report that used the same OCT platforms as those used in CATT, we concluded that automated measurements obtained by different OCT systems are not interchangeable when used to monitor retinal disease in daily practice and clinical trials.19
Reproducibility between OCT platforms improves with manual measurements or with manual correction of automated segmentation lines to match standardized anatomic reference points. Eriksson et al. showed significant disparities in the automated average retinal thickness of the central 1-mm subfield in paired SDOCT and TDOCT scans.26 However, when SDOCT scans were manually corrected for the retinal boundaries and foveal center point, variability and reproducibility improved significantly.26 The current study demonstrated moderate or good agreement on manual thickness measurements obtained by SDOCT and TDOCT; and the average total thickness difference between paired scans was within 2 µm (Table 3). In conclusion, trained readers performing manual correction of automated segmentation lines, or performing manual measurements themselves, achieve less variability and greater accuracy across numerous OCT platforms than automated algorithms without correction.
Good agreement on manual thickness measurements was limited by the ability of certified readers to consistently agree on the location of the foveal center point in cases with severe foveal deformation and disorganization of retinal layers secondary to CNV and macular edema. Readers were trained to use other anatomic landmarks to select the foveal center point, such as the narrowest point of thinning of inner retinal layers, the site of greatest (non-edematous) axial thickness of the photoreceptor layer, and vascular landmarks from en face fundus images. In cases of steep foveal deformation without useful landmarks, placement of the foveal center point at close but unequal locations along the slope of elevation could produce significant differences between SDOCT and TDOCT reader measurements (Figure 5). This limitation resulted in the wide range of central foveal thickness differences. The most susceptible measurements were retinal thickness and subretinal tissue complex with a 95% agreement range of ±67 µm and ±86 µm, respectively. The limits of agreement on SRF thickness had a narrower range due to fewer cases with central SRF and smaller fluid height when central SRF was present. This study limitation may be surmounted in future AMD trials by obtaining the central 1-mm subfield volume. Volume measurement can be less sensitive to center foveal plotting differences than thickness measurement alone.27,28 To be practical, this approach would require software compatible across several SDOCT platforms to perform robust automated layer segmentation in these eyes with severe foveal deformation.
Clinical trials for AMD continue to incorporate the latest imaging modalities to determine patient eligibility, treatment decisions, and trial endpoints. The arrival of newer imaging technology will prompt investigators to review past trials and compare the results obtained with older instruments. CATT was one of the first AMD trials to incorporate TDOCT imaging, and SDOCT imaging subsequently, in all phases of its clinical trial design. In selected cases of neovascular AMD, SDOCT enabled certified readers to detect SRF and sub-RPE fluid due to CNV exudation with greater frequency than TDOCT, and enabled them to distinguish cystoid spaces of IRF from artifactual hyporeflective areas that would otherwise be scored as IRF on TDOCT. Over a prospective, multicenter study of 1213 study visits during year 2 of CATT, TDOCT enabled readers to grade fluid and obtain manual thickness measurements with statistically moderate-to-good concordance to SDOCT results. This study provides a frame of reference for researchers and clinicians to compare SDOCT-based studies of neovascular AMD to the existing full TDOCT-based dataset from CATT. We believe this study may also allow clinicians and patients to confidently incorporate the results of the CATT reports into their decision-making for the treatment of neovascular AMD.
Supplementary Material
Acknowledgments
None.
Financial Support: The Comparison of AMD Treatments Trials (CATT, ClinicalTrials.gov identifier NCT00593450) were supported by the National Institutes of Health U10 EY017823, U10 EY017825, U10 EY017826, and U10 EY017828.
The author(s) have made the following disclosure(s): Glenn J. Jaffe: Heidelberg Engineering (consultant). Cynthia A. Toth: Genentech (research), patents pending on optical coherence tomography image processing.
Footnotes
Publisher's Disclaimer: This is a PDF file of an unedited manuscript that has been accepted for publication. As a service to our customers we are providing this early version of the manuscript. The manuscript will undergo copyediting, typesetting, and review of the resulting proof before it is published in its final citable form. Please note that during the production process errors may be discovered which could affect the content, and all legal disclaimers that apply to the journal pertain.
DISCLOSURES
Financial Disclosure(s): The remaining authors have no proprietary or commercial interest in any materials discussed in this article.
Presentation: Presented in part at the annual meeting of the Association for Research in Vision and Ophthalmology, May 2013, Seattle, WA.
REFERENCES
- 1.CATT Research Group. Ranibizumab and bevacizumab for neovascular age-related macular degeneration. N Engl J Med. 2011;364:1897–1908. doi: 10.1056/NEJMoa1102673. [DOI] [PMC free article] [PubMed] [Google Scholar]
- 2.Comparison of Age-related Macular Degeneration Treatments Trials (CATT) Research Group. Martin DF, Maguire MG, Fine SL, et al. Ranibizumab and bevacizumab for treatment of neovascular age-related macular degeneration: two-year results. Ophthalmology. 2012;119:1388–1398. doi: 10.1016/j.ophtha.2012.03.053. [DOI] [PMC free article] [PubMed] [Google Scholar]
- 3.Hee MR, Baumal CR, Puliafito CA, et al. Optical coherence tomography of age-related macular degeneration and choroidal neovascularization. Ophthalmology. 1996;103:1260–1270. doi: 10.1016/s0161-6420(96)30512-5. [DOI] [PubMed] [Google Scholar]
- 4.Jaffe GJ, Caprioli J. Optical coherence tomography to detect and manage retinal disease and glaucoma. Am J Ophthalmol. 2004;137:156–169. doi: 10.1016/s0002-9394(03)00792-x. [DOI] [PubMed] [Google Scholar]
- 5.Chen TC, Cense B, Pierce MC, et al. Spectral domain optical coherence tomography: ultra-high speed, ultra-high resolution ophthalmic imaging. Arch Ophthalmol. 2005;123:1715–1720. doi: 10.1001/archopht.123.12.1715. [DOI] [PubMed] [Google Scholar]
- 6.Stopa M, Bower BA, Davies E, et al. Correlation of pathologic features in spectral domain optical coherence tomography with conventional retinal studies. Retina. 2008;28:298–308. doi: 10.1097/IAE.0b013e3181567798. [DOI] [PubMed] [Google Scholar]
- 7.Decroos FC, Toth CA, Stinnett SS, et al. CATT Research Group. Optical coherence tomography grading reproducibility during the Comparison of Age-related Macular Degeneration Treatments Trials. Ophthalmology. 2012;119:2549–2557. doi: 10.1016/j.ophtha.2012.06.040. [DOI] [PMC free article] [PubMed] [Google Scholar]
- 8.Zhang N, Hoffmeyer GC, Young ES, et al. Optical coherence tomography reader agreement in neovascular age-related macular degeneration. Am J Ophthalmol. 2007;144:37–44. doi: 10.1016/j.ajo.2007.03.056. [DOI] [PubMed] [Google Scholar]
- 9.Ritter M, Elledge J, Simader C, et al. Evaluation of optical coherence tomography findings in age-related macular degeneration: a reproducibility study of two independent reading centres. Br J Ophthalmol. 2011;95:381–385. doi: 10.1136/bjo.2009.175976. [DOI] [PMC free article] [PubMed] [Google Scholar]
- 10.Koch GG, Landis JR, Freeman JL, et al. A general methodology for the analysis of experiments with repeated measurement of categorical data. Biometrics. 1977;33:133–158. [PubMed] [Google Scholar]
- 11.Landis JR, Koch GG. The measurement of observer agreement for categorical data. Biometrics. 1977;33:159–174. [PubMed] [Google Scholar]
- 12.Feinstein AR, Cicchetti DV. High agreement but low kappa: I. The problems of two paradoxes. J Clin Epidemiol. 1990;43:543–549. doi: 10.1016/0895-4356(90)90158-l. [DOI] [PubMed] [Google Scholar]
- 13.Sayanagi K, Sharma S, Yamamoto T, Kaiser PK. Comparison of spectral-domain versus time-domain optical coherence tomography in management of age-related macular degeneration with ranibizumab. Ophthalmology. 2009;116:947–955. doi: 10.1016/j.ophtha.2008.11.002. [DOI] [PubMed] [Google Scholar]
- 14.de Boer JF, Cense B, Park BH, et al. Improved signal-to-noise ratio in spectral-domain compared with time-domain optical coherence tomography. Opt Lett. 2003;28:2067–2069. doi: 10.1364/ol.28.002067. [DOI] [PubMed] [Google Scholar]
- 15.Choma M, Sarunic M, Yang C, Izatt J. Sensitivity advantage of swept source and Fourier domain optical coherence tomography. [Accessed April 5, 2014];Opt Express [serial online] 2003 11:2183–2189. doi: 10.1364/oe.11.002183. Available at: http://www.opticsinfobase.org/oe/abstract.cfm?uri=oe-11-18-2183. [DOI] [PubMed] [Google Scholar]
- 16.Golbaz I, Ahlers C, Stock G, et al. Quantification of the therapeutic response of intraretinal, subretinal, and subpigment epithelial compartments in exudative AMD during anti-VEGF therapy. Invest Ophthalmol Vis Sci. 2011;52:1599–1605. doi: 10.1167/iovs.09-5018. [DOI] [PubMed] [Google Scholar]
- 17.Jaffe GJ, Martin DF, Toth CA, et al. Comparison of Age-related Macular Degeneration Treatments Trials Research Group. Macular morphology and visual acuity in the Comparison of Age-related Macular Degeneration Treatments Trials. Ophthalmology. 2013;120:1860–1870. doi: 10.1016/j.ophtha.2013.01.073. [DOI] [PMC free article] [PubMed] [Google Scholar]
- 18.Folgar FA, Toth CA, DeCroos FC, et al. Assessment of retinal morphology with spectral and time domain OCT in the phase III trials of enzymatic vitreolysis. Invest Ophthalmol Vis Sci. 2012;53:7395–7401. doi: 10.1167/iovs.12-10379. [DOI] [PubMed] [Google Scholar]
- 19.Han IC, Jaffe GJ. Comparison of spectral- and time-domain optical coherence tomography for retinal thickness measurements in healthy and diseased eyes. Am J Ophthalmol. 2009;147:847–858. doi: 10.1016/j.ajo.2008.11.019. [DOI] [PubMed] [Google Scholar]
- 20.Wojtkowski M, Srinivasan V, Ko T, et al. Ultrahigh-resolution, high-speed, Fourier domain optical coherence tomography and methods for dispersion compensation. [Accessed April 5, 2014];Opt Express [serial online] 2004 12:2404–2422. doi: 10.1364/opex.12.002404. Available at: http://www.opticsinfobase.org/oe/abstract.cfm?uri=oe-12-11-2404. [DOI] [PubMed] [Google Scholar]
- 21.Ying GS, Huang J, Maguire MG, et al. Comparison of Age-related Macular Degeneration Treatments Trials Research Group. Baseline predictors for one-year visual outcomes with ranibizumab or bevacizumab for neovascular age-related macular degeneration. Ophthalmology. 2013;120:122–129. doi: 10.1016/j.ophtha.2012.07.042. [DOI] [PMC free article] [PubMed] [Google Scholar]
- 22.Leung CK, Cheung CY, Weinreb RN, et al. Comparison of macular thickness measurements between time domain and spectral domain optical coherence tomography. Invest Ophthalmol Vis Sci. 2008;49:4893–4897. doi: 10.1167/iovs.07-1326. [DOI] [PubMed] [Google Scholar]
- 23.Giani A, Cigada M, Choudhry N, et al. Reproducibility of retinal thickness measurements on normal and pathologic eyes by different optical coherence tomography instruments. Am J Ophthalmol. 2010;150:815–824. doi: 10.1016/j.ajo.2010.06.025. [DOI] [PubMed] [Google Scholar]
- 24.Shahidi M, Wang Z, Zelkha R. Quantitative thickness measurement of retinal layers imaged by optical coherence tomography. Am J Ophthalmol. 2005;139:1056–1061. doi: 10.1016/j.ajo.2005.01.012. [DOI] [PubMed] [Google Scholar]
- 25.Yuodelis C, Hendrickson A. A qualitative and quantitative analysis of the human fovea during development. Vision Res. 1986;26:847–855. doi: 10.1016/0042-6989(86)90143-4. [DOI] [PubMed] [Google Scholar]
- 26.Eriksson U, Alm A, Larsson E. Is quantitative spectral- domain superior to time-domain optical coherence tomography (OCT) in eyes with age-related macular degeneration? Acta Ophthalmol. 2012;90:620–627. doi: 10.1111/j.1755-3768.2011.02112.x. [DOI] [PubMed] [Google Scholar]
- 27.Browning DJ. Interobserver variability in optical coherence tomography for macular edema. Am J Ophthalmol. 2004;137:1116–1117. doi: 10.1016/j.ajo.2003.12.013. [DOI] [PubMed] [Google Scholar]
- 28.Krebs I, Hagen S, Brannath W, et al. Repeatability and reproducibility of retinal thickness measurements by optical coherence tomography in age-related macular degeneration. Ophthalmology. 2010;117:1577–1584. doi: 10.1016/j.ophtha.2010.04.032. [DOI] [PubMed] [Google Scholar]
Associated Data
This section collects any data citations, data availability statements, or supplementary materials included in this article.


