

Abstract
Purpose
The purpose of this study was to compare the precision of mammographic breast density measurement using radiologist reader assessment, histogram threshold segmentation, fuzzy C-mean segmentation and spectral material decomposition.
Materials and Methods
Spectral mammography images from a total of 92 consecutive asymptomatic women (50–69 years old) who presented for annual screening mammography were retrospectively analyzed for this study. Breast density was estimated using 10 radiologist reader assessment, standard histogram thresholding, fuzzy C-mean algorithm and spectral material decomposition. The breast density correlation between left and right breasts was used to assess the precision of these techniques to measure breast composition relative to dual-energy material decomposition.
Results
In comparison to the other techniques, the results of breast density measurements using dual-energy material decomposition showed the highest correlation. The relative standard error of estimate for breast density measurements from left and right breasts using radiologist reader assessment, standard histogram thresholding, fuzzy C-mean algorithm and dual-energy material decomposition was calculated to be 1.95, 2.87, 2.07 and 1.00, respectively.
Conclusion
The results indicate that the precision of dual-energy material decomposition was approximately factor of two higher than the other techniques with regard to better correlation of breast density measurements from right and left breasts.
Keywords: mammography, breast density, dual energy, breast imaging, cancer
Introduction
Mammographic breast density is an important risk factor in the development of breast cancer (1–7). Previous reports have shown that women with highest mammographic density (75%–100%) have four to five-fold increased risk of developing breast cancer compared with the lowest density (0%–25%) (8–10). Furthermore, it has been shown that the sensitivity of screening mammography is lower among women with dense breasts (9, 11–18). Therefore, improved methods of measuring breast density could potentially be helpful in more accurately quantifying breast cancer risk and monitor changes in risk over time. This is especially important since breast density can change with external factors such as hormonal agents and diet. The importance of quantitative breast density assessment has been highlighted by a previous report indicating that for every 1% increase of mammographic breast density, there is a 2% increase of the relative risk for breast cancer (19).
Qualitative classification of mammographic breast density is the current clinical standard. However, subjective classification of breast density is limited by its considerable intra- and inter-reader variability (20–22). Therefore, there have been previous reports of more automated methods using area-based and volume-based techniques to measure breast density (8, 23). The area-based techniques essentially use a histogram of image gray levels for segmentation of fibroglandular and adipose tissues (8, 23). These techniques are limited by the segmentation process and the fact that the 3D nature of the breast is not taken into account. The current volume-based techniques use paddle position and a shape model for estimation of breast thickness, which is used in breast thickness calculation (24, 25). However, these techniques are limited by the assumptions required in the breast shape model and the errors associated with the paddle position measurement, which can lead to a two- to three-fold increase in measurement error in volumetric breast density (26).
Spectral material decomposition can exploit differences between the effective atomic numbers of fibroglandular and adipose tissues to provide separate quantitative thickness measurements for each tissue. It does not require any assumption for breast density measurement since glandular and adipose thickness measurements are based on two separate physical measurements using low and high energy image data. Previous studies have shown that accurate breast density measurements can be made using dual energy mammography (27–29). However, slightly higher radiation dose is required for dual energy mammography (27–29) and misregistration artifacts can result if the patient moves between acquisition of low and high energy images.
Recent introduction of spectral mammography, which uses energy-resolved photon counting detectors, eliminates the need for two exposures by providing the energy information using a single exposure (30–33). This addresses the previous limitations associated with radiation dose and misregistration artifacts associated with dual energy mammography. A previously reported phantom study using spectral mammography has shown that accurate volumetric breast density measurements can be made using just a single exposure (34). Previous studies have also validated the accuracy of the dual energy mammography technique for breast density measurement using chemical analysis in postmortem breasts as the reference gold standard (29, 35). The postmortem breast studies have also shown excellent correlation of breast density between right and left breasts (29, 35). The purpose of this retrospective study was to compare the precision of breast density measurement using reader assessment, histogram thresholding segmentation, fuzzy C-mean segmentation and dual-energy material decomposition. The breast density correlation between left and right breasts was used to assess the precision of these techniques to measure breast composition relative to dual-energy material decomposition.
Materials and Methods
Image acquisition
Spectral mammography images from a total of 92 consecutive asymptomatic women (50–69 years old) who presented for annual screening mammography were retrospectively analyzed for this study where the requirement of informed consent was waived under institutional review board approval. One of the patients was excluded from this analysis because of an obvious breast cancer that changed the mammographic density in one of the breasts. The remaining 92 women were included in this study. The digital mammograms were previously acquired with a spectral mammography system (MicroDose L30, Philips Healthcare, Stockholm, Sweden). For the 92 women, bilateral, craniocaudal (CC) and mediolateral-oblique (MLO) views were analyzed. The processed (for presentation) images were used for radiologist reader assessment, histogram threshold segmentation and fuzzy C-mean segmentation while the raw (for processing) images were used for performing dual-energy material decomposition. A total of 368 digital images were thus available for density analysis in this study. The breast density correlation between left and right breasts was used to assess the precision of these techniques to measure breast composition relative to dual-energy material decomposition.
Breast density measurement
Radiologist reader assessment
All the images from the 92 patients were read (August 2012 to September 2012) by 10 board certified radiologists with a range of 1–25 years of mammography experience. The CC and MLO views of each breast were read together but the right and left breasts for all the patients were read in a random order blinded from the reviewers. The radiologists were asked to rank the breasts into 4 density categories of fatty (1), scattered densities (2), heterogeneously dense (3), and extremely dense (4). The averaged categorical ranking for the ten readers was also converted into percentage values by using linear interpolations, which assumed rankings of 1–4 as 12%, 37%, 62% and 87%, respectively. This allows a more direct comparison of reader assessment with other breast density measurement techniques.
Histogram threshold segmentation
A previously reported histogram threshold segmentation method (Cumulus, Version 4.2, Sunnybrook Health Sciences Center, Toronto, Canada) was used for segmentation of glandular and adipose tissues (36). In this method each digital mammogram was adjusted by the reader to a window and level to optimize the display. This was followed by application of a manually determined intensity threshold to identify and subsequently exclude background air and to identify the breast edge. The pectoral muscle edge was then manually delineated and excluded from subsequent analyses. The remainder of the image was designated as the breast tissue region of interest and the total breast area was computed automatically by the software. After identification of the total breast tissue area, a second gray-level intensity threshold was interactively chosen by the reader to segment the fibroglandular tissue from the remaining adipose tissue. The dense tissue area was then computed automatically by the software. The breast density was finally calculated by taking the ratio of the dense tissue area to the total breast area. Before, the reading study, the order of the images was processed with an automated script written in Matlab (The MathWorks, Inc. Natick, MA), so that the CC and MLO views of the same breast were grouped together but the right and left breasts for all the patients were presented to the reader in a random order. Two medical physicists performed the reading independently without the knowledge of the image order, after a training session. The CC and MLO views of each breast were then averaged together.
Fuzzy C-mean segmentation
The Fuzzy C-mean algorithm classifies pixels with similar gray values into distinct clusters allowing for the separation of different tissues by their attenuation properties (37). The algorithm involves a series of steps; (1) breast region and pectoral muscle segmentation; (2) gray level normalization within the segment; (3) adaptive histogram-based determination of the optimal number of clusters for segmentation; (4) glandular tissue classification. In this application, a total of 6 clusters were used for segmentation of the breast from the pectoral muscle. After the automatic clustering process, a trained medical physicist assigned the clusters into a binary classification of glandular and adipose tissues for automatic calculation of breast density. The order of the images was processed as described above for presenting the right and left breasts in a random order. The CC and MLO views of each breast were averaged together after the measurements.
Dual-energy material decomposition
The physical differences in the mass attenuation coefficients of glandular and adipose tissues as a function of beam energy is used to perform dual-energy material decomposition where the thickness of each tissue is quantified on a pixel by pixel basis. This system uses a multi-slit geometry, which rejects majority of the scattered radiation (42). The energy-resolved photon counting detector of the spectral mammography system enables the possibility to separate the high energy photons from all the other photons with an energy threshold using a single exposure. The processed total image was used as a standard digital mammogram while the raw total and high energy images were used for dual-energy material decomposition measurements of glandular and adipose tissues (34). Dual-energy material decomposition yielded individual pixel measurements of glandular and adipose equivalent material thickness. The material decomposition was based on a previous system calibration with glandular and adipose equivalent phantoms (CIRS Inc., Norfolk, VA) (28, 38). Histogram thresholding was used to automatically segment the whole breast from the background. The pectoral muscle edge was then manually delineated and excluded from subsequent analyses. The remainder of the image was designated as the breast tissue region of interest and the mean glandular and adipose volumes for the whole breast were automatically calculated using dual-energy material decomposition. Breast density was calculated as the mean glandular volume fraction for the whole breast.
Statistical analysis
Fleiss’ Kappa was calculated to measure inter-reader variability in breast density ranking for different readers (39). The precision of different breast density measurement techniques was evaluated by linear regression of the breast densities measured from the left and the right breasts. Pearson’s r and the relative standard error of estimate obtained from the linear regression were used to assess the precision of different techniques for breast density measurement. The relative standard error of estimate was calculated by taking the ratio of the standard error of estimate from each technique relative to dual-energy material decomposition. The degree of agreement between breast densities measured from the left and right breasts using different techniques was also assessed using Bland–Altman analysis (40).
Results
In this study the correlation of right and left breast density was used to assess the precision of radiologist ranking, histogram thresolding, fuzzy C-mean and dual-energy material decomposition methods for measuring breast density. The right (DR) and left (DL) breast densities were linearly correlated as DR = 0.90 DL + 8.11 (r = 0.93) for radiologist reader rankings (Figure 1a). Additionally, in a Bland–Altman plot, the mean differences between DR and DL measurements were −4.1% ± 15.5% (Figure 1b). The inter-reader variability in breast density rankings from different readers is shown in figure 2. Fleiss’ Kappa as a measure of inter-reader variability for breast density categories 1, 2, 3, 4 and all the categories combined was calculated to be 0.66, 0.38, 0.41, 0.49 and 0.47, respectively.
Figure 1.


Comparison of converted areal breast densities from averaged radiologist reader rankings for right (DR) and left (DL) breasts (a). Additionally, in a Bland–Altman plot, the mean differences between DR and DL were −4.1% ± 15.5% (b).
Figure 2.

Inter-reader variability in breast density rankings (1–4) from different readers.
The breast density using histogram thresholding for the right and left breasts were correlated as DR = 0.87 DL + 5.03 (r = 0.80) (Figure 3a). Additionally, in a Bland–Altman plot, the mean differences between DR and DL measurements were −1.0% ± 20.2% (Figure 3b). The breast density from first (D1) and second (D2) readers were correlated as D2 = 0.51D1 + 22.1 (r = 0.59) (Figure 3c).
Figure 3.


Comparison of areal breast density for right (DR) and left (DL) breasts using standard histogram thresholding (a) and in a Bland–Altman plot, the mean differences between DR and DL were −1.0% ± 20.2% (b). The variability between the two operators is also shown (c).
The breast density for automatic Fuzzy C-mean technique was correlated as DR = 0.79 DL + 4.32 (r = 0.79) (Figure 4a). Additionally, in a Bland–Altman plot, the mean differences between DR and DL measurements were 1.5% ± 14.0% (Figure 4b).
Figure 4.


Comparison of areal breast density for right (DR) and left (DL) breasts using fuzzy C-mean algorithm. Additionally, in a Bland–Altman plot, the mean differences between DR and DL were 1.5% ± 14.0% (b).
Spectral mammography is capable of automatically generating glandular and adipose images in addition to the standard mammogram generated from a single exposure. As shown in Figure 5, the glandular tissue is primarily in the center of the breast and the skin has similar composition as glandular tissue. On the other hand, the adipose tissue is primarily on the periphery of the breast. The results showed that the measured volumes using dual-energy material decomposition for the right (VR) and left (VL) breasts were correlated as VR = 0.97VL + 7.86 (r = 0.97) (Figure 6a). The measured breast densities were correlated as DR = 0.90DL + 1.1 (r = 0.96) (Figure 6b). Additionally, in a Bland–Altman plot, the mean differences between DR and DL measurements were 0.2% ± 2.6% (Figure 6c). A summary of the linear regression parameters for the relation of breast density from the right and left breasts for all the different techniques is shown in Table 1. The relative standard error of estimate for breast density measurements from left and right breasts with radiologist rankings, standard histogram thresholding (Cumulus), fuzzy C-mean algorithm and dual-energy material decomposition was calculated to be 1.95, 2.87, 2.07 and 1.00, respectively.
Figure 5.
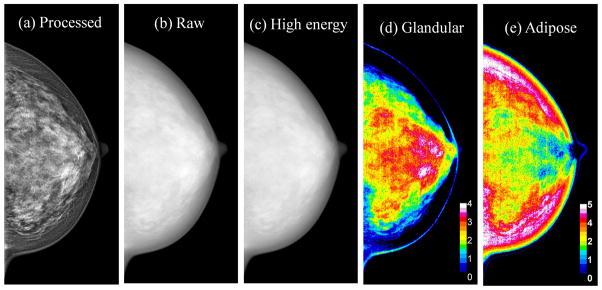
Examples of processed total (a), raw total (b), raw high energy (c), glandular (d) and adipose (e) images. The color scale represents the glandular and adipose thicknesses in a given pixel.
Figure 6.


Comparison of breast volume (a) and volumetric breast density (b) for right (DR) and left (DL) breasts using dual-energy material decomposition technique. Additionally, in a Bland–Altman plot, the mean differences between DR and DL were 0.2% ± 2.6% (c).
Table 1.
Summary of the linear regression analysis between left and right breast density measurements for various methods.
| Slope | Intercept | Pearson’s r | Normalized relative variance | |
|---|---|---|---|---|
| Readers | 0.90 | 8.1 % | 0.93 | 1.95 |
| Cumulus | 0.87 | 5.0 % | 0.80 | 2.87 |
| Fuzzy C-mean | 0.79 | 4.3 % | 0.79 | 2.07 |
| Spectral | 0.90 | 1.1 % | 0.96 | 1.00 |
Discussion
In this study precision of different breast density measurement techniques were determined using a right and left breast density comparison. Breast density estimation using radiologist reader assessment showed moderate inter- and intra-observer variability, which is in agreement with previous reports (22, 41). Breast density was also estimated using two area based techniques using standard histogram thresholding and fuzzy C-mean approach. In the case of histogram thresholding, the operator manually determines the grey level threshold for glandular tissue while the fuzzy C-mean technique is semi-automated. Breast density measurements from both of these techniques also showed considerable variability. These techniques are fundamentally limited by the visual or automated methods for segmentation of fibroglandular tissue in the projection images.
Breast tomosynthesis (42), MRI (43, 44) and CT (35, 45, 46) can also be used for breast density measurement. The tomographic nature of these techniques reduces the anatomical background, which simplifies segmentation of fibroglandular and adipose tissues as compared with standard digital mammography. However, there is still a need for automatic segmentation of breast tissue unless more advanced techniques such as dual energy or spectral CT (47, 48) are used. Another more practical limitation of these techniques is the fact that these modalities are not currently available for routine breast screening. This indicates that there is a need for more accurate quantification of breast density using digital mammography.
Fibroglandular and adipose tissue thicknesses can be quantitatively decomposed by exploiting the attenuation coefficient differences between them using dual-energy material decomposition. The energy information basically addresses the limitations related to the uncertainty associated with segmentation of fibroglandular tissue purely based on image gray level. Previous phantom and postmortem breast studies have validated the accuracy of breast density measurement using dual energy and spectral mammography (28, 29, 34, 38). The results from dual-energy material decomposition measurements from right and left breasts in this study also showed that volume and breast density measurements were highly correlated. The relative SEE from dual-energy material decomposition measurements was approximately factor of two lower as compared with radiologist reader assessment, histogram thresholding and fuzzy C-mean techniques. The Bland-Altman plots also showed a substantial reduction in standard deviation for dual-energy material decomposition as copared with the other methods. The results from this study is in agreement with our previous report on postmortem validation of dual-energy mammography, which also found approximately a factor of two improvement in relative SEE from dual-energy material decomposition as compared with the other techniques (29). A factor of two reductions in variance of breast density measurement using dual-energy material decomposition should allow for better integration of breast density into breast cancer risk models. Additionally, this objective measure of breast density could allow much more accurate prediction of mammographic sensitivity in a given breast than possible with radiologist reader assessment of breast density which entails moderate intra- and inter-observer variability.
A high relative precision along with the previously reported accuracy (28, 29, 34, 38) of breast density measurement using spectral mammography is expected to enhance its applications for personalized screening. Therefore, an automated method of measuring breast density could potentially be helpful in more accurately quantifying breast cancer risk and monitor changes in risk over time. It can also be used for treatment monitoring of drugs such as tamoxifen and raloxifene which reduce breast density and thereby the risk of breast cancer. Therefore, a more precise method of breast density measurement will enable to more reliably monitor the treatment on an individual basis.
One limitation of this study is that there is currently no reference gold standard to assess the accuracy of breast density measurements in patients. However, the accuracy of dual energy mammography has previously been validated both in phantoms (27, 34) and postmortem (29) studies. The results from the previous postmortem studies, where chemical analysis was used as the gold standard, indicate that a high correlation can be expected between right and left breast densities (29, 35). In this study precision of different breast density measurement techniques were assessed using a right and left breast density comparison. An averaged converted breast density was used for radiologist reader ranking comparison purposes, which is expected to have less variability as compared with a single radiologist performance. Another limitation of this retrospective study is that system calibration was not available so calibration data from a similar system was used (34). Previous phantom and postmortem studies indicate that careful system specific calibration with phantoms of known thickness and densities is required for accurate quantification of breast density (28, 34, 38). The lack of appropriate calibration data can introduce a systematic error in the breast density results. However, this systematic error is not expected to affect the correlation of breast density for right and left breasts. It also does not affect the relative SEE used in this study.
In summary, the results indicate that the precision of dual-energy material decomposition was approximately factor of two higher than the other techniques with regard to better correlation of breast density measurements from right and left breasts. Improved quantification of breast density is expected to further enhance its utility as a risk factor for breast cancer.
Acknowledgments
This work was supported in part by NIH/NCI grant R01CA13687.
Footnotes
This work was presented at 2012 RSNA annual meeting.
Publisher's Disclaimer: This is a PDF file of an unedited manuscript that has been accepted for publication. As a service to our customers we are providing this early version of the manuscript. The manuscript will undergo copyediting, typesetting, and review of the resulting proof before it is published in its final citable form. Please note that during the production process errors may be discovered which could affect the content, and all legal disclaimers that apply to the journal pertain.
References
- 1.Wolfe JN. Breast patterns as an index of risk for developing breast cancer. American Journal of Roentgenology. 1976;126:1130–1137. doi: 10.2214/ajr.126.6.1130. [DOI] [PubMed] [Google Scholar]
- 2.McCormack VA, dos Santos Silva I. Breast density and parenchymal patterns as markers of breast cancer risk: a meta-analysis. Cancer Epidemiol Biomarkers Prev. 2006;15:1159–1169. doi: 10.1158/1055-9965.EPI-06-0034. [DOI] [PubMed] [Google Scholar]
- 3.Saftlas AF, Szklo M. Mammographic Parenchymal Patterns and Breast-Cancer Risk. Epidemiologic Reviews. 1987;9:146–174. doi: 10.1093/oxfordjournals.epirev.a036300. [DOI] [PubMed] [Google Scholar]
- 4.Warner E, Lockwood G, Math M, Tritchler D, Boyd NF. The Risk of Breast-Cancer Associated with Mammographic Parenchymal Patterns - a Metaanalysis of the Published Literature to Examine the Effect of Method of Classification. Cancer Detection and Prevention. 1992;16:67–72. [PubMed] [Google Scholar]
- 5.Kopans DB. Basic physics and doubts about relationship between mammographically determined tissue density and breast cancer risk. Radiology. 2008;246:348–353. doi: 10.1148/radiol.2461070309. [DOI] [PubMed] [Google Scholar]
- 6.Tice JA, OMeara ES, Weaver DL, Vachon C, Ballard-Barbash R, Kerlikowske K. Benign Breast Disease, Mammographic Breast Density, and the Risk of Breast Cancer. Jnci-Journal of the National Cancer Institute. 2013;105:1043–1049. doi: 10.1093/jnci/djt124. [DOI] [PMC free article] [PubMed] [Google Scholar]
- 7.Harvey JA, Yaffe MJ. Density and Breast Cancer Risk. Radiology. 2013;267:657–658. doi: 10.1148/radiol.13122477. [DOI] [PubMed] [Google Scholar]
- 8.Boyd NF, Byng JW, Jong RA, et al. Quantitative Classification of Mammographic Densities and Breast-Cancer Risk - Results from the Canadian National Breast Screening Study. Journal of the National Cancer Institute. 1995;87:670–675. doi: 10.1093/jnci/87.9.670. [DOI] [PubMed] [Google Scholar]
- 9.Boyd NF, Guo H, Martin LJ, et al. Mammographic density and the risk and detection of breast cancer. N Engl J Med. 2007;356:227–236. doi: 10.1056/NEJMoa062790. [DOI] [PubMed] [Google Scholar]
- 10.Boyd NF, Martin LJ, Sun LM, et al. Body size, mammographic density, and breast cancer risk. Cancer Epidemiology Biomarkers & Prevention. 2006;15:2086–2092. doi: 10.1158/1055-9965.EPI-06-0345. [DOI] [PubMed] [Google Scholar]
- 11.Buist DS, Porter PL, Lehman C, Taplin SH, White E. Factors contributing to mammography failure in women aged 40–49 years. J Natl Cancer Inst. 2004;96:1432–1440. doi: 10.1093/jnci/djh269. [DOI] [PubMed] [Google Scholar]
- 12.Byrne C, Schairer C, Wolfe J, et al. Mammographic Features and Breast-Cancer Risk - Effects with Time, Age, and Menopause Status. Journal of the National Cancer Institute. 1995;87:1622–1629. doi: 10.1093/jnci/87.21.1622. [DOI] [PubMed] [Google Scholar]
- 13.Carney PA, Miglioretti DL, Yankaskas BC, et al. Individual and combined effects of age, breast density, and hormone replacement therapy use on the accuracy of screening mammography. Ann Intern Med. 2003;138:168–175. doi: 10.7326/0003-4819-138-3-200302040-00008. [DOI] [PubMed] [Google Scholar]
- 14.D’Orsi CJ, Mendelson EB, Ikeda DM. Breast Imaging Reporting and Data System (BI-RADS) 4. Reston, VA: American College of Radiology; 2004. [Google Scholar]
- 15.D’Orsi CJ, Getty DJ, Pickett RM, et al. Stereoscopic digital mammography: improved specificity and reduced rate of recall in a prospective clinical trial. Radiology. 2013;266:81–88. doi: 10.1148/radiol.12120382. [DOI] [PubMed] [Google Scholar]
- 16.Jackson VP, Hendrick RE, Feig SA, Kopans DB. Imaging of the Radiographically Dense Breast. Radiology. 1993;188:297–301. doi: 10.1148/radiology.188.2.8327668. [DOI] [PubMed] [Google Scholar]
- 17.Kerlikowske K, Grady D, Barclay J, Sickles EA, Ernster V. Effect of age, breast density, and family history on the sensitivity of first screening mammography. JAMA. 1996;276:33–38. [PubMed] [Google Scholar]
- 18.Vacek PM, Geller BM. A prospective study of breast cancer risk using routine mammographic breast density measurements. Cancer Epidemiol Biomarkers Prev. 2004;13:715–722. [PubMed] [Google Scholar]
- 19.Boyd NF, Greenberg C, Lockwood G, et al. Effects at two years of a low-fat, high-carbohydrate diet on radiologic features of the breast: results from a randomized trial. Canadian Diet and Breast Cancer Prevention Study Group. J Natl Cancer Inst. 1997;89:488–496. doi: 10.1093/jnci/89.7.488. [DOI] [PubMed] [Google Scholar]
- 20.Berg WA, Campassi C, Langenberg P, Sexton MJ. Breast Imaging Reporting and Data System: inter- and intraobserver variability in feature analysis and final assessment. AJR Am J Roentgenol. 2000;174:1769–1777. doi: 10.2214/ajr.174.6.1741769. [DOI] [PubMed] [Google Scholar]
- 21.Ooms EA, Zonderland HM, Eijkemans MJC, et al. Mammography: Interobserver variablility in breast density assessment. Breast. 2007;16:568–576. doi: 10.1016/j.breast.2007.04.007. [DOI] [PubMed] [Google Scholar]
- 22.Oza AM, Boyd NF. Mammographic Parenchymal Patterns - a Marker of Breast-Cancer Risk. Epidemiologic Reviews. 1993;15:196–208. doi: 10.1093/oxfordjournals.epirev.a036105. [DOI] [PubMed] [Google Scholar]
- 23.Carton AK, Li JJ, Chen S, Conant E, Maidment ADA. Optimization of contrast-enhanced digital breast tomosynthesis. In: Astley SM, Brady M, Rose C, Zwiggelaar R, editors. Digital Mammography, Proceedings; 2006; pp. 183–189. [Google Scholar]
- 24.Highnam R, Jeffreys M, McCormack V, Warren R, Smith GD, Brady M. Comparing measurements of breast density. Physics in Medicine and Biology. 2007;52:5881–5895. doi: 10.1088/0031-9155/52/19/010. [DOI] [PubMed] [Google Scholar]
- 25.Highnam R, Pan X, Warren R, Jeffreys M, Davey Smith G, Brady M. Breast composition measurements using retrospective standard mammogram form (SMF) Phys Med Biol. 2006;51:2695–2713. doi: 10.1088/0031-9155/51/11/001. [DOI] [PubMed] [Google Scholar]
- 26.Alonzo-Proulx O, Tyson A, Mawdsley G, Yaffe M. Effect of Tissue Thickness Variation in Volumetric Breast Density Estimation. In: Krupinski E, editor. Digital Mammography. Springer; Berlin/Heidelberg: 2008. pp. 659–666. [Google Scholar]
- 27.Ducote JL, Molloi S. Quantification of breast density with dual energy mammography: a simulation study. Medical Physics. 2008;35:5411–5418. doi: 10.1118/1.3002308. [DOI] [PMC free article] [PubMed] [Google Scholar]
- 28.Ducote JL, Molloi S. Quantification of breast density with dual energy mammography: an experimental feasibility study. Medical Physics. 2010;37:793–801. doi: 10.1118/1.3284975. [DOI] [PMC free article] [PubMed] [Google Scholar]
- 29.Molloi S, Ducote JL, Ding H, Feig SA. Postmortem validation of breast density using dual-energy mammography. Med Phys. 2014;41:081917. doi: 10.1118/1.4890295. [DOI] [PMC free article] [PubMed] [Google Scholar]
- 30.Aslund M, Cederstrom B, Lundqvist M, Danielsson M. Physical characterization of a scanning photon counting digital mammography system based on Si-strip detectors. Medical Physics. 2007;34:1918–1925. doi: 10.1118/1.2731032. [DOI] [PubMed] [Google Scholar]
- 31.Bornefalk H, Lewin JM, Danielsson M, Lundqvist M. Single-shot dual-energy subtraction mammography with electronic spectrum splitting: feasibility. Eur J Radiol. 2006;60:275–278. doi: 10.1016/j.ejrad.2006.08.004. [DOI] [PubMed] [Google Scholar]
- 32.Fredenberg E, Hemmendorff M, Cederstrom B, Aslund M, Danielsson M. Contrast-enhanced spectral mammography with a photon-counting detector. Med Phys. 2010;37:2017–2029. doi: 10.1118/1.3371689. [DOI] [PubMed] [Google Scholar]
- 33.Fredenberg E, Lundqvist M, Cederstrom B, Aslund M, Danielsson M. Energy resolution of a photon-counting silicon strip detector. Nuclear Instruments & Methods in Physics Research Section a-Accelerators Spectrometers Detectors and Associated Equipment. 2010;613:156–162. [Google Scholar]
- 34.Ding H, Molloi S. Quantification of breast density with spectral mammography based on a scanned multi-slit photon-counting detector: a feasibility study. Physics in Medicine and Biology. 2012;57:4719–4738. doi: 10.1088/0031-9155/57/15/4719. [DOI] [PMC free article] [PubMed] [Google Scholar]
- 35.Johnson T, Ding H, Le HQ, Ducote JL, Molloi S. Breast density quantification with cone-beam CT: a post-mortem study. Phys Med Biol. 2013;58:8573–8591. doi: 10.1088/0031-9155/58/23/8573. [DOI] [PMC free article] [PubMed] [Google Scholar]
- 36.Byng JW, Boyd NF, Fishell E, Jong RA, Yaffe MJ. The Quantitative-Analysis of Mammographic Densities. Physics in Medicine and Biology. 1994;39:1629–1638. doi: 10.1088/0031-9155/39/10/008. [DOI] [PubMed] [Google Scholar]
- 37.Keller BM, Nathan DL, Wang Y, et al. Estimation of breast percent density in raw and processed full field digital mammography images via adaptive fuzzy c-means clustering and support vector machine segmentation. Med Phys. 2012;39:4903–4917. doi: 10.1118/1.4736530. [DOI] [PMC free article] [PubMed] [Google Scholar]
- 38.Ducote JL, Klopfer MJ, Molloi S. Volumetric lean percentage measurement using dual energy mammography. Medical Physics. 2011;38:4498–4504. doi: 10.1118/1.3605632. [DOI] [PMC free article] [PubMed] [Google Scholar]
- 39.Fleiss JL. Measuring Nominal Scale Agreement among Many Raters. Psychological Bulletin. 1971;76:378–382. [Google Scholar]
- 40.Bland JM, Altman DG. Statistical Methods for Assessing Agreement between Two Methods of Clinical Measurement. Lancet. 1986;1:307–310. [PubMed] [Google Scholar]
- 41.Martin KE, Helvie MA, Zhou C, et al. Mammographic density measured with quantitative computer-aided method: comparison with radiologists’ estimates and BI-RADS categories. Radiology. 2006;240:656–665. doi: 10.1148/radiol.2402041947. [DOI] [PubMed] [Google Scholar]
- 42.Tagliafico AS, Tagliafico G, Cavagnetto F, Calabrese M, Houssami N. Estimation of percentage breast tissue density: comparison between digital mammography (2D full field digital mammography) and digital breast tomosynthesis according to different BI-RADS categories. Br J Radiol. 2013;86:20130255. doi: 10.1259/bjr.20130255. [DOI] [PMC free article] [PubMed] [Google Scholar]
- 43.Chen JH, Chan S, Liu YJ, et al. Consistency of breast density measured from the same women in four different MR scanners. Med Phys. 2012;39:4886–4895. doi: 10.1118/1.4736824. [DOI] [PMC free article] [PubMed] [Google Scholar]
- 44.Ding H, Johnson T, Lin M, et al. Breast density quantification using magnetic resonance imaging (MRI) with bias field correction: a postmortem study. Med Phys. 2013;40:122305. doi: 10.1118/1.4831967. [DOI] [PMC free article] [PubMed] [Google Scholar]
- 45.Nelson TR, Cervino LI, Boone JM, Lindfors KK. Classification of breast computed tomography data. Med Phys. 2008;35:1078–1086. doi: 10.1118/1.2839439. [DOI] [PMC free article] [PubMed] [Google Scholar]
- 46.Yang X, Wu S, Sechopoulos I, Fei B. Cupping artifact correction and automated classification for high-resolution dedicated breast CT images. Med Phys. 2012;39:6397–6406. doi: 10.1118/1.4754654. [DOI] [PMC free article] [PubMed] [Google Scholar]
- 47.Ding H, Ducote JL, Molloi S. Measurement of breast tissue composition with dual energy cone-beam computed tomography: A postmortem study. Medical Physics. 2013;40:061902. doi: 10.1118/1.4802734. [DOI] [PMC free article] [PubMed] [Google Scholar]
- 48.Ding H, Klopfer MJ, Ducote JL, Masaki F, Molloi S. Breast Tissue Characterization with Photon-counting Spectral CT Imaging: A Postmortem Breast Study. Radiology. 2014:132732. doi: 10.1148/radiol.14132732. [DOI] [PMC free article] [PubMed] [Google Scholar]