Abstract
Background
Measuring blood calcium level is recommended in haemodialysis (HD) patients. The Kidney Disease Improving Global Outcomes position states that the measurement of ionized calcium (ICa) level is preferred, but in the clinical setting, due to technical difficulties, total calcium (tCa) level is preferred to ICa.
Aim
The aim of this study was to test the possibility of delayed ICa analysis using frozen serum, and so to identify the factors associated with predialysis ICa level and compare the ability of tCa and Alb-Ca to predict ICa level and finally to compare the survival rate according to the three calcium measurements.
Methods
All prevalent HD patients, dialysed by a native AV fistula in a 3 × 4 to 3 × 8 h schedule, had their predialysis ICa, tCa and Alb-Ca levels and usual mid-week biology recorded. Intergroup comparisons between ICa quartile were performed. Bland–Altman plots and linear regression were used to assess the differences between 30 fresh and frozen samples. Survival analyses were performed using ICa and tCa levels.
Results
Comparing fresh blood and frozen serum samples, linear regression (y = 0.98 + 0.02, r = 0.961) showed that the two methods were quite identical with the same mean ICa value (1.1 ± 0.1 mmol/L, P = 0.45). A total of 160 HD patients were included in the study. Hypocalcaemia, using ICa values, was highly prevalent in our population (40%) whereas hypercalcaemia was observed only in three cases (1.8%). In predicting ICa hypocalcaemia (<1.12 mmol/L, n = 64), the use of tCa was accurate in 48.4% of patients, and the use of Alb-Ca was accurate in only 17.2% of patients; tCa was not a predictive factor for hypercalcaemia (ICa > 1.32 mmol/L, n = 3); Alb-Ca value predicted hypercalcaemia in 2/3 of the patients. In predicting normocalcaemia, the use of tCa values was correct in 92.4% of patients and the use of Alb-Ca values in 88.1% of patients; only younger age (P = 0.03) and female sex (P = 0.01) were associated with higher ICa quartile. None of the three calcium measures was significantly associated with survival rate using log-rank and Cox models adjusted for age, dialysis vintage, diabetes and sex.
Conclusion
In the present study, we report that (1) delayed ICa measure is feasible in dialysis patients using a freezing technique, (2) hypocalcaemia is highly prevalent in HD patients and poorly predicted by Alb-Ca level, (3) the main factor associated with ICa level is sex of the individual and (4) calcaemia is not associated with survival rate using any of the three methods.
Keywords: frozen sample, haemodialysis, ionized calcium, survival analysis
Introduction
In healthy individuals, serum calcium level is tightly controlled within a narrow range and homeostatic mechanisms rely mainly on immediate action of the parathyroid hormone (PTH), in relation with the calcium sensor receptor (CaSR) in detecting ionized calcium (ICa) levels. PTH acts first on bone to release calcium and then on the kidney to reabsorb it and later stimulates calcitriol synthesis and gastrointestinal calcium absorption [1].
In haemodialysis (HD) patients, special causes of variations are well known in association with dialysis-induced changes, haemoconcentration, subsequent haemodilution (albumin variation), interdialytic interval, vitamin D and calcium intake, PTH related disorders and bone resistance to PTH action [2].
Serum ICa, generally 40–50% of total serum calcium (tCa), is physiologically active, whereas non-ionized calcium is bound to albumin or anions such as citrate, bicarbonate and phosphate and is therefore not physiologically active. In the presence of hypoalbuminaemia, there is an increase in ICa level relative to tCa level; thus, serum tCa measurement may underestimate the ICa level. A commonly used formula for estimating ICa level using tCa level is the addition of 0.8 mg/dL (0.2 mmol/L) for every 1 g of decrease in serum albumin of <4 g/dL (40 g/L)[3]. This albumin-corrected calcium (Alb-Ca) formula is routinely used by many dialysis laboratories and in most clinical trials. Unfortunately, recent data have shown that it offers no superiority over tCa measurement alone and is less specific than ICa measurements [4, 5]. However, ICa measurement is not routinely available and, in some instances, may require additional costs for measuring and reporting. Besides, ICa value could be altered by some factors. Change in blood pH can alter the equilibrium of the albumin–Ca++ complex with acidosis reducing binding and alkalosis enhancing it. The use of anaerobic sampling to avoid loss of CO2, measuring levels as soon as possible or by storing the sample in iced water to avoid lactic acid formation can minimize pH changes in whole blood [6]. The anticoagulant heparin is associated with lower ICa levels in whole blood rather than in serum [7].
Blood calcium measurement is recommended in patients on HD. The Kidney Disease Improving Global Outcomes (KDIGO) foundation recommends the measurement of ICa levels if possible but in the clinical setting tCa level is preferred over that of Alb-Ca level [8]. Besides, the KDIGO recommended maintaining tCa level in the normal range, but with a low level of evidence.
No data are available on ICa values in HD patients, their associated factors and their impact on outcomes. Besides, one of the main problems in measuring ICa level is the need for a rapid technical procedure that is not always possible when dialysis wards are far from the laboratory.
The aims of the present study were as follows: (1) to validate the possibility of delayed measurement of ICa level from frozen samples, (2) to compare the ability of tCa and Alb-Ca levels in predicting ICa levels, (3) to identify the factors associated with predialysis levels of ICa (4) and to perform a survival analysis using the three types of calcium dosages.
Materials and methods
We included all patients under maintenance HD in our institution. Patients with central venous catheters as vascular access or with severe morbidity or acute medical event were excluded. Other exclusion criteria were monoclonal gammapathy and myeloma, malignancy, jaundice and haemolysis. The study was conducted in compliance with the Declaration of Helsinki.
Patients underwent dialysis three times a week (4–8 h) using polysulfone high-flux filters FX 60, 80, 100, 800 and 1000 (Fresenius Medical Care©, Bad Homburg, Germany) in HD or online post-dilution haemodiafiltration (HDF). Blood flow rates ranged from 220 to 400 mL/min; dialysate flow rates ranged from 350 to 800 mL/min. The standard dialysis calcium concentration was individualized, and the strategy was to decrease the DCa in cases where serum PTH is <150 pg/mL without hypocalcaemia or in cases of hypercalcaemia (≥2.5 mmol/L) and to increase the DCa in cases where serum PTH is >300 pg/mL without hypercalcaemia or in cases of hypocalcaemia. This strategy and its impact have been reported previously [9].
Baseline clinical and biological data were recorded, and blood samples were obtained from nonfasting patients before a mid-week dialysis session. All laboratory parameters were measured in the same blood draw. Blood was obtained through the dialysis arterial line 1–2 min after dialysis onset. Non-heparinized dry vacutainers were used to determine serum ICa levels and pH. Immediately after obtaining the samples, they were frozen (−30°c) and separated from cells, as reported previously [10]. ICa level was detected using a Nova© Stat Profil PhOx plus C analyser (Nova Biomedical©, Waltham, USA).
As ICa level is pH dependent, samples were analysed at the actual unadjusted pH of the individual patient. Serum albumin was measured using an automatic chemical analyser (bromocresol green). Alb-Ca level was calculated using the Payne formula: Alb-Ca mmol/L = tCa + 0.2 × [40 − albumin g/L][11].
In order to validate our freezing technique, fresh whole-blood and frozen serum ICa levels, with a 1-week delay in measurement, have been compared in 30 HD patients using the same blood sample.
Colorimetric assay (Arsenazo III, ABBOT© Architect, Abbott Laboratories©, Abbott Park, Illinois, USA.) was used for the measurement of tCa. Intact PTH was measured using a second-generation assay (ElecSysG; Roche Diagnostics, Meylan, France), and the reference values were 14–72 pg/mL. Specific bone alkaline phosphatase (b-ALP; chemiluminescence, reference values 3.7–20 µg/L) and β-cross-laps (CTX; Elecsys, Roche Diagnostics) were used as bone markers.
Common laboratory analyses were performed by Laboratory du Grand Vallon NOVESCIA© Lyon, France, and b-ALP were assayed by Biomnis© laboratory, Lyon, France.
Statistical analysis
Normally distributed variables were expressed as mean ± SD. Intergroup comparisons between ICa quartile were performed using unpaired t-test or Fisher exact test or Person chi-square with ƙ test. Bland–Altman plots and linear regression were used to assess the differences between the methods. Survival analyses were performed using Kaplan–Meier, log-rank test and Cox model.
Analyses were performed using MedCalc© Statistical Software version 14.12.0 (MedCalc Software, Ostend, Belgium).
Results
Comparing fresh and frozen samples
Linear regression (y = 0.98 + 0.02, r = 0.961) showed that the two methods were quite identical with the same mean (1.1 ± 0.1 mmol/L, P = 0.45 using paired t-test). The Bland and Altman analysis showed that only 1/30 sample (3.3%) was outside the 95% confidence range.
Demographic data and calcium distribution
Among the 232 patients in our institution, 35 were excluded due to central venous catheter, 5 for active malignancy, 2 for myeloma, 12 for acute medical event (6 infections, 2 fractures and 4 vascular procedures) and 18 for other severe comorbid condition (10 cachexia and 8 bedridden).
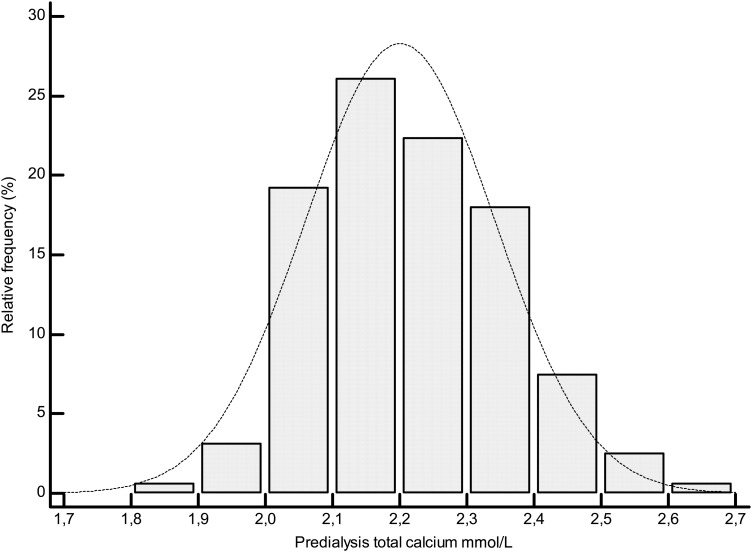
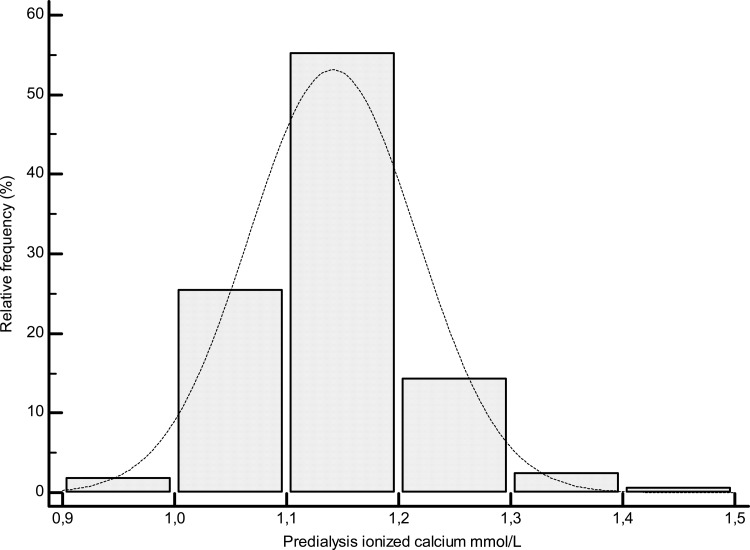
A total of 160 HD patients were included in the study. Data for all patients and according to the ICa quartiles are reported in Table 1. The mean tCa level was 2.2 ± 0.14 mmol/L (range, 1.86–2.65 mmol/L, Figure 1), and the mean Alb-Ca level was 2.3 ± 0.13 mmol/L (range, 1.9–2.67 mmol/L). The mean ICa level was as follows: 1.14 ± 0.07 mmol/L [range, 0.93–1.4 mmol/L (Figure 2)].
Table 1.
Baseline characteristics according to ionized calcium quartiles
| All | 1st Ica quartile 0.93–1.09 mmol/L | 2nd Ica quartile 1.1–1.13 mmol/L | 3rd Ica quartile 1.14–1.18 mmol/L | 4th Ica quartile 1.19–1.53 mmol/L | |
|---|---|---|---|---|---|
| Age (years) | 71.8 ± 14 | 74 ± 14 | 71.8 ± 14 | 73.6 ± 14 | 67.8 ± 13 |
| Female gender (%) | 41.6 | 30 * | 32.5 | 48.6 | 50.6 * |
| Dialysis vintage (months) | 67.8 ± 75 | 84 ± 97 | 69 ± 59 | 64 ± 82 | 51 ± 53 |
| Diabetes (%) | 36.6 | 38 | 32.5 | 48.6 | 27.5 |
| Cardiac disease (%) | 32 | 32 | 31 | 36 | 30 |
| Peripheral vascular disease (%) | 21.7 | 22 | 22 | 27 | 15 |
| Chronic liver disease (%) | 16.8 | 22 | 17 | 14 | 12.5 |
| Parathyroidectomy (%) | 6.2 | 7 | 7.5 | 8 | 2.5 |
| BMI (kg/m2) | 24.9 ± 5 | 25 ± 5 | 24.7 ± 5 | 25 ± 6 | 25 ± 6 |
| Dialysis session time (minutes) | 298 ± 75 | 290 ± 80 | 315 ± 90 | 282 ± 72 | 300 ± 71 |
| Dialysate calcium (mmol/L) | 1.51 ± 0.18 | 1.52 ± 0.17 | 1.53 ± 0.18 | 1.49 ± 0.2 | 1.51 ± 0.19 |
| Kt/V (Daugirdas-2) | 2.05 ± 0.5 | 1.95 ± 0.5 | 2 ± 0.5 | 2 ± 0.6 | 2.1 ± 0.5 |
| Online-postdilution-HDF (%) | 29.9 | 36 | 22 | 32 | 27 |
| PTH (pg/mL) | 210 ± 143 | 240 ± 182 | 222 ± 147 | 182 ± 114 | 190 ± 100 |
| Ionized calcium (mmol/L) | 1.14 ± 0.07 | 1.05 ± 0.03* | 1.11 ± 0.01* | 1.16 ± 0.01* | 1.23 ± 0.05* |
| Total calcium (mmol/L) | 2.2 ± 0.14 | 2 ± 0.1* | 2.15 ± 0.1* | 2.22 ± 0.1* | 2.35 ± 0.1* |
| Alb-corrected calcium (mmol/L) | 2.3 ± 0.13 | 2.18 ± 0.1* | 2.26 ± 0.1* | 2.34 ± 0.1* | 2.42 ± 0.1* |
| Phosphorus (mmol/L) | 1.4 ± 0.3 | 1.42 ± 0.3 | 1.32 ± 0.3 | 1.42 ± 0.3 | l.43 ± 0.3 |
| Albumin (g/L) | 34.8 ± 4 | 35 ± 4 | 34.2 ± 4 | 33.8 ± 4 | 36 ± 4 |
| nPNA (g/kg/day) | 1.12 ± 0.2 | 1.08 ± 0.2 | 1.08 ± 0.2 | 1.11 ± 0.3 | 1.22 ± 0.3 |
| b-ALP (µg/L) | 18.3 ± 13 | 21 ± 17 | 18.7 ± 13 | 16.3 ± 11 | 16.8 ± 10 |
| CTX (µg/L) | 1.7 ± 0.8 | 1.7 ± 1 | 1.7 ± 0.7 | 1.6 ± 0.9 | 1.7 ± 0.8 |
| 25-OH-D (nmol/L) | 95.8 ± 27 | 93 ± 28 | 103 ± 28 | 90 ± 23 | 97 ± 27 |
| Hb (g/L) | 11.8 ± 1.4 | 11.8 ± 1.3 | 11.5 ± 1.4 | 12.2 ± 1.4 | 12 ± 1.4 |
| pH | 7.36 ± 0.08 | 7.36 ± 0.06 | 7.37 ± 0.1 | 7.35 ± 0.08 | 7.36 ± 0.08 |
| Total CO2 mmol/L | 22.5 ± 2.7 | 22.6 ± 2.5 | 23.3 ± 3 | 22.1 ± 3 | 22.6 ± 3.3 |
| CaCO3 (day (%)) | 1680 (16.8) | 1500 (20) | 1730 (15) | 1500 (15) | 1750 (17.5) |
| Calcium acetate (day (%)) | 812 (16.8) | 835 (22.5) | 668 (5)* | 918 (10)* | 712 (30) |
| Sevelamer (day (%)) | 3840 (30.6) | 3600 (32.5) | 4150 (32.5) | 3450 (30) | 4150 (27.5) |
| Alfacalcidol (week (%)) | 2.8 (18.1) | 3 (12.5) | 3.1 (17.5) | 2.8 (20) | 2.5 (22.5) |
| Cinacalcet (day (%)) | 44 (11.2) | 46 (12.5) | 38 (7.5) | 42 (7.5) | 48 (17.5) |
| Cholecalciferol (%) | 91.5 | 90 | 88 | 93 | 92.5 |
| Steroids (%) | 11.3 | 11 | 17 | 8 | 7.5 |
| Femoral neck t-score | −2.5 ± 1.4 | −2.6 ± 1.6 | −2.5 ± 1.2 | −2.7 ± 1.4 | −2.2 ± 1.2 |
| Forearm t-score | −3.1 ± 1.8 | −3 ± 1.9 | −3 ± 1.5 | −3 ± 2 | −3 ± 2 |
| Aortic calcification score /24 | 13.4 ± 6 | 13.2 ± 6 | 13.4 ± 5 | 14 ± 7 | 13.1 ± 8 |
A significant difference between groups (P < 0.01) is marked with *.
Fig. 1.
Distribution plot of total calcium values.
Fig. 2.
Distribution plot of ionized calcium values.
Hypocalcaemia, using ICa values, was highly prevalent in our population (40%) whereas hypercalcaemia was observed only in three cases (1.8%). In predicting ICa hypocalcaemia (<1.12 mmol/L, n = 64), using tCa level was correct in 48.4% of patients (Tables 2 and 3) (sensitivity 48.4%, specificity 92.6%). Using Alb-Ca level was correct in only 17.2% of patients (sensitivity 17.1%, specificity 88%). tCa level was not a predictive factor for hypercalcaemia (ICa > 1.32 mmol/L, n = 3); Alb-Ca predicted hypercalcaemia in 2/3 of the patients.
Table 2.
Agreement between Alb-corrected calcium, total calcium and ionized calcium levels for the diagnosis of hypocalcaemia, normocalcaemia and hypercalcaemia
| Total n = 160 | Hypocalcaemia I-Ca < 1.12 mmol/L n = 64 (40%) |
Normocalcaemia I-Ca 1.12–132 mmol/L n = 93 (58%) |
Hypercalcaemia I-Ca > 1.32 mmol/L n = 3 (1.8%) |
|---|---|---|---|
| Total calcium < 2.1 mmol/L n = 38 (23.7%) | 31 | 7 | 0 |
| Total calcium 2.1–2.55 mmol/L n = 121 (75.6%) | 33 | 86 | 2 |
| Total calcium > 2.55 mmol/L n = 1 | 0 | 0 | 1 |
| Alb-corrected calcium < 2.1 mmol/L n = 22 (13.7%) | 11 | 11 | 0 |
| Alb-corrected calcium 2.1–2.55 mmol/L n = 136 (86.2%) | 53 | 82 | 1 |
| Alb-corrected calcium > 2.55 mmol/L n = 2 (1.2%) | 0 | 0 | 2 |
Table 3.
Diagnostic test for predicting I-Ca hypocalcaemia and normocalcaemia
| Predicting ICa hypocalcaemia | Predicting ICa normocalcaemia | |
|---|---|---|
| Total calcium | ||
| Sensitivity % | 48.4 | 92.4 |
| Specificity % | 92.6 | 47.7 |
| Positive predicting value % | 81.5 | 71 |
| Negative predicting value % | 72.7 | 82 |
| Alb-corr-calcium | ||
| Sensitivity % | 17.1 | 88.1 |
| Specificity % | 88.5 | 19.4 |
| Positive predicting value % | 50 | 60.2 |
| Negative predicting value % | 61.5 | 54.1 |
In predicting normocalcaemia, using tCa level was correct in 92.4% of patients (sensitivity 92.4%, specificity 47.7%), and using Alb-Ca level in 88.1% of patients (sensitivity 88.1, specificity 19.4%).
Thus, tCa levels appear clearly superior to Alb-Ca levels in predicting ICa hypocalcaemia and normocalcaemia. The mean ratios of tCa/ICa and Alb-Ca/ICa were 1.93 and 2.02, respectively.
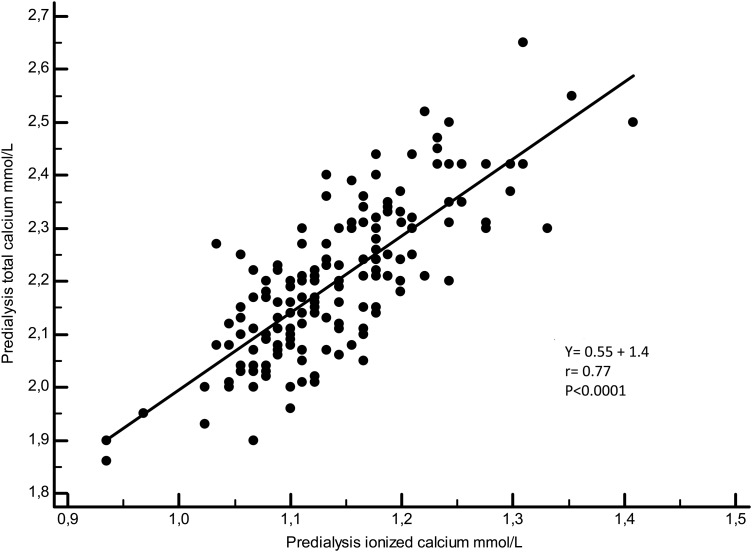
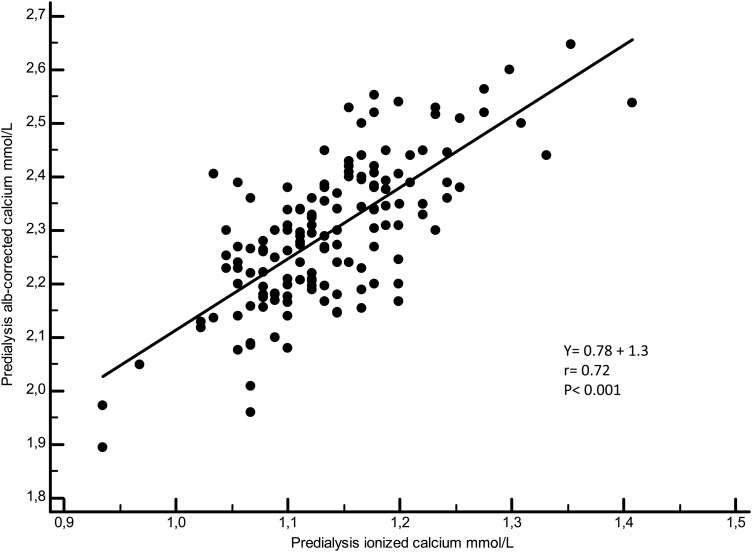
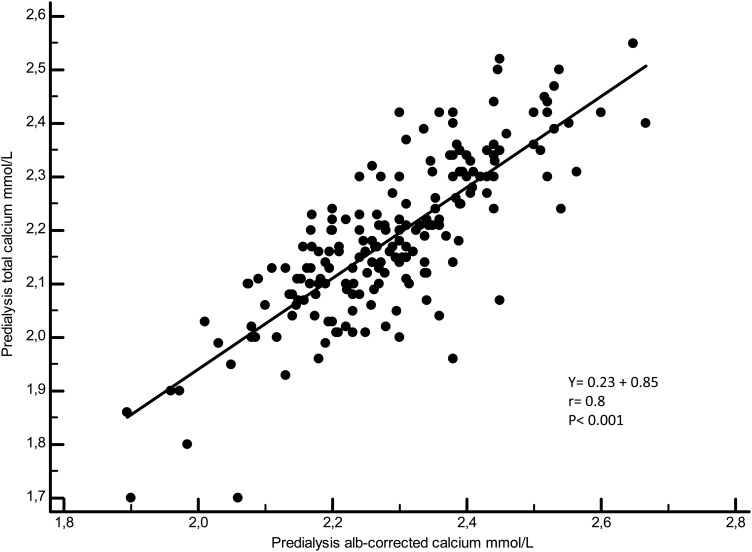
Figures 3–5 illustrate the linear regressions between ICa and tCa, ICa and Alb-Ca and between tCa and Alb-Ca levels. With a mean serum albumin value of 34.8 ± 4 g/L, Alb-Ca level gives a higher value than tCa by a mean of 4.5%.
Fig. 4.
Linear regression between ionized calcium and total calcium.
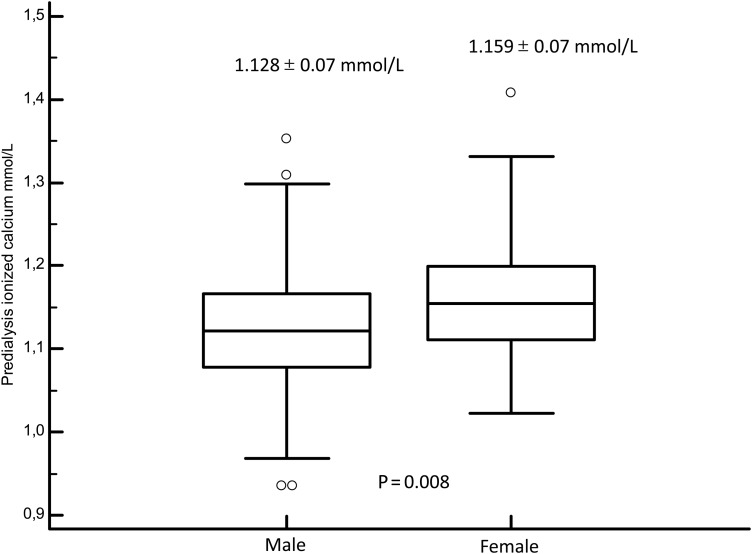
Fig. 3.
Box plot of ionized calcium between male and female individuals.
Fig. 5.
Linear regression between ionized calcium and Alb-corr-calcium.
Apart from tCa and Alb-Ca levels, the only factor associated with higher ICa quartile was female sex (50.6 versus 30% for the first quartile, P < 0.001). Thus, we observed that ICa level was lower in men (1.12 ± 0.07) than in women (1.16 ± 0.07, P = 0.008, Figure 6).
Fig. 6.
Linear regression between total calcium and Alb-corr-calcium.
Serum bone markers, PTH values, aortic calcification scores and bone mineral density values were not associated with ICa quartiles (Table 1). The same is true for oral calcium dosage, dialysate calcium concentration, native and active vitamin D, cinacalcet and a history of parathyroidectomy. Notably, the percentage of HD patients treated by using calcium acetate was higher in ICa quartiles 1 and 4 as compared with quartiles 2 and 3.
We performed a logistic regression in order to identify the factors associated with the higher ICa quartile (Table 4). Only younger age (P = 0.03) and female sex (P = 0.01) were associated with higher ICa quartile. Serum iPTH, cinacalcet and calcium acetate prescription were not associated with higher serum ICa quartile.
Table 4.
Factors associated with higher ICa quartile (1.19–1.53 mmol/L)
| Variable | Coefficient | Std Error | Odds ratio | 95% CI | P |
|---|---|---|---|---|---|
| Age years | −0.03 | 0.01 | 0.97 | 0.94 to 0.99 | 0.03 |
| Dialysis vintage months | −0.004 | 0.003 | 0.99 | 0.98 to 1.001 | 0.16 |
| Female sex | 1.007 | 0.4 | 2.74 | 1.23 to 6 | 0.01 |
| PTH pg/mL | −0.002 | 0.001 | 0.997 | 0.994 to 1.0004 | 0.13 |
| Cinacalcet mg/day | 0.02 | 0.01 | 1.02 | 0.99 to 1.05 | 0.1 |
| Calcium acetate tab/day | 0.18 | 0.1 | 1.2 | 1.01 to 1.4 | 0.06 |
Survival analysis
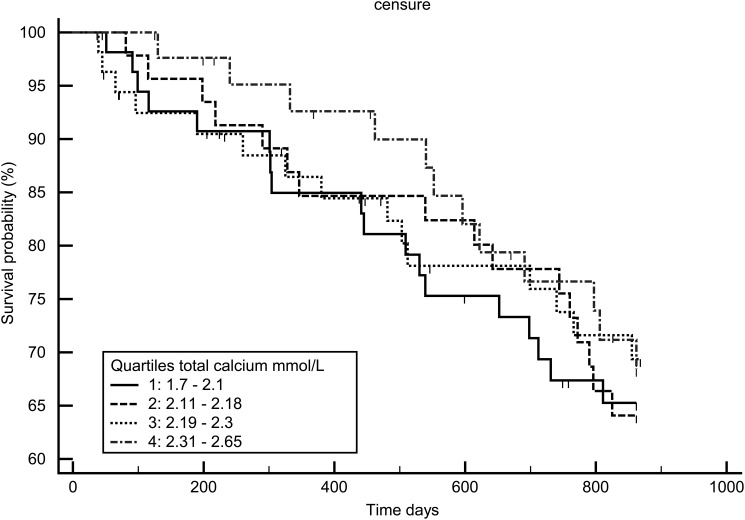
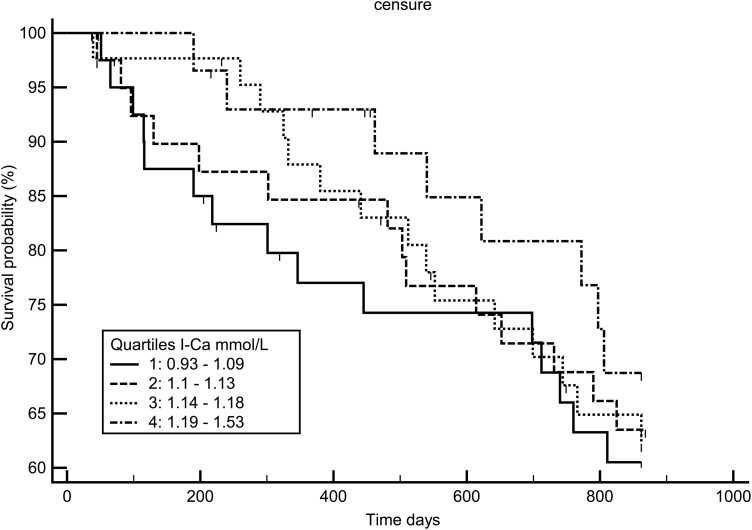
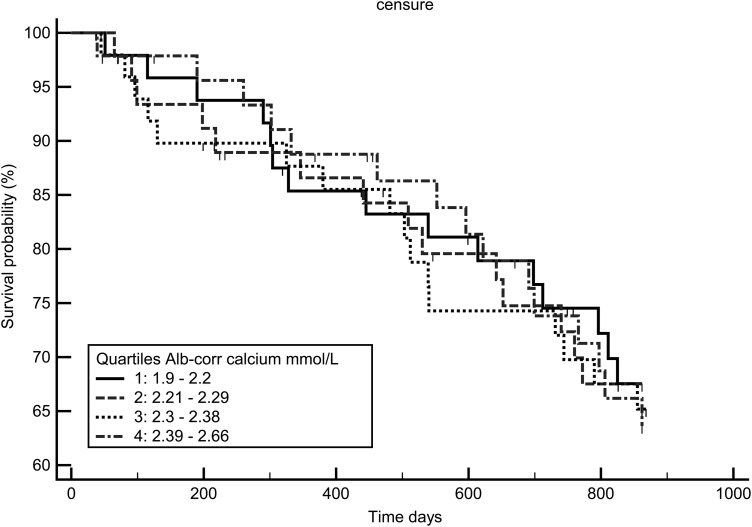
Figures 7–9 display the survival curves according to the ICa, tCa and alb-Ca quartiles. None of the three calcium measures was significantly associated with survival rate using the log-rank test and Cox model adjusted for age, dialysis vintage, diabetes and gender.
Fig. 8.
Kaplan–Meir survival curve according to total calcium quartiles.
Fig. 7.
Kaplan–Meir survival curve according to ionized calcium quartiles.
Fig. 9.
Kaplan–Meir survival curve according to Alb-corr- calcium quartiles.
Discussion
In the present study, we report, to the best of our knowledge, for the first time that (1) delayed ICa measurement is feasible in HD patients using a serum freezing technique, (2) hypocalcaemia is highly prevalent in HD patients and poorly predicted by using Alb-Ca levels, (3) the main factor associated with ICa levels is sex of the individual and (4) calcaemia is not associated with survival rate using any of the three methods.
ICa measure
Precision in ICa measurement was revolutionized with the introduction of ion-selective electrodes, but the clinical application of this technique was limited due to cost, susceptibility to errors, lack of standardization, need to prevent CO2 loss and control of pH [12]. In some conditions, including CKD, dialysis and hyperparathyroidism, ICa measurement has been shown to be superior in identifying calcium disturbance [13].
Measuring ICa from frozen serum samples has been described previously [10, 14], and some authors reported the need for correction due to loss of CO2 [15]. We report here almost perfectly identical fresh total blood sample and frozen serum ICa values. We believe that this information could help nephrologist in measuring ICa in a non-urgent situation, because frozen samples allow for delayed analysis.
Hypocalcaemia in HD
According to the Dialysis Outcomes and Practice Pattern study (DOPPS), mean serum tCa level decreased in HD patients in France between 1999 (2.37 mmol/L) and 2006 (2.22 mmol/L) and thereafter remained stable. This value is close to our mean tCa (2.2 mmol/L). During this period, in the DOPPS, hypocalcaemia increased from 6.6 to 20% and hypercalcaemia decreased from 17 to 3%. This tendency has been observed in most countries [16]. In a French cohort of HD prevalent patients, we have previously reported that mean tCa level was 2.21 ± 0.1 mmol/L in agreement with our data [17]. Clase et al. reported 22% of ionized hypocalcaemia in HD patients [4]. The high prevalence of hypocalcaemia in our study, as detected by using ICa measurement (40%), whereas by using tCa (23.7%) and Alb-Ca levels (13.7%), is close to other reported results. This should allow the hypothesis that real hypocalcaemia is highly prevalent and underestimated by both tCa and Alb-Ca measures.
Predicting ICa using tCa and Alb-Ca levels
A recent paper from Korea also reported frequent hypocalcaemia in HD patients (tCa 2.07 ± 0.1, ICa 1.03 ± 0.05, hypocalcaemia 40%) with the same pH [18]. The correlation coefficients found in this study were close to our finding: 0.8 between ICa and tCa and 0.78 between ICa and Alb-Ca compared with 0.77 and 0.72 in our study. Ladenson et al. reported no advantage in any of the 13 formulas for Ca correction [19]. Comparing Alb-Ca and ICa levels in HD patients, Goransson et al. reported a misclassification mainly in identify hypercalcaemic patients [20]. Clase et al. reported that Alb-Ca formula led to more misclassification than tCa did in HD patients [4].
Our data did not confirm that the use of Alb-Ca misclassifies patients as hypercalcaemic more frequently, maybe because hypercalcaemia was very rare in our study. However, the Alb-Ca formula failed to identify adequately hypocalcaemic patients. The underdiagnosis of hypocalcaemia, by using tCa and mostly by Alb-Ca levels, may lead to inappropriate clinical choices regarding the use of vitamin D, calcium supplements, dialysate calcium concentration and cinacalcet. As in Morton et al., we think that it is important to identify patients who are persistently hypercalcaemic, based on the importance of hypercalcaemia on mortality and vascular calcification [21]. In a review, Calvi et al. stated that patients in the latter stages of CKD should be followed by ICa measurements to prevent inappropriate use of medications (calcium, vitamin D or cinacalcet)[22].
In the NephroTest cohort, Gauci et al. reported that both tCa and Alb-Ca levels poorly predicted both hypo- and hyper-calcaemia in >600 CKD 3–5 patients [5]. Labriola et al. pointed out the key pitfall in measuring albumin using different assays [23]. ICa measurement is more expensive than that of tCa, but if we add the correction for albumin or total protein, CO2t and phosphate the cost differential narrows. However, the most potent restraint to its use is that there is no reimbursement in France for ICa measurement.
ICa-associated factors
In the DOPPS, male sex has been associated with hypocalcaemia [24], and in a large HD cohort from the USA, hypercalcaemia was more frequently observed in female gender [25]. We observed the same gender impact on ICa without clear explanation. Recently, Rathod et al. reported an important sex difference in the association of 24-h urinary calcium excretion with serum calcium and serum 25(OH)D [26]. The role of oestrogen may be hypothesized, and a direct stimulatory effect of oestrogen on 1α-hydroxylase [27] has been observed. Another explanation could be the calcium levels in the diet; however, we have no data on that hypothesis.
The lack of relationship between ICa and PTH levels could be due to an abnormal set point [28, 29]. The set point could be modified by both calcitriol analogues [28, 30] and calcimimetics [31], whose prescription did not differ across the ICa quartiles, and also by parathyroid CaSR or vitamin D receptor number and function [32], but that could not be assessed and so only hypothesized.
Calcaemia and survival
In the Treat to Goal study, cardiovascular (CV) calcification progression has been observed in patients with serum Alb-Ca level of >2.37 mmol/L [33]. Thus, the Kidney Disease Outcomes Quality Initiative experts recommended the maintenance of Alb-Ca levels of <2.37 mmol/L in order to decrease Ca × P product and the risk for CV calcification [11].
The DOPPS also reported an increased mortality for baseline serum calcium levels of <2.15 and >2.5 mmol/L [16]. In a large observational HD cohort from the USA, Rivara et al. reported a lower mortality rate for serum tCa between 2.12 and 2.55 mmol/L [25]. However, the mean tCa value was higher than that in our study (2.3 versus 2.2 mmol/L) and the hazard ratios for mortality were low, <1.5 for the extreme tCa values, explaining the need for large cohort to obtain significant differences. In a French HD cohort, Fouque et al. reported that the mortality risk was increased for tCa levels of >2.41 and <1.59 mmol/L [17]. In our study, we have no patient with tCa level of <1.6 mmol/L and only 3% with tCa level of >2.5 mmol/L and that may explain that none of the calcium quartile is associated with outcomes.
Summary
Our study has some limitations due to the small number of patients included. However, it reports some original and useful results. Even when using immediate deep freezing as we did with a perfect accuracy with fresh sampling, due to the cost of measuring ICa without reimbursement, it remains unlikely that all centres will be able to introduce ICa measurement for all CKD patients. Besides, we failed to show that ICa measurement is superior to other methods based on outcomes. Despite vitamin D supplementation and mean dialysate calcium concentration of 1.5 mmol/L, predialysis hypocalcaemia is still highly prevalent in the HD patients. Together with the relatively high serum PTH level, this should question the need to provide more calcitriol analogues and more calcium to our patients. The male predominance of hypocalcaemic patients was unexpected and remains poorly explained. In our centre, hypocalcaemia has no significant impact on survival rate. We were unable to demonstrate any accuracy of both tCa and Alb-Ca levels for detecting hypercalcaemia that was rarely observed. However, tCa and mostly Alb-Ca levels clearly underestimated hypocalcaemia. Therefore, we believe that ICa should be measured in situations where hypo- and hypercalcaemia might have been underestimated and would have clinical consequences.
Funding
This study was supported by Fresenius Medical Care, France.
Conflicts of interest statement
G.J., C.C., J-M.H., B.M., P.D. and C.L. declare to be consultants for Fresenius Medical Care France.
References
- 1.Akerstrom G, Hellman P, Hessman O, et al. Parathyroid glands in calcium regulation and human disease. Ann N Y Acad Sci 2005; 1040: 53–58 [DOI] [PubMed] [Google Scholar]
- 2.Gardham C, Stevens PE, Delaney MP, et al. Variability of parathyroid hormone and other markers of bone mineral metabolism in patients receiving hemodialysis. Clin J Am Soc Nephrol 2010; 5: 1261–1267 [DOI] [PMC free article] [PubMed] [Google Scholar]
- 3.Payne RB, Little AJ, Williams RB, et al. Interpretation of serum calcium in patients with abnormal serum proteins. Br Med J 1973; 15; 4: 643–646 [DOI] [PMC free article] [PubMed] [Google Scholar]
- 4.Clase CM, Norman GL, Beecroft ML, et al. Albumin-corrected calcium and ionized calcium in stable haemodialysis patients. Nephrol Dial Transplant 2000; 15: 1841–1846 [DOI] [PubMed] [Google Scholar]
- 5.Gauci C, Moranne O, Fouqueray B, et al. Pitfalls of measuring total blood calcium in patients with CKD. J Am Soc Nephrol 2008; 19: 1592–1598 [DOI] [PMC free article] [PubMed] [Google Scholar]
- 6.Boink AB, Buckley BM, Christiansen TF, et al. International Federation of Clinical Chemistry (IFCC), scientific division: IFCC recommendation on sampling transport and storage for the determination of the concentration of ionized calcium in whole blood, plasma and serum. Eur J Clin Chem Clin Biochem 1991; 29: 767–772 [PubMed] [Google Scholar]
- 7.Sachs C, Rabouine P, Chaneac M, et al. In vitro evaluation of a heparinized blood sampler for ionized calcium measurement. Ann Clin Biochem 1991; 28(Pt 3): 240–244 [DOI] [PubMed] [Google Scholar]
- 8.KDIGO C-M, Work Group. KDIGO clinical practice guideline for the diagnosis, evaluation, prevention, and treatment of chronic kidney disease-mineral and bone disorder (CKD-MBD). Kidney Int 2009; 76(Suppl 113): S1–130 [DOI] [PubMed] [Google Scholar]
- 9.Jean G, Mayor B, Hurot JM, et al. Biological impact of targeted dialysate calcium changes in haemodialysis patients: the key role of parathyroid hormone. Nephrol Dial Transplant 2013; 28: 176–182 [DOI] [PubMed] [Google Scholar]
- 10.Plant SB, McCarron DA. Sample freezing on ion-selective electrode determinations of serum calcium. Clin Chem 1982; 28: 1362–1363 [Google Scholar]
- 11.Eknoyan G, Levin A, Levin NW. Bone metabolism and disease in chronic kidney disease. Am J Kidney Dis 2003; 42(4 Suppl 3): 1–201 [PubMed] [Google Scholar]
- 12.Moore EW. Ionized calcium in normal serum, ultrafiltrates, and whole blood determined by ion-exchange electrodes. J Clin Invest 1970; 49: 318–334 [DOI] [PMC free article] [PubMed] [Google Scholar]
- 13.Bowers GN, Jr, Brassard C, Sena SF. Measurement of ionized calcium in serum with ion-selective electrodes: a mature technology that can meet the daily service needs. Clin Chem 1986; 32: 1437–1447 [PubMed] [Google Scholar]
- 14.Simard S, Dorval M. Measurement of ionized calcium in the blood with a selective electrode. Effect of prolonged freezing. Union Med Can 1973; 102: 531–535 [PubMed] [Google Scholar]
- 15.Roeder BL, Clark FD. Determination of serum ionized calcium concentration in dairy cattle after frozen anaerobic storage. Vet Clin Pathol 1995; 24: 44–48 [DOI] [PubMed] [Google Scholar]
- 16.Tentori F, Blayney MJ, Albert JM, et al. Mortality risk for dialysis patients with different levels of serum calcium, phosphorus, and PTH: the Dialysis Outcomes and Practice Patterns Study (DOPPS). Am J Kidney Dis 2008; 52: 519–530 [DOI] [PubMed] [Google Scholar]
- 17.Fouque D, Roth H, Pelletier S, et al. Control of mineral metabolism and bone disease in haemodialysis patients: which optimal targets? Nephrol Dial Transplant 2013; 28: 360–367 [DOI] [PubMed] [Google Scholar]
- 18.Kang SH, Cho KH, Park JW, et al. Whole blood versus serum ionized calcium concentrations in dialysis patients. Korean J Intern Med 2014; 29: 226–230 [DOI] [PMC free article] [PubMed] [Google Scholar]
- 19.Ladenson JH, Lewis JW, Boyd JC. Failure of total calcium corrected for protein, albumin, and pH to correctly assess free calcium status. J Clin Endocrinol Metab 1978; 46: 986–993 [DOI] [PubMed] [Google Scholar]
- 20.Goransson LG, Skadberg O, Bergrem H. Albumin-corrected or ionized calcium in renal failure? What to measure? Nephrol Dial Transplant 2005; 20: 2126–2129 [DOI] [PubMed] [Google Scholar]
- 21.Morton AR, Garland JS, Holden RM. Is the calcium correct? Measuring serum calcium in dialysis patients. Semin Dial 2010; 23: 283–289 [DOI] [PubMed] [Google Scholar]
- 22.Calvi LM, Bushinsky DA. When is it appropriate to order an ionized calcium? J Am Soc Nephrol 2008; 19: 1257–1260 [DOI] [PubMed] [Google Scholar]
- 23.Labriola L, Wallemacq P, Gulbis B, et al. The impact of the assay for measuring albumin on corrected (‘adjusted’) calcium concentrations. Nephrol Dial Transplant 2009; 24: 1834–1838 [DOI] [PubMed] [Google Scholar]
- 24.Young EW, Albert JM, Satayathum S, et al. Predictors and consequences of altered mineral metabolism: the dialysis outcomes and practice patterns study. Kidney Int 2005; 67: 1179–1187 [DOI] [PubMed] [Google Scholar]
- 25.Rivara MB, Ravel V, Kalantar-Zadeh K, et al. Uncorrected and Albumin-corrected calcium, phosphorus, and mortality in patients undergoing maintenance dialysis. J Am Soc Nephrol 2015. Jan 22. doi:10.1681/ASN.2014050472 [DOI] [PMC free article] [PubMed] [Google Scholar]
- 26.Rathod A, Bonny O, Guessous I, et al. Association of urinary calcium excretion with serum calcium and vitamin D levels. Clin J Am Soc Nephrol 2015; 10: 452–462 [DOI] [PMC free article] [PubMed] [Google Scholar]
- 27.Aarskog D, Aksnes L, Markestad T, et al. Effect of estrogen on vitamin D metabolism in tall girls. J Clin Endocrinol Metab 1983; 57: 1155–1158 [DOI] [PubMed] [Google Scholar]
- 28.Rodriguez M, Caravaca F, Fernandez E, et al. Evidence for both abnormal set point of PTH stimulation by calcium and adaptation to serum calcium in hemodialysis patients with hyperparathyroidism. J Bone Miner Res 1997; 12: 347–355 [DOI] [PubMed] [Google Scholar]
- 29.Goodman WG, Belin T, Gales B, et al. Calcium-regulated parathyroid hormone release in patients with mild or advanced secondary hyperparathyroidism. Kidney Int 1995; 48: 1553–1558 [DOI] [PubMed] [Google Scholar]
- 30.Malberti F, Surian M, Cosci P. Improvement of secondary hyperparathyroidism and reduction of the set point of calcium after intravenous calcitriol. Kidney Int Suppl 1993; 41: S125–S130 [PubMed] [Google Scholar]
- 31.de Francisco ALM, Izquierdo M, Cunningham J, et al. Calcium-mediated parathyroid hormone release changes in patients treated with the calcimimetic agent cinacalcet. Nephrol Dial Transplant 2008; 23: 2895–2901 [DOI] [PubMed] [Google Scholar]
- 32.Tominaga Y, Sato K, Tanaka Y, et al. Histopathology and pathophysiology of secondary hyperparathyroidism due to chronic renal failure. Clin Nephrol 1995; 44 Suppl 1: S42–S47 [PubMed] [Google Scholar]
- 33.Chertow GM, Raggi P, Chasan-Taber S, et al. Determinants of progressive vascular calcification in haemodialysis patients. Nephrol Dial Transplant 2004; 19: 1489–1496 [DOI] [PubMed] [Google Scholar]


