Abstract
Purpose
To determine the value of topographic spectral-domain optical coherence tomography (SD-OCT) imaging features assessed after macular hole repair surgery in predicting visual acuity (VA) outcomes.
Methods
An automated algorithm was developed to topographically outline and quantify area, extent, and location of defects in the ellipsoid zone (EZ) band and inner retina layers in SD-OCT scans. We analyzed the correlation of these values with VA in longitudinal observations from 35 patients who underwent successful macular hole surgery, in their first observation after surgery (within 2 months), and in a single observation within 6 to 12 months after surgery. Image features assessed at the first visit after surgery were also investigated as possible predictors of future VA improvement.
Results
Significant correlation with longitudinal VA was found for the extent, circularity, and ratio of defects in EZ band at the fovea and parafoveal regions. The ratio of defects in EZ band at the fovea, temporal-inner, and inferior-inner macula regions showed significant strong correlation with VA within 6 to 12 months post surgery. Patients with worse vision outcome at such time also had a significantly higher rate of inner retinal defects in the superior-outer region in their first postsurgery observation.
Conclusions
A lowering extent of EZ band defects in the foveal and parafoveal regions is a good indicator of postsurgery VA recovery. Attention should also be given to postsurgical alterations in the inner retina, as patients with more extensive atrophic changes appear to have slower or worse VA recovery despite closure of the macular hole.
Keywords: macular hole, image analysis, optical coherence tomography, vision recovery, postsurgery
We have developed automated methods to quantitatively analyze post-operative macular hole defects as observed in spectral-domain optical coherence tomography scans. We analyzed the correlation and predictive value with post-surgery visual acuity outcomes of the extracted quantifications.
Understanding the healing process after surgery for closure of macular holes (MHs) may provide insight into maximizing surgical success and predicting visual acuity (VA) outcomes. Spectral-domain optical coherence tomography (SD-OCT) is a widely used noninvasive, medical imaging technique to provide in vivo high resolution, cross-sectional three-dimensional images of the retina,1–5 allowing ophthalmologists to identify and quantify macular abnormalities in various vitreoretinal diseases such as MHs,6 providing valuable information before7 and after MH surgery,8 or to even assist intraoperatively.9,10
Advances in SD-OCT instrumentation and image analysis methods have led to the development of numerous automated intraretinal segmentation methods, both in commercial systems11 or by research groups,12–20 and tools to quantify macular disease progression.21 However, analysis of postoperative SD-OCT data in MH patients has not moved significantly beyond the manual annotation of defects in a single two-dimensional horizontal-scan through the foveal center.22 This manual assessment has two fundamental issues: The largest width of a defect may lie in an oblique axis,6 making measurements in horizontal-scans unreliable, and the lack of standardized measuring criteria adds an element of subjectivity when judging margins,22 leading to potential ambiguity.
These issues may be the cause of ambiguity between previous reports studying the association of the integrity of the photoreceptor ellipsoid zone (EZ) band or the external limiting membrane (ELM)22–30 with VA in surgically anatomically closed MHs. While some studies demonstrated statistically significant correlation of VA with the diameter and area of EZ band defects,22–26 others reported no such correlation and gave more importance to defects involving the ELM.27–29 Another study did not find correlation of VA with either EZ band or ELM defects at times later than 6 months after surgery, but instead found correlation with the cone outer segment tips (COST) line.30
Findings predicting potential restoration of VA in surgically closed MHs have also not been sufficiently clarified. A study showed that a higher diameter of EZ band defects measured at 3 months after surgery was associated with poorer VA at 12 months,31 while others found such association not to be significant, but found that less extensive ELM defects measured shortly after surgery may indicate a higher chance of vision restoration at 626 or 12 months.28
Defects in the inner retinal layers, such as the nerve fiber layer (NFL), the ganglion cell complex (GCL), or the inner plexiform layer (IPL), mainly occurring in the temporal region, have also been reported and associated to lower visual function.32 Postsurgical inner retina defects, mainly caused by inner limiting membrane (ILM) peeling during the surgical procedure33 or by dye toxicity during intraoperative staining32,34 can be observed in SD-OCT images as localized dips in the ILM boundary translating in isolated regions of inner retina (IR) thinning23,28,34,35 with higher incidence in the supero-temporal region.36 However, such chronically persisting defects33 have not correlated with VA23,28 and an association with poorer vision recovery has also not been observed.28 This lack of association may be due to the limitations mentioned previously.
Topographic measurements of postoperative defects in SD-OCT-derived en face images have been shown to be more reliable, with greater correlation with VA than when measured in cross-sectional images,22 and a robust automated method would eliminate subjective judgment. We have developed automated methods to quantify defects in the EZ band and the inner retina by extracting a set of image features related to defect topographic extent and location. We examined the correlation of these imaging features with VA in postoperative MH longitudinal SD-OCT scans, eliminating any subjective judgment and ambiguities derived from making measurements manually in cross-sectional scans.
Methods
Study Data Set
This study used data from 35 patients who underwent surgical repair in a single eye (45.71% right eyes) after being diagnosed with stage III or stage IV MH by funduscopic and SD-OCT examination. These patients were collected consecutively from those who had surgery performed by one vitreoretinal surgeon (TL), also had a healthy fellow eye, and attained anatomical closure of the MH 1 month after surgery on funduscopic and SD-OCT examination. No other exclusion criteria were considered. The research was approved by the institutional Human Subjects Committee and followed the tenets of the Declaration of Helsinki. All surgeries were performed by 25-gauge 3-port pars plana vitrectomy. After the vitreous was removed, the ILM was stained with indocyanine green (2.5 mg/mL in 5% dextrose water) for 20 seconds. End-grasping ILM forceps were used to elevate and peel the ILM from the macula and around the MH. A gas endotamponade (14% C3F8 or 18% SF6) was used in all cases, and 10 days of face-down positioning was prescribed.
We collected each patient's preoperative VA and the macular SD-OCT scans and VA examinations from both the surgical and nonsurgical healthy fellow eye (acting as control) at each clinic visit after surgery was performed. Patients were followed for an average time of 14.01 months.
All SD-OCT scans were acquired as part of standard institutional protocol at the Byers Eye Institute at Stanford with a Cirrus HD-OCT instrument (Carl Zeiss Meditec, Inc., Dublin, CA, USA), in the form of volumes with dimensions of 6 (horizontal) × 6 (vertical) × 2 (axial) mm, with 512 × 128 × 1024 voxels (three-dimensional pixel), respectively. The raw data produced by the SD-OCT instrument were imported into the vendor's proprietary software for analysis and reconstruction (Cirrus Research Browser, version 6.2.0.3) and later exported as files describing the reflectivity measured at each voxel location with 8-bit precision (limitation imposed by the system manufacturer). All following data processing was carried out using Matlab (The MathWorks, Inc., Natick, MA, USA).
Computation of Topographic Maps From SD-OCT Images
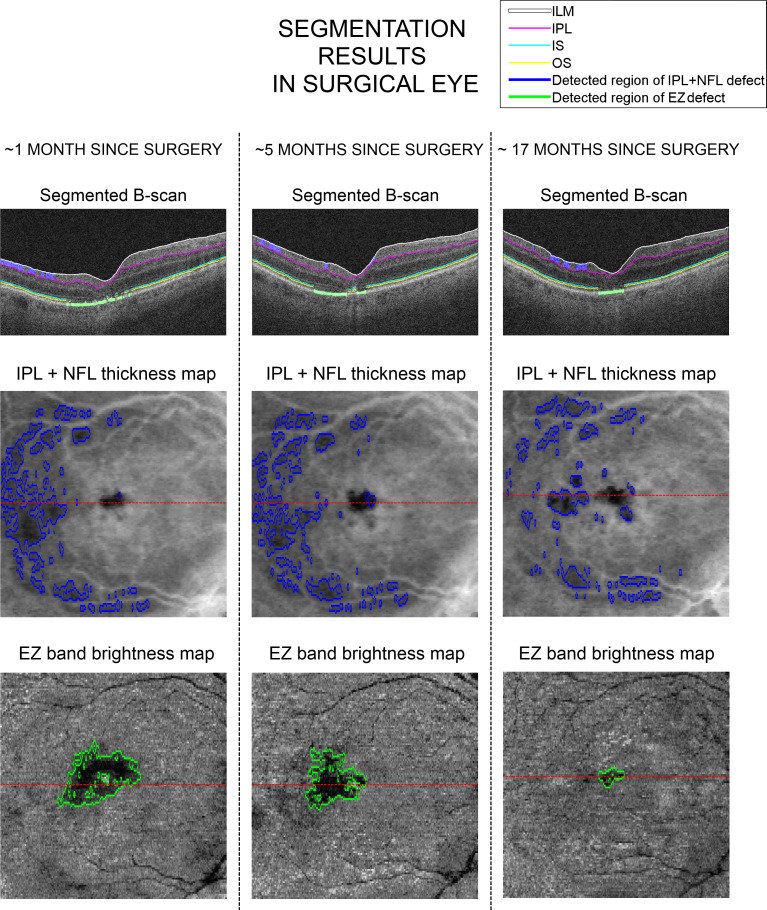
The axial location of the ILM boundary, outer boundary of the IPL, inner and outer boundaries of the EZ band (inner segment and outer segment, IS and OS, respectively), and outer boundary of the retinal pigment epithelium (RPE) were determined automatically in a pixel-by-pixel basis for all the SD-OCT images using an intraretinal layer automated segmentation method37 (de Sisternes L, et al. IOVS 2014;55:ARVO E-Abstract 4799; Leng T, et al. IOVS 2014;55:ARVO E-Abstract 4802). The algorithm iteratively seeks to resolve the location of continuous boundaries associated to intraretinal layers, considering intensity and gradient properties in the volumetric data, a set of smoothness constraints and common predefined rules: the order of appearance of the layers in the axial direction, the gradient direction of each particular boundary, and the known constraint that the layers do not cross each other. Example results of this automated segmentation in scans from the same eye acquired at three different times after surgery are displayed in the B-scans shown in Figure 1.
Figure 1.
Example of retinal boundary and defect segmentation results for a single eye. The first, second, and third columns display the results at approximately 1 month, 5 months, and 17 months after surgery, respectively. The first row displays a horizontal scan across the center of the fovea with white, magenta, light blue, and yellow markings indicating the location of the ILM, IPL, IS, and OS boundaries, respectively. The region of blue shading between ILM and IPL and green shading around the RPE region correspond to regions of segmented IPL + NFL defects and regions of EZ band defects, respectively. The corresponding IPL + NFL topographic thickness maps and EZ band brightness maps are displayed in the second and third rows, respectively, together with outlines of the corresponding defect segmentation results. The red line in the topographic maps indicates the location of the B-scan on top.
We used the segmentation results to generate topographic maps of the full retina thickness (distance from ILM to RPE), thickness of a complex of inner retina layers called IPL + NFL thickness for simplicity and comprising the NFL, GCL, and IPL (distance from ILM to outer boundary of IPL), and EZ band thickness (distance between IS and OS boundaries), by computing the axial differences between the boundaries at each location in a horizontal–vertical plane. Given the smoothness constrains imposed by the automated segmentation method, the typically very small distance between the two boundaries defining the EZ band and the characteristic noise in SD-OCT scans, the thickness in small regions of EZ band damage could have higher estimated values as a result of smoothing with nearby healthy locations. In order to mitigate this effect, we assessed the integrity of the EZ band by also computing additional brightness maps, generated by adding in the axial direction the SD-OCT voxel values (previously normalized linearly to take values from 0–1) within the two boundaries, in a manner previously described.38–40 The result is an en face image where the typical brightness loss characteristic of EZ band defects can be observed.
The center of the fovea was automatically detected and set up as the image center in order to align the thickness and brightness in topographic maps for comparison. This center was detected by finding the location of lowest retinal thickness within the region of depression observed in the fovea pit. Right eyes and left eyes were also similarly aligned to display the superior, inferior, nasal, and temporal regions in the same location within the topographic maps (top, and bottom, right and left of the image, respectively).
Regions of EZ band defects were automatically segmented considering the topographic EZ band thickness and brightness maps, and IPL + NFL defect regions were automatically segmented in their corresponding thickness maps. Segmentation of defects was achieved by considering regions of localized decrease of thickness or brightness within the maps and by comparison to the distribution of values observed in an age-matched healthy group. Details on the segmentation of defects in the EZ band and the IPL + NFL complex are included in the Appendix. Figure 1 shows examples of IPL + NFL thickness map and EZ band brightness maps and their corresponding segmented defect regions for an eye at three different times after surgery.
EZ Band and IPL + NFL Complex Defect Feature Extraction
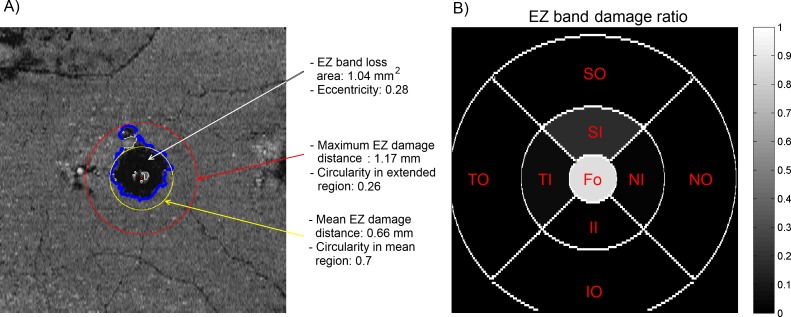
A set of 44 quantitative features, 15 describing the area, extent, and location of defects in the EZ band and 29 describing those in the IPL + NFL complex, were extracted from each corresponding defect segmentation in the topographic maps. Table 1 contains the name and description of the features analyzed. An example representation of the 15 features related to EZ band defects is shown in Figure 2.
Table 1.
Extracted Features Describing Defects in the EZ Band (1–15) and the IPL + NFL Complex (16–44)
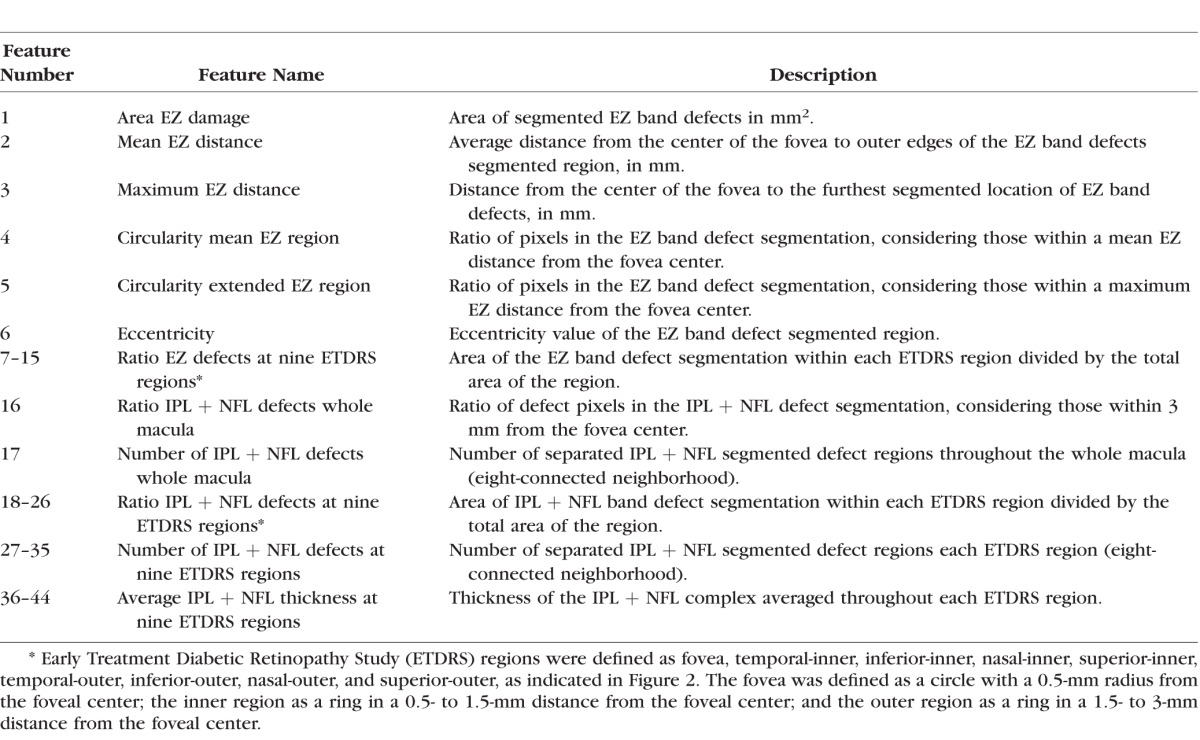
Figure 2.
Representation of features describing EZ band defects. (A) Ellipsoid zone band brightness map where the outer edges of the segmented defect are outlined in blue. The red and yellow outlines represent circles centered at the fovea with radius equal to the maximum damage distance and the mean damage distance, respectively. (B) Corresponding rations of EZ band damage in nine defined macula regions: Fovea (Fo), temporal-inner (TI), inferior-inner (II), nasal-inner (NI), superior-inner (SI), temporal-outer (TO), inferior-outer (IO), nasal-outer (NO), and superior-outer (SO).
Results
Qualitative Validation of Segmentation Results
The segmentation results of all SD-OCT scans were reviewed by an expert ophthalmologist (TL) in order to verify that the outlines produced automatically followed the appropriate retinal boundaries. The reviewer was shown the results in horizontal and vertical scans across the center of the fovea, as well as in the topographic views, in a similar manner as shown in Figure 1. The reviewer determined that all the outlines produced by the automated method were of appropriate quality, following closely the retinal boundaries so that no substantial adjustments were needed.
Comparison Between Surgical Eyes and Nonsurgical Fellow Eyes
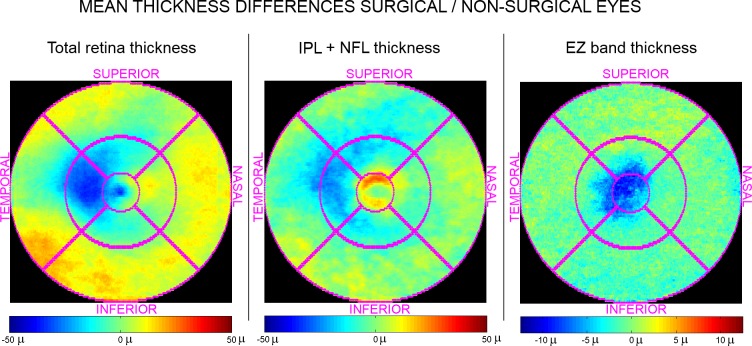
We compared the full retina, IPL + NFL, and EZ band thickness topographic maps obtained at the first clinic visit after surgery (mean of 5.04 months after surgery, SD of 2.83 months) from each surgical eye to their corresponding nonsurgical fellow eye. Figure 3 shows the average difference at each topographic location in this comparison. As expected, the surgical eyes have distinctly thinner (or disrupted) EZ band in the fovea and parafovea regions, as the photoreceptors are still partly restored even when the MH was anatomically closed after surgery. The IPL + NFL complex also shows evident thinning in the surgical eyes, mainly in the temporal region and extending to the superior and inferior regions, probably due to surgical trauma. Full retina thickness differences mainly account for those changes observed in the EZ band and the IPL + NFL complex.
Figure 3.
Mean differences in thickness maps between surgical eyes and their corresponding fellow nonsurgical eye at the first collected scan after surgery. Negative values correspond to lower thickness values in surgical eyes. The first, second, and third columns correspond to total retina, IPL + NFL, and EZ band thickness differences, respectively.
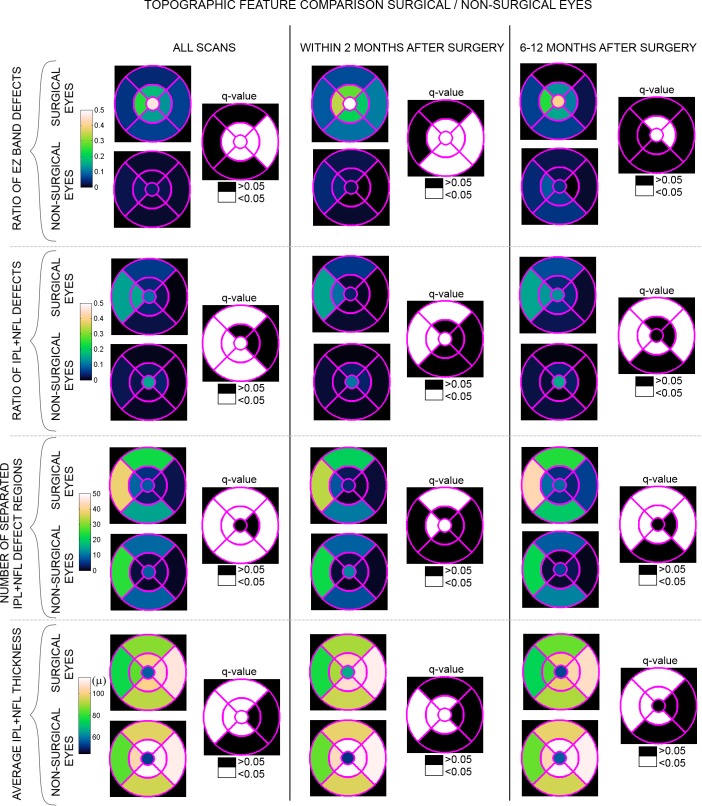
We compared the distribution of logMAR VA measurements and each of the extracted features between surgical eyes and the paired healthy nonsurgical fellow eyes (with VA of 20/40 or better) using a mixed-effects analysis of variance (ANOVA), where patient number is a random effect.41 The ANOVA P values were corrected using a multiple hypothesis testing analysis by estimating the false-positive discovery rate Q values,42,43 considering all tested features. The comparison was performed in three different ways: (1) for all the scans acquired after surgery; (2) for a single scan from each patient acquired within 2 months after surgery; and (3) for a single scan from each patient acquired at the time of best VA in the range between 6 and 12 months after surgery. Only those patients with available OCT data at the two discrete time intervals (number listed in Table 2) were considered in the corresponding comparisons. The mean, SD, and Q values for the comparison are listed in Table 2 for those features not associated to a particular macular region and displayed in Figure 4 for those features related to a particular macula region. We considered Q values under 0.05 of statistical significance (bold in Table 2, and indicated in Fig. 4).
Table 2.
Distribution Comparison Between Surgical Eyes and Nonsurgical Fellow Eyes
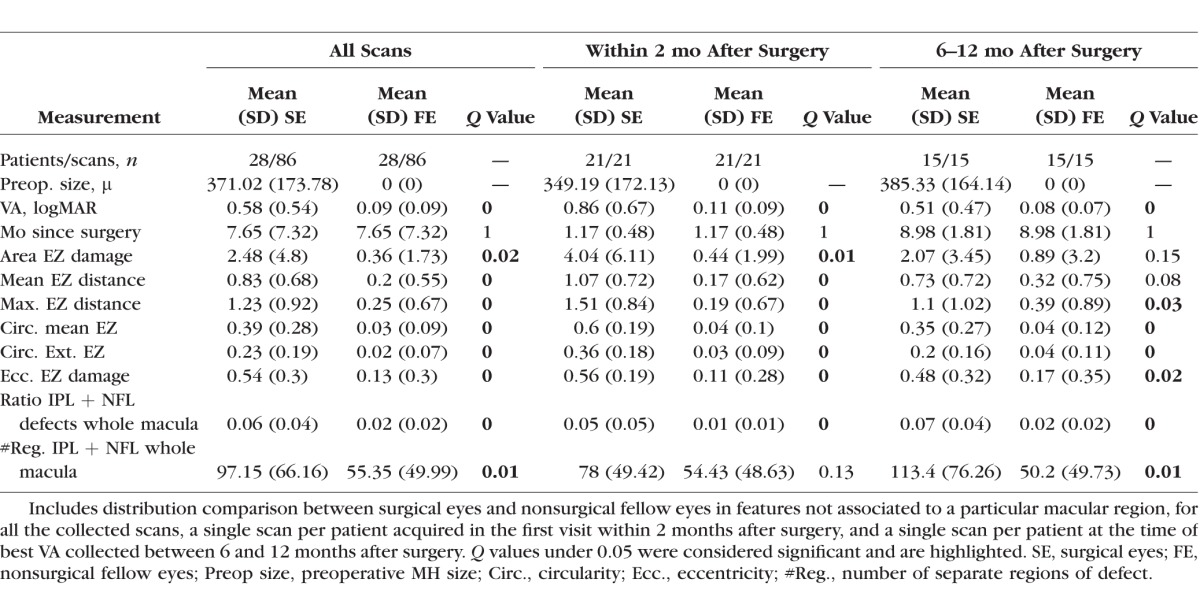
Figure 4.
Mean values and comparison (Q values) between surgical eyes and nonsurgical fellow eyes in features associated to a particular macular region, for all the collected scans (columns on the left), a single scan per patient acquired in the first visit within 2 months after surgery (columns in the middle), and a single scan per patient at the time of best VA collected between 6 and 12 months after surgery (columns on the right). Mean values are displayed within their associated region in the colored maps, with locations as indicated previously in Figure 2B and Figure 3. Statistically significant Q values (<0.05) are displayed in white.
Correlation of Extracted Features With VA in Surgical Eyes
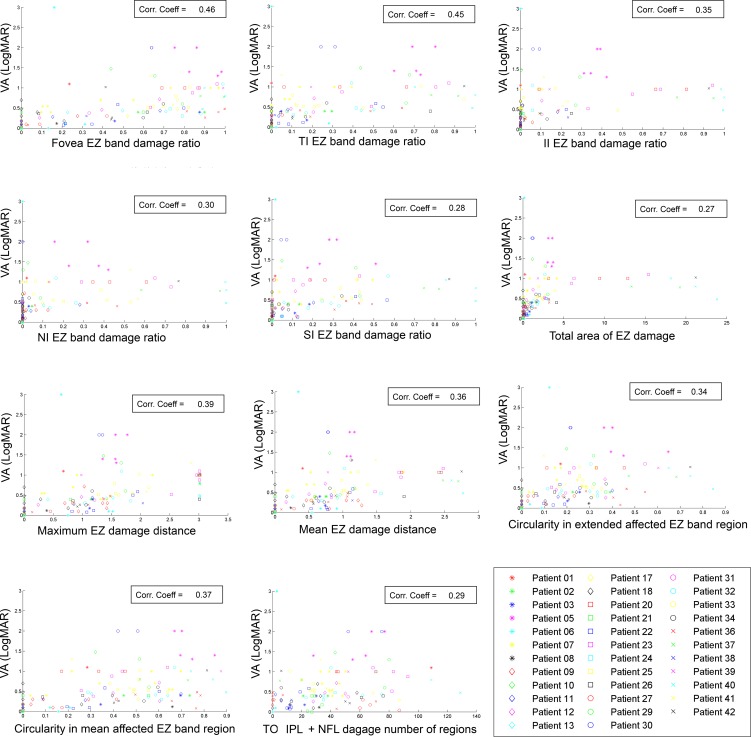
We computed the correlation coefficient with logMAR VA for each of the features extracted from the surgical eyes in three different scenarios: (1) considering all postsurgical clinic visits; (2) considering a single measurement per patient at a scan acquired within 2 months after surgery (30 patients available); and (3) considering a single measurement per patient at a scan acquired at the time of best VA in the range between 6 and 12 months after surgery (16 patients available). Correlation was analyzed using a Pearson's linear approach44 and was considered significant for P values under 0.01 testing for the hypothesis of no correlation. Eleven of the mentioned features (10 obtained from EZ band defect regions, one from IPL + NFL defect regions) showed significant correlation considering the longitudinal data, with the highest correlation values observed for the EZ defect ratio in the fovea region (cc = 0.46) and the EZ defect ratio in the temporal inner region (cc = 0.45). Correlation coefficients and a graph of the significantly correlated features against measured VA are shown in Figure A3 in the Appendix.
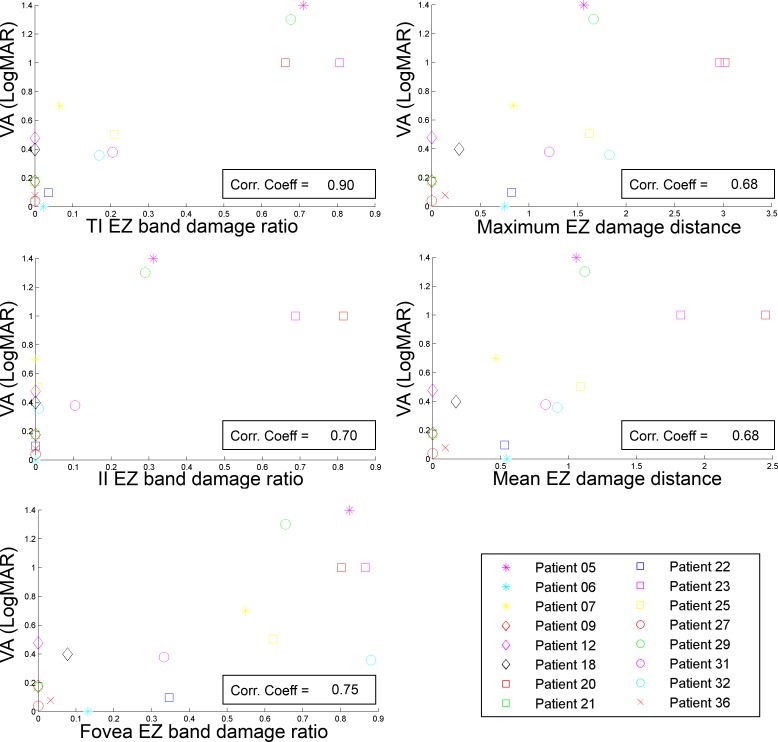
Overall, we found no statistically significant correlation between the analyzed features and VA within 2 months after surgery. However, we found statistically significant correlation for the analysis between 6 and 12 months after surgery for five of the EZ band defect features, with the highest correlation coefficient observed for the ratio of damage in the temporal inner region (cc = 0.9). Correlation coefficients and a graph of the significantly correlated features against measured VA at 6 to 12 months after surgery are shown in Figure A4 in the Appendix.
Features as Biomarkers of VA Recovery After MH Surgery
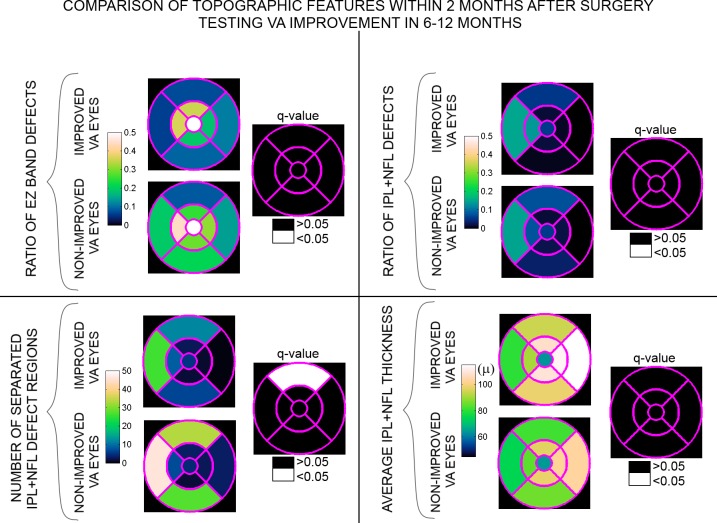
A set of 24 surgical eyes had SD-OCT exams within 2 months after surgery and future available VA information, and were classified in two groups: Eyes who substantially improved their vision or regained a normal vision within 6 to 12 months after surgery (16 eyes) and eyes who did not (8 eyes). Substantial vision improvement was considered to be a regain of two lines of vision after surgery or a 20/40 or better VA. We studied the possible relationship between the features extracted within 2 months after surgery with future VA recovery at a later time, evaluating the distribution differences for each feature between the two groups (patients who later regained vision versus those who did not), also including VA information and preoperative MH size. Statistical significance was analyzed by computing the multiple hypothesis testing corrected Q values considering all tested features,42,43 testing against the hypothesis of no difference. The mean and Q values for this comparison are listed in Table 3 for features not associated to a particular macular region and displayed in Figure 5 for features related to a particular macula region. Only one feature, number of IPL + NFL damage regions in the superior outer region, was found to be statistically significant (Q value < 0.05, highlighted in Fig. 5).
Table 3.
Comparison in Features Values Collected at First Scan After Surgery
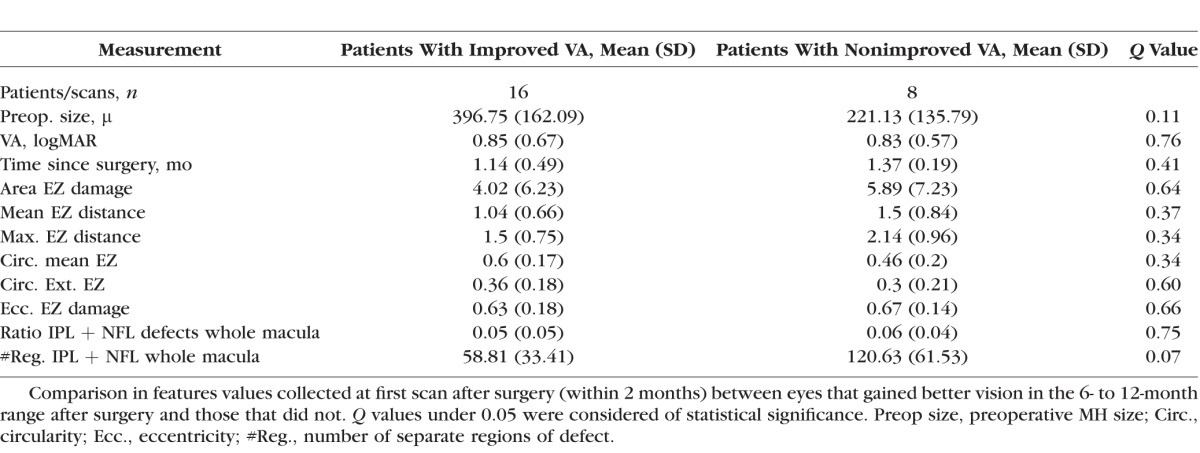
Figure 5.
Mean feature values and comparison (Q values) collected at first scan after surgery (within 2 months) between eyes that gained better vision in the 6- to 12-month range after surgery and eyes that did not. Mean feature values are displayed within their associated region in the blue-colored maps, with locations as indicated previously in Figure 2B and Figure 3. Statistically significant Q values (<0.05) are displayed in white.
Discussion
In this work, we analyzed inner retina and EZ band defect characteristics in patients recovering from MH repair surgery as observed in SD-OCT images. This method is advantageous over previous studies,23–30 since automated three-dimensional analysis allowed us to quantitatively assess the entire macula in a topographic view, instead of in singular horizontal or vertical cross-sectional scans where some defects would be hard to visualize or may not even be displayed.
Our analysis revealed that eyes that recently underwent MH repair surgery not only present defects in the EZ band, but also show obvious damage in the inner retina layers when compared to the nonsurgical fellow eyes. Postsurgical inner retina thinning was more pronounced in the temporal region (Fig. 3). The thinning “dimple”' in the inner retina and foveal displacement toward the optic disc caused by surgical ILM peeling36 might be responsible for the thinning seen in the temporal region and slight thickening on part of the nasal and inferior regions. Table 2 and Figure 4 demonstrate that most of the extracted features for both the EZ band and the IPL + NFL defect zones presented statistically significant differences between surgical and nonsurgical fellow eyes. While differences in the EZ band features are expected as photoreceptor recovery after surgery is a slow process, differences in the IPL + NFL features highlight the possible damage to the inner retina from the surgical process. In fact, we can observe that while some of the EZ band defect features resolve from a mean of 1.17 months (in the column labeled as within 2 months after surgery in Table 2 and in Fig. 4) to a mean of 8.98 months after surgery (in the column labeled as 6–12 months after surgery in Table 2 and in Fig. 4), the IPL + NFL features do not recover. This finding corroborates that surgical alterations to the inner retina from MH repair do not rapidly recover after surgery, agreeing with previous studies where such alterations were observed in cross-sectional scans long after the EZ band region had partially or completely recovered.32–36 An example of this manifestation for a single eye can be observed in Figure 1: While we can observe an obvious decrease of the extent of the EZ defect region from approximately 1 month to 5 months, and then to 17 months after surgery, no obvious decrease can be observed for the inner retina damage regions from 1 to 5 months after surgery, and only a slight decrease can be observed at 17 months after surgery.
We also analyzed the correlation of each of the extracted features with VA for all postsurgical scans included in the study. Eleven of these features presented modest to moderate significant correlation values (P < 0.01) (Fig. A3). Stronger association with VA was observed for the EZ defect ratio in the fovea region (cc = 0.46) and the EZ defect ratio in the temporal inner region (cc = 0.45). These findings corroborate the assumption that the photoreceptors in the central macula regions are the most responsible for VA, especially those at the fovea center.45 While such correlation also agrees with previous work,22–26 it differs from other work, where no correlation of EZ band defect radius with VA was detected.27–30 However, the radii measurements made by hand in these later studies were prone to user interpretations or failure to detect the actual length in a singular cross-section. Conversely, our methods were automatic and able to analyze defects topographically. Considering the features related to IPL + NFL defects, only the number or detected separate regions in the temporal outer region showed significant, though modest, correlation with VA (cc = 0.29).
No significant correlation with VA was found when analyzing scans within 2 months after surgery (30 patients considered). This lack of significance may be due to the limited number of patients considered. However, five of the extracted features showed strong to very strong statistically significant correlation when considering a time within 6 to 12 months after surgery (16 patients considered), all related to defects in the EZ band zone (Fig. A4). The strongest correlation was observed for the ratio of damage in the temporal inner region (cc = 0.9) with the fovea and inferior inner regions also showing high correlation (cc = 0.75 and cc = 0.7, respectively). The maximum and the mean EZ damage distances also showed significant correlation (with cc = 0.68 for both features). These results were expected, since eyes with restored photoreceptors in the inner macula regions—presenting a lower ratio of damage in such regions and lower maximum and mean EZ defect distances—should have better vision. The findings on EZ band damage distances also agree with a previous publication.22 Here, we obtained a similar, but slightly higher, correlation value than the previous work (0.68 vs. 0.62), and also higher than in other publications considering similar time ranges after surgery.23,24 Once again, lower correlation observed in prior studies may be an effect of the limitations derived from making manual annotations in single cross-sectional images.
One of the main questions that drove this investigation was why some patients have poor visual outcomes despite seemingly successful surgery. We studied the relationship of the features measured shortly after surgery (mean 1.22 months) with the degree of recovery of VA in the future (mean 7.68 months) by analyzing the feature differences between eyes that improved their vision and eyes that did not. As indicated in Table 3, both groups had similar measured VA in their exam after surgery. Macular hole size before surgery was also similar for both groups, showing no statistically significant differences between both groups. This lack of statistical significance contradicts prior assumptions indicating that larger preoperative MH sizes are a prognostic factor for poor vision recovery,7 but may be due to a low sample size in our study. In fact, the patients included in this work whose vision improved presented on average larger preoperative holes than those patients whose vision did not improve. Figure 5 shows that only the number of IPL + NFL separate defect regions in the superior outer region showed statistical significant differences between the two groups, with higher values for eyes that did not recover. A higher more extensive rate of damage in the form of “dimples” in the superior outer IPL + NFL region after surgery may be an indicator of slower or nonexistent visual recovery, contradicting previous studies where no predictive value of visual recovery was found for similar inner retinal defects.28 However, previous analyses were limited to listing those eyes where a NFL “dipping” defect could be seen in a cross-sectional image across the fovea. Apart from subjective considerations when making such annotations, defects extending to the superior quadrant, which seem to have the most influence in future vision recovery, were not displayed or analyzed in such cross-sectional images.
The main limitations of this work are the number of patients analyzed and the inconsistency between clinic visits both between the patients and within each patient. The data presented here were collected from clinical practice, so there was no uniform protocol directing patient clinic visits. A prospective study coordinating patient visits after surgery for a larger number of patients is needed and will be addressed in future work. The automated segmentation tools also give us the power to analyze possible defects in other layers than the ones included in this work, an analysis that we also plan to explore in the future.
In conclusion, this study shows that there is significant correlation between the EZ band defect features in the fovea and regions surrounding the fovea with postoperative VA outcomes. In a range between 6 and 12 months after surgery, EZ band defects located in the fovea, the temporal-inner, the inferior-inner, the extent of those defects from the center of the fovea, and their circularity correlated with VA. However, no such correlation was found in a 2-month range after surgery. On the other hand, defects located in the inner retina, likely attributed to ILM staining or surgical trauma, do not correlate with the current VA. However, those patients who had a larger number of thinning “dimples” in the inner retina extending to the superior outer quadrant had worse visual outcome. In practice, minimizing inner retina damage may be of critical importance when evaluating different surgical techniques for MH closure.
Acknowledgments
Supported by a grant from the Bio-X Interdisciplinary Initiatives Program of Stanford University, and the Spectrum-Stanford Predictives and Diagnostics Accelerator (SPADA) innovation grant of Stanford University. Spectrum-SPADA is part of the Clinical and Translational Science Award (CTSA) program, funded by the National Center for Advancing Translational Sciences (Grant UL1 TR001085) at the National Institutes of Health (NIH). The funding organizations had no role in the design or conduct of this research. The authors alone are responsible for the content and writing of the paper.
Disclosure: L. de Sisternes, None; J. Hu, None; D.L. Rubin, None; T. Leng, None
Appendix
EZ Band Defect Segmentation
The process followed for the automated segmentation of EZ band defect regions is outlined in Figure A1. We employed both the EZ band thickness and EZ band brightness topographic maps (labeled as 1 and 2 in Fig. A1, respectively) to assess EZ band integrity, considering locations with abnormally low thickness values or a significant decrease in intensity throughout the brightness map.
Figure A1.
Diagram of the process employed in the EZ band defect segmentation.
The EZ band thickness map is compared on a pixel-by-pixel basis to a threshold map obtained from processing a set of healthy patients. This healthy eye set consisted of 63 SD-OCT scans from 28 healthy eyes in 17 patients, collected to match the age and follow-up time of the patients studied here: Patients in the study had a mean age of 67.67 years (SD 12.71) at the time of surgery and were observed for a mean 14.01 months; patients in the control set had a mean age of 65.18 years (SD 5.76) at the time of their first scan and were observed for a mean 13.97 months; age differences between the two groups showed no significant differences (t-test P value = 0.52). The threshold map is obtained by computing the average −2 SD EZ band thickness values at each pixel location from the scans in the control set, previously aligned so that the same macular locations correspond to the same pixel locations. Pixels with values under the threshold map are marked as possible candidate locations of EZ band defects (thickness map segmentation, labeled as 3 in Fig. A1).
Regions of significant decrease of brightness are determined by analyzing a histogram of the values within the brightness map (shown in Fig. A1). We fitted two Gaussian curves to the distribution of such values and analyzed the statistical significance of the differences between them via Mann-Whitney U-test for equal medians. In case differences are statistically significant, a threshold is established at the mean −2 SDs from the higher-valued distribution, and values in the brightness maps under such threshold are marked as possible candidate locations of EZ band defects (brightness segmentation, labeled as 4 in Fig. A1). The rationale behind this method is that in the case where no apparent decrease of reflectivity can be observed throughout the image, the distribution of brightness values would resemble a single Gaussian distribution, equivalent to two Gaussian curves with similar means, while in the opposite case we expect to observe two clearly distinguished Gaussian curves when analyzing such distribution.
Both the thickness and brightness map segmentation were equally considered in order to generate a composite segmentation, formed by regions marked on either of these maps (labeled as 5 in Fig. A1). This composite segmentation was later refined by image processing tools to eliminate possible erroneously included blood vessels and noise. Particularly, we eliminated separated regions that were outside a circle of 3 mm radius centered at the fovea center, followed by a morphological operation of opening with a circular kernel of 50 μm radius (to eliminate isolated small regions) and by dilation with a circular kernel of 20 μm radius (to further smooth region edges). The result is a refined segmentation (EZ band defect segmentation, labeled as 6 in Fig. A1) where the regions of EZ band defects can be identified.
IPL + NFL Defect Segmentation
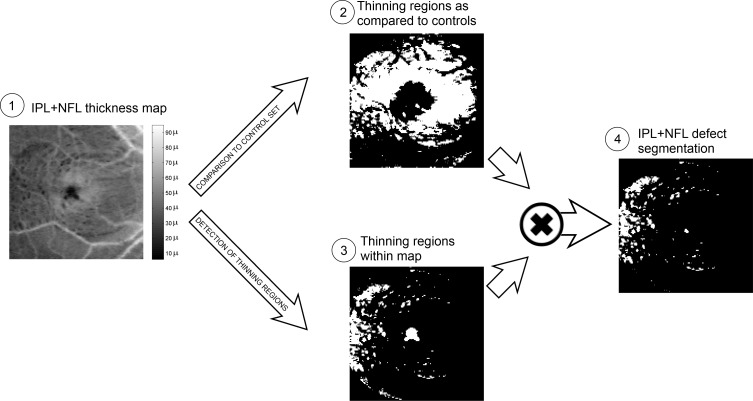
The process followed for the automated segmentation of IPL + NFL defect regions is outlined in Figure A2. The topographic IPL + NFL thickness maps (labeled as 1 in Fig. A2) were used in two separate processes. Regions of thinning, as compared to healthy cases, were determined in a similar manner as done for the EZ thickness maps—this time comparing to a threshold determined by the average −2 SD IPL + NFL thickness observed in the controls (labeled as 2 in Fig. A2). Additionally, regions of relative thinning within the topographic map were outlined by selecting those regions with values in the lower 5% of a Gaussian distribution fitted to the values recorded in the map (labeled as 3 in Fig. A2). Regions marked both as substantially thinner than the controls and within the map constitute the segmentation of the IPL + NFL defects (labeled as 4 in Fig. A2).
Figure A2.
Diagram of the process employed in the IPL + NFL defect segmentation.
Feature Correlation With VA After Surgery Considering All Longitudinal Data
Figure A3 shows the values of the features (horizontal axes) that presented significant correlation with the measured corresponding logMAR VA (vertical axes) considering all postsurgical clinic visits. The corresponding correlation coefficient values are also indicated in the figure.
Figure A3.
Features values (horizontal axes) that showed significant correlation with the corresponding logMAR VA (vertical axes) after considering all patient clinic visits. The corresponding correlation coefficient values are indicated in a box on the top right corner of each graph.
Feature Correlation With VA After Surgery Considering All Longitudinal Data
Figure A4 shows the values of the features (horizontal axes) that presented significant correlation with corresponding logMAR VA (vertical axes) considering a single measurement per patient at a scan acquired at the time of best VA in the range between 6 and 12 months after surgery. The corresponding correlation coefficient values are also indicated in the figure.
Figure A4.
Feature values (horizontal axes) that showed significant correlation with the corresponding logMAR VA (vertical axes) considering a singular exam for each patient, with the best VA acquired between 6 and 12 months after surgery. The corresponding correlation coefficient values are indicated in a box on the bottom right corner of each graph.
References
- 1. Huang D,, Swanson EA,, Lin CP,, et al. Optical coherence tomography. Science. 1991; 254: 1178–8111. [DOI] [PMC free article] [PubMed] [Google Scholar]
- 2. De Niro JE,, McDonald HR,, Johnson RN,, et al. Sensitivity of fluid detection in patients with neovascular AMD using spectral domain optical coherence tomography high-definition line scans. Retina. 2014; 34: 1163–6611. [DOI] [PubMed] [Google Scholar]
- 3. Shuang L,, Wang B,, Yin B,, et al. Retinal nerve fiber layer reflectance for early glaucoma diagnosis. J Glaucoma. 2014; 23: e45–52e. [DOI] [PMC free article] [PubMed] [Google Scholar]
- 4. Akashi A,, Kanamori A,, Nakamura M,, et al. The ability of macular parameters and circumpapillary retinal nerve fiber layer by three SD-OCT instruments to diagnose highly myopic glaucoma. Invest Ophthalmol Vis Sci. 2013; 54: 6025–3260. [DOI] [PubMed] [Google Scholar]
- 5. Talu SD. Optical coherence tomography in the diagnosis and monitoring of retinal diseases. ISRN Biomed Imaging. 2013; 2013: 1–13. [Google Scholar]
- 6. Xu D,, Yuan A,, Kaise PK,, et al. A novel segmentation algorithm for volumetric analysis of macular hole boundaries identified with optical coherence tomography. Invest Ophthalmol Vis Sci. 2013; 54: 163–916. [DOI] [PubMed] [Google Scholar]
- 7. Ullrich S,, Haritoglou C,, Gass C,, Schaumberger M,, Ulbig MW,, Kampik A. Macular hole size as a prognostic factor in macular hole surgery. Br J Ophthalmol. 2002; 86: 390–339. [DOI] [PMC free article] [PubMed] [Google Scholar]
- 8. Goldberg RA,, Waheed NK,, Duker JS. Optical coherence tomography in the preoperative and postoperative management of macular hole and epiretinal membrane. Br J Ophthalmol. 2014; 98 (suppl 2):ii20–ii23. [DOI] [PMC free article] [PubMed] [Google Scholar]
- 9. Ehlers JP,, Xu D,, Kaiser PK,, Singh RP,, Srivastava SK. An assessment of surgery-induced ultrastructural alterations with intraoperative optical coherence tomography. Retina. 2014; 34: 213–212. [DOI] [PubMed] [Google Scholar]
- 10. Dayani PN,, Maldonado R,, Farsiu S,, Toth CA. Intraoperative use of handheld spectral domain optical coherence tomography imaging in macular surgery. Retina. 2009; 29: 1457–6814. [DOI] [PMC free article] [PubMed] [Google Scholar]
- 11. Lee SY,, Stetson PF,, Ruiz-Garcia H,, Heussen FM,, Sadda SR. Automated characterization of pigment epithelial detachment by optical coherence tomography. Invest Ophthalmol Vis Sci. 2012; 53: 164–701. [DOI] [PubMed] [Google Scholar]
- 12. Chiu SJ,, Xiao TL,, Nicholas P,, Toth CA,, Izatt JA,, Farsiu S. Automatic segmentation of seven retinal layers in SDOCT images congruent with expert manual segmentation. Opt Express. 2010; 18: 19413–28194. [DOI] [PMC free article] [PubMed] [Google Scholar]
- 13. Garvin MK,, Abramoff MD,, Wu X,, Russell SR,, Burns TL,, Sonka M. Automated 3-D intraretinal layer segmentation of macular spectral-domain optical coherence tomography images. Trans Med Imaging. 2009; 28: 1436–4714. [DOI] [PMC free article] [PubMed] [Google Scholar]
- 14. Quellec G,, Lee K,, Dolejsi M,, Garvin MK,, Abramoff MD,, Sonka M. Three-dimensional analysis of retinal layer texture: identification of fluid-filled regions in SD-OCT of the macula. Trans Med Imaging. 2010; 29: 1321–3013. [DOI] [PMC free article] [PubMed] [Google Scholar]
- 15. Ehnes A,, Wenner Y,, Friedburg C,, et al. Optical coherence tomography (OCT) device independent intraretinal layer segmentation. Transl Vis Sci Technol. 2014; 3 (1): 1–16. [DOI] [PMC free article] [PubMed] [Google Scholar]
- 16. Ishikawa H,, Jongsick K,, Friberg TR,, et al. Three-dimensional optical coherence tomography (3D-OCT) image enhancement with segmentation-free contour modeling C-mode. Invest Ophthalmol Vis Sci. 2009; 50: 1344–4913. [DOI] [PMC free article] [PubMed] [Google Scholar]
- 17. Jain N,, Farsiu S,, Khanifar AA,, et al. Quantitative comparison of drusen segmented on SD-OCT versus drusen delineated on color fundus photographs. Invest Ophthalmol Vis Sci. 2010; 51: 4875–8348. [DOI] [PMC free article] [PubMed] [Google Scholar]
- 18. Kafieh R,, Rabbani H,, Abamoff MD,, Sonka M. Intra-retinal layer segmentation of 3D optical coherence tomography using coarse grained diffusion map. Med Image Anal. 2013; 17: 907–289. [DOI] [PMC free article] [PubMed] [Google Scholar]
- 19. Mayer MA,, Hornegger J,, Mardin CY,, Tornow RP. Retinal nerve fiber layer segmentation on FD-OCT scans of normal subjects and glaucoma patients. Biomed Opt Express. 2010; 1: 1358–8313. [DOI] [PMC free article] [PubMed] [Google Scholar]
- 20. Mujat M,, Raymond CC,, Cense B,, et al. Retinal nerve fiber layer thickness map determined from optical coherence tomography images. Opt Express. 2005; 13: 9480–9194. [DOI] [PubMed] [Google Scholar]
- 21. de Sisternes L,, Simon N,, Tibshirani R,, Leng T,, Rubin DL. Quantitative SD-OCT imaging biomarkers as indicators of age-related macular degeneration progression. Invest Ophthalmol Vis Sci. 2014; 55: 7093–1037. [DOI] [PubMed] [Google Scholar]
- 22. Oh J,, Smiddy WE,, Flynn HW Jr,, Gregori G,, Lujan B, Photoreceptor inner/outer segment defect imaging by spectral domain OCT and visual prognosis after macular hole surgery. Invest Ophthalmol Vis Sci. 2010; 51: 1651–1658. [DOI] [PubMed] [Google Scholar]
- 23. Inoue M,, Watanabe Y,, Arakawa A,, Sato S,, Kobayashi S,, Kadonosono K. Spectral-domain optical coherence tomography images of inner/outer segment junctions and macular hole surgery outcomes. Graefes Arch Clin Exp Ophthalmol. 2009; 247: 325–303. [DOI] [PubMed] [Google Scholar]
- 24. Ooka E,, Mitamura Y,, Baba T,, Kitahashi M,, Oshitari T,, Yamamoto S. Foveal microstructure on spectral-domain optical coherence tomographic images and visual function after macular hole surgery. Am J Ophthalmol. 2011; 152: 283–902. [DOI] [PubMed] [Google Scholar]
- 25. Sano M,, Shimoda Y,, Hashimoto H,, Kishi S. Restored photoreceptor outer segment and visual recovery after macular hole closure. Am J Ophthalmol. 2009; 147: 313–831. [DOI] [PubMed] [Google Scholar]
- 26. Shimozono M,, Oishi A,, Hata M,, Kurimoto Y. Restoration of the photoreceptor outer segment and visual outcomes after macular hole closure: spectral-domain optical coherence tomography analysis. Graefes Arch Clin Exp Ophthalmol. 2011; 249: 1469–7614. [DOI] [PubMed] [Google Scholar]
- 27. Kao TY,, Yang CM,, Yeh PT,, Huang JY,, Yang CH. The value of combining autofluorescence and optical coherence tomography in predicting the visual prognosis of sealed macular holes. Am J Ophthalmol. 2013; 156: 149–561. [DOI] [PubMed] [Google Scholar]
- 28. Wakabayashi T,, Fujiwara M,, Sakaguchi H,, Kusaka S,, Oshima Y. Foveal microstructure and visual acuity in surgically closed macular holes: spectral-domain optical coherence tomographic analysis. Ophthalmology. 2010; 117: 1815–2418. [DOI] [PubMed] [Google Scholar]
- 29. Chang LK,, Koizumi H,, Spaide RF. Disruption of the photoreceptor inner segment-outer segment junction in eyes with macular holes. Retina. 2008; 28: 969–759. [DOI] [PubMed] [Google Scholar]
- 30. Itoh Y,, Inoue M,, Rii T,, Hiraoka T,, Hirakata A. Correlation between length of foveal cone outer segment tips line defect and visual acuity after macular hole closure. Ophthalmology. 2012; 119: 1438–4614. [DOI] [PubMed] [Google Scholar]
- 31. Christensen UC,, Krøyer K,, Sander B,, Larsen M,, la Cour M. Prognostic significance of delayed structural recovery after macular hole surgery. Ophthalmology. 2009; 116: 2430–6243. [DOI] [PubMed] [Google Scholar]
- 32. Hutton WL,, Fuller DG,, Snyder WB,, Fellman RL,, Swanson WH. Visual field defects after macular hole surgery. A new finding. Ophthalmology. 1996; 103: 2152–8215. [DOI] [PubMed] [Google Scholar]
- 33. Chin EK,, Almeida DR,, Sohn EH. Structural and functional changes after macular hole surgery: a review. Int Ophthalmol Clin. 2014; 54: 17–27. [DOI] [PubMed] [Google Scholar]
- 34. Baba T,, Yamamoto S,, Kimoto R,, Oshitari T,, Sato E. Reduction of thickness of ganglion cell complex after internal limiting membrane peeling during vitrectomy for idiopathic macular hole. Eye. 2012; 26: 1173–8011. [DOI] [PMC free article] [PubMed] [Google Scholar]
- 35. Ko TH,, Witkin AJ,, Fujimoto JG,, et al. Ultrahigh-resolution optical coherence tomography of surgically closed macular holes. Arch Ophthalmol. 2006; 124: 827–368. [DOI] [PMC free article] [PubMed] [Google Scholar]
- 36. Sabater AL,, Velázquez-Villoria A,, Zapata MA,, et al. Evaluation of macular retinal ganglion cell-inner plexiform layer thickness after vitrectomy with internal limiting membrane peeling for idiopathic macular holes. BioMed Res Internat. 2014; 458631. [DOI] [PMC free article] [PubMed]
- 37. de Sisternes L,, Hu J,, Rubin DL,, Marmor M. Localization of damage in progressive hydroxychloroquine retinopathy on and off the drug: inner versus outer retina, parafovea versus peripheral fovea. Invest Ophthalmol Vis Sci. 2015; 56: 3415–3426. [DOI] [PMC free article] [PubMed] [Google Scholar]
- 38. Rubin DL,, de Sisternes L,, Kutzscher L,, Chen Q,, Leng T,, Zheng LL. Quantitative evaluation of drusen on photographs. Ophthalmology. 2013; 120: 644–644.e2. [DOI] [PMC free article] [PubMed] [Google Scholar]
- 39. Chen Q,, Leng T,, Zheng LL,, Kutzscher L,, de Sisternes L,, Rubin DL. An improved optical coherence tomography-derived fundus projection image for drusen visualization. Retina. 2014; 34: 996–1005. [DOI] [PubMed] [Google Scholar]
- 40. Chen Q,, Leng T,, Niu S,, Shi J,, de Sisternes L,, Rubin DL. A false color fusion strategy for drusen and geographic atrophy visualization in optical coherence tomography images. Retina. 2014; 34: 2346–5823. [DOI] [PMC free article] [PubMed] [Google Scholar]
- 41. Fitzmaurice GM,, Laird NM,, James H,, Ware JH. Applied Longitudinal Analysis. Hoboken, NJ: John Wiley & Sons, Inc.; 2004: 326–283. [Google Scholar]
- 42. Storey JD. A direct approach to false discovery rates. J Royal Stat Soc. 2002; 64: 479–984. [Google Scholar]
- 43. Storey JD,, Tibshirani R. Statistical significance for genomewide studies. Proc Nat Acad Sci. 2003; 100: 9440–5944. [DOI] [PMC free article] [PubMed] [Google Scholar]
- 44. Pearson K. Notes on regression and inheritance in the case of two parents. Proc R Soc Lond. 1895; 58: 240–224. [Google Scholar]
- 45. Hansen S,, Batson S,, Weinlander KM,, et al. Assessing photoreceptor structure after macular hole closure. Retin Cases Brief Rep. 2015; 9: 15–20. [DOI] [PMC free article] [PubMed] [Google Scholar]


