

Abstract
Fewer than half of all tandem mass spectrometry (MS/MS) spectra acquired in shotgun proteomics experiments are typically matched to a peptide with high confidence. Here we determine the identity of unassigned peptides using an ultra-tolerant Sequest database search that allows peptide matching even with modifications of unknown masses up to ±500 Da. In a proteome-wide dataset on HEK293 cells (9,513 proteins and 396,736 peptides), this approach matched an additional 184,000 modified peptides, which were linked to biological and chemical modifications representing 523 distinct mass bins, including phosphorylation, glycosylation, and methylation. We localized all unknown modification masses to specific regions within a peptide. Known modifications were assigned to the correct amino acids with frequencies often >90%. We conclude that at least one third of unassigned spectra arise from peptides with substoichiometric modifications.
Shotgun proteomics is the leading technology for rapidly cataloging protein expression. In this approach, large numbers of tandem mass spectra are collected and matched to their corresponding peptides, which are mapped to their source proteins1,2 The method starts with mass analysis of intact peptides (precursor ions) generated by enzymatic digestion of proteins, followed by fragmentation of the peptides and subsequent mass analysis of the generated fragments (fragment or product ions). Peptide sequences are assigned by correlating in silico–predicted spectra with those acquired by MS/MS, using database searching algorithms such as Sequest and Mascot3,4. Several recent publications have detailed the detection of >10,000 proteins from human cell lines5–7. The en masse identification of proteins in these experiments results from the matching of hundreds of thousands of peptides measured in a million or more individual MS/MS spectra. However, the majority of MS/MS spectra acquired in shotgun proteomics experiments are never successfully matched to a peptide. The nature of these unmatched spectra has been the focus of intense research and speculation. Even a cursory examination leads to the conclusion that most unmatched spectra are of reasonable quality and peptidic in nature. Many publications have partially addressed the question of unmatched spectra by using mass tags8–10 or de novo sequencing11,12 or a combination of both13–15 to identify spectra. In an iterative approach, de novo–generated mass tags are used to identify candidate peptides that are tested for multiple modifications or amino acid (AA) substitutions16. Alternatively, error-tolerant searches test known modifications by dynamically searching each unexplained spectrum17. Finally, modified spectra can be assigned in an unbiased way by correlating them with spectra identified from unmodified peptides or even other spectra using algorithms such as MS-Alignment18 and ModifiComb19.
Many of the unexplained spectra may originate in unexpected post-translational modifications (PTMs). One report postulated that for every peptide present after digestion, 8–12 modified forms of that peptide are created22. Common chemical modifications to amino acids are typically generated after lysis and include oxidation, carbamoylation, and formylation. After appropriate enrichment, selected PTMs have been identified on proteome-wide scales including phosphorylation20, glycosylation21, acetylation22, ubiquitylation23 and ADP-ribosylation24. Another potential source of unmatched spectra in proteomics datasets, although more rare than PTMs, is AA variants not present in databases, which arise from sources such as sequencing errors and polymorphisms. Polymorphisms may lead to protein malfunction, incorrect folding, degradation and altered signal transduction pathways, and have been investigated using next-generation sequencing25,26, de novo sequencing algorithms27 and variant peptide databases8,28
Recent advancements in instrumentation should facilitate the study of unmatched spectra. These include the routine determination of intact peptide molecular masses with very high mass accuracy (approaching sub-PPM) and improved acquisition rates for MS/MS spectra29–31. Furthermore, the high resolution achieved by instruments such as the Orbitrap now routinely extends to fragmentation (MS/MS) spectra32. We posit that these very accurate MS/MS spectra might allow for wide-tolerance precursor searches to detect modifications of <1000 Da in an unbiased manner for bottom-up proteomics. Indeed, large precursor searches have been used to target unmatched spectra in both top-down and middle-down experiments33. For example, using the proSightHT algorithm, a second search on the subset of unmatched MS/MS spectra with a +/− 200 Da tolerance has been performed33.
To investigate the source of unassigned spectra in shotgun proteomics, we used a wide-tolerance Sequest search that en masse identified hundreds of modifications in HEK293 cells. A 500-Da Sequest search of a shotgun sequencing dataset of spectra from HEK293 cells identified an additional 184,000 modified peptides. The complete list of identified peptides, their hyperlinked annotated spectra, and their respective Δmasses are provided as a resource for the proteomics community. The Open search approach was able to identify known chemical and biological modifications, and with Ascore localization34 the modification position could be localized to specific amino acid regions within the peptides. These data demonstrate that modified peptides are responsible for a large fraction of unassigned spectra in shotgun proteomics.
Results
A 500-Da precursor ion window can detect modified peptides
Before investigating unassigned mass spectra, we first evaluated the Unimod.org database for known chemical and biological modifications with addition of all potential AA substitutions (n=633). The Δmass distribution shows that 93% of these modifications and substitutions shift a peptide’s mass by <500 Da (Fig. 1A). We posited that vastly increasing the precursor ion tolerance (referred to as an “Open search”) during spectral assignment would be a viable option for identification of unassigned spectra. Importantly, the fragment ion tolerance in these Open searches would necessarily remain very narrow (0.01 Da) for accurate matching. Mouse brain lysate was proteolyzed and analyzed in triplicate by LC-MS2. MS2 spectra were searched against the mouse database using precursor ion tolerance values ranging from low ppm range to 1000 Daltons. Each search was compared back to a narrow-tolerance search of ±5 ppm (~0.005 Da) to determine the percent recovery of peptide identifications. 86% and 79% of peptides were identical to the high mass accuracy search when a 500 Da or 1000 Da Open searches were used, respectively (Fig. 1B). To simulate the performance of lower resolution MS2 instrumentation, additional searches were performed with differing fragment ion tolerances which resulted in reduced recoveries (Supplementary Figure 1). Based on the potential to re-match unmodified peptides, we hypothesized that modified peptides could also be assigned back to their correct sequence provided sufficient numbers of matching fragment ions.
Figure 1. A very wide precursor ion (Open) search setting identified ~185,000 modified peptides.
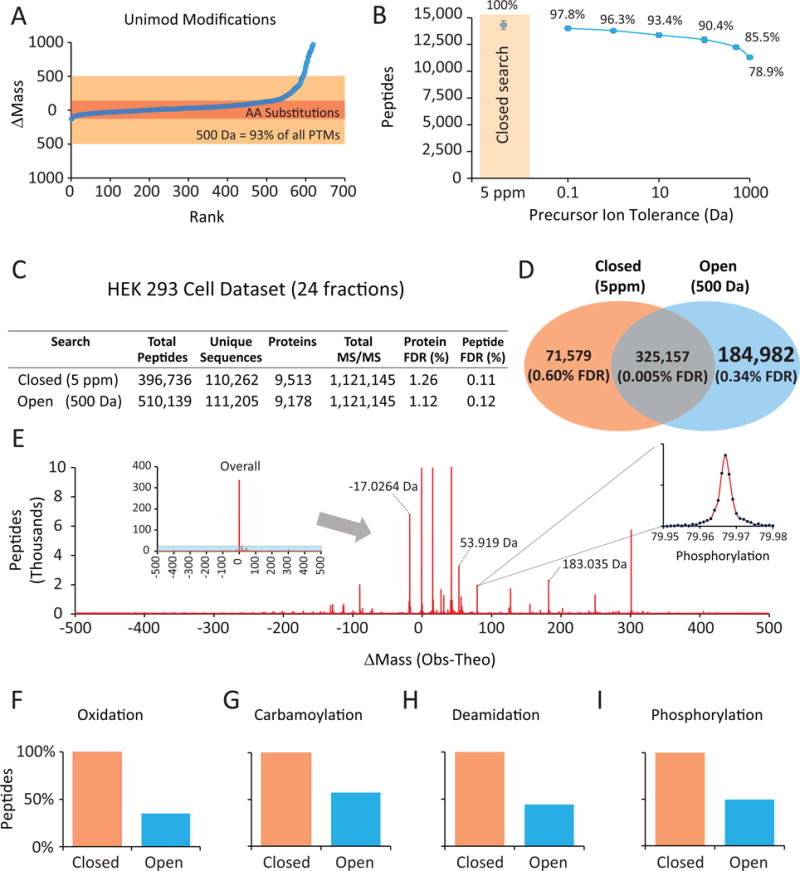
A) Most Unimod.org-reported modifications change precursor masses by < 500 Da. B) The vast majority of unmodified peptides are re-identified from Open searches. MS/MS spectra from mouse brain peptides analyzed in triplicate were searched using the Sequest algorithm and varying only the precursor ion tolerance. Note that fragment ion tolerance remained very strict (0.01 Da). At ±500 Da, 86% of unmodified peptides matched from an accurate mass search (5 ppm or ~.005 Da) were still assigned at a 1% FDR. C) A proteome-wide dataset was collected by LC-MS/MS from trypsinized and fractionated HEK293 cell lysate and assessed through either an Open or Closed search. D) The Open search identified more than 184,000 peptides with modified ΔM (mass change) values between −500 and +500 Da. E) ΔM distribution for 510,139 peptides. In addition to the 325,157 unmodified peptides, the 184,982 modified peptides distributed based on the exact net mass change of their modification. The inset shows a zoomed in view of ~2000 phosphorylated peptides. F–I) Comparison of identical modified peptides matched using a directed Closed search (where the modification was specified as differential) with an Open (±500-Da) search for four known peptide modifications: oxidation, carbamoylation, phosphorylation and deamidation.
To test our hypothesis, we collected a proteome-wide dataset from a human cell line. HEK293 cells were lysed, trypsinized, separated into 24 fractions and analyzed by LC-MS/MS techniques using 3-hr gradients. High resolution and high mass accuracy MS/MS spectra were collected. The spectra were first searched allowing only peptides with masses matching within 5 ppm (~0.005 Da) to be considered (referred to as a “Closed search”). In total, 396,736 peptides were identified from 9,513 proteins from 293 cells with a strict false positive rate (protein level) of 1% (Fig. 1C, Supplementary Table 1). The spectra were then searched using an Open (±500 Da) search so as to identify as many spectra as possible. A large increase in peptide identifications was observed using the Open search (510,139 total peptides from 9,178 proteins) (Supplementary Table 2). Furthermore, the Closed and Open searches shared 325,157 peptides between them (Fig. 1D). Over 184,000 peptides were only matched with high confidence (FDR = 0.31%) using the Open search approach. The loss of 18% (71,579) of detected unmodified peptides when using the Open search is consistent with initial analyses on whole cell lysates (Fig. 1B) where 14% were not recovered likely due to the much wider search space. The additional Open-search matches distributed based on the exact net mass change of the corresponding chemical or biological modification (Fig. 1E). Discrete mass bins were observed as Gaussian peaks as demonstrated by the +79.9663 Da bin (phosphorylation).
The target-decoy database approach (TDA) provides accurate estimates of false discovery rates in proteomics experiments. While an Open search necessarily considers many fold more peptides, none of the assumptions underlying TDA appear to be violated35. For example, Supplementary Figure 2 shows that false positives (random matches) choose equally between forward and reversed sequences in an Open search. Overall, the estimated FDR for the ~185,000 modified peptides was 0.3% (625 decoy matches).
Guassian fit analysis determined that 523 discreet Δmass bins with at least 20 member peptides/bin were observed with 98% of peptides assigned to a distinct bin. These included 289 positive and 234 negative Δmass bins (Supplementary Table 3). By far, the largest single peak was centered at 0.00 and represented unmodified peptides. A direct comparison of the Open and Closed search strategies for specific modifications revealed that 50% or fewer of possible modified peptides were recovered for each modification with the Open search (Fig. 1F–I).
To further examine the sensitivity of the Open search, we re-searched the 1.2M spectra using a Closed search but specifying the top 15 most frequently identified modifications (three searches with 5 mods in each—Supplementary Figure 3). Similar to Figure 1F–I, the directed dynamic searches were more sensitive at detecting the specified modifications with Open searches identifying on average ~50% fewer modified peptide for any given modification. However, the Open search is more general, requiring neither ΔM nor affected amino acid specification, and 110,000 peptides harboring hundreds of mass changes were not identified with the 15-modification search.
Detection of a complex array of chemical modifications
To determine the composition of the 184,000 modified peptides within the dataset, mean values for each Δmass bin were calculated and compared to known Unimod.org database modifications. For example, 21,171 peptides (10.7%) reported a mass shift of +15.9949 Da (Fig. 2A), which is the result of oxidation of amino acids such as methionine and tryptophan. Due to averaging, the mass difference between the average Δmass value and the known modification mass were at sub-ppm accuracy. Examples of other chemical modifications included carbamoylation, deamidation, formylation, pyroglutamate/pyrocarbamoylation, and aminoethylbenzenesulfonylation (Fig. 2B–E). Furthermore, modification position could generally be pinpointed by examining the structural information present in the MS2 spectra. For example, pyroglutamate modifications are the result of a cyclization reaction of N-terminal glutamate into lactam, which influences the matching of all b-type ions in corresponding MS2 spectra. Metal ion adducts were also observed for many peptides, the most dominant being iron (Fig. 2G) with smaller contributions from sodium and calcium. Another commonly observed mass bin was assigned to misidentification of the monoisotopic peak resulting in a detected mass difference of a 12C to 13C shift (1.0034 Da, Fig. 2H). In many cases, abundant modifications were found in tandem. For example, methionine oxidation and carbamoylation were co-identified on 182 peptides at a combined Δmass of +59.001 Da.
Figure 2. Averaging many independent events provided very accurate net modification mass differences (sub-PPM).
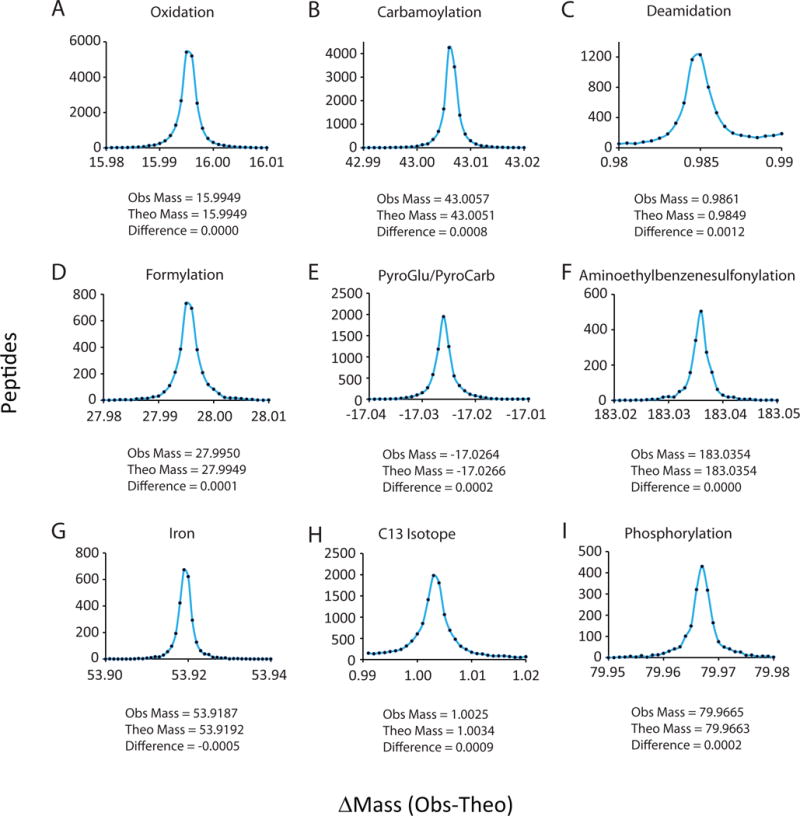
A–L) Examples of residual mass bins from Figure 1C showing the frequency of peptide identifications and the average mass difference. Bins are drawn at 0.001 Da intervals. The deduced modification is also shown.
To better understand the modification origins of peptides identified in the Open search approach, we used a modified Ascore algorithm34 to localize modifications to a specific region of amino acids within a peptide. 96,138 of the modified peptides (outside the −0.01 to 0.01 Δmass bin) had Δmass values that could be localized within each peptide with an Ascore threshold of 20 (0.01 probability). Modifications that are known to modify specific amino acids such as oxidation (Δmass of 15.9949) could be localized with high confidence to amino acids known to be oxidized such as methionine, tryptophan, proline and tyrosine in 97% of all cases. Likewise, 94% of Δmass values at 43.005 Da had carbamoylation-specific modifications located to the peptide’s N-terminus or lysine residues. Some examples are shown in Table 1 along with the predicted location of the identified modifications. For example, phosphorylation was localized to serine and threonine residues. Further examples include iodine and aminoethylbenzenesulfonylation on tyrosines; formylation was observed for serine and threonine; cysteine to cysteic acid modification was observed on cysteines; dimethylation was mostly observed on arginine residues. Some unknown modifications could be localized to specific amino acids such as a 72.005 Da modification to peptide N-terminal tryptophan residues.
Table 1.
Example modifications from the 523 ΔM bins.
| Bin Numbera | Average Δmass (Da) | Counts | Predicted modificationb | Localized Amino Acidc |
|---|---|---|---|---|
|
| ||||
| 305 | +79.967 | 1866 | Phosphorylation |
|
| 317 | +125.900 | 362 | Iodine |
|
| 333 | +183.037 | 2290 | Aminoethylbenzenesulfonylation |
|
| 264 | +27.995 | 3285 | Formylation |
|
| 299 | +72.005 | 88 | Unknown N-terminal (peptide) tryptophan |
|
| 265 | +28.032 | 244 | Dimethylation |
|
| 281 | +46.042 | 152 | Unknown cysteine modification (or 103.063 Da mod not considering alkylation) |
|
| 224 | −9.031 | 232 | Oxidation to cysteic acid |
|
| 180 | −113.087 | 437 | In-source dissociation of N-terminal Leucine or Isoleucine |
|
| 189 | −89.031 | 1934 | Cleaved N-terminal methionine + Acetylation |
|
| 170 | −131.042 | 673 | Cleaved N-terminal methionine |
|
| 276 | +42.018 | 956 | N-terminal Acetylation |
|
Guassian peak bin number associated with Supplementary tables 2 and 3.
Predicted modification based on the high resolution Δmass and known modifications.
Potential amino acid location.
Another discovered contributing factor to our Δmass bins was the presence of a type of fragmentation known as in-source dissociation (Fig. 3). It occurs when an abundant peptide partially fragments during the electrospray ionization process resulting in peptide fragments being selected for MS2 analysis. For example, Hspa8, an abundant protein, produced 48 unique peptides of which 11 were also detected with evidence of in-source dissociation (Supplementary Figure 4). Considering abundant peptide sequences (re-identified > 100 times), 50% demonstrated at least one in-source dissociation event detected by the Open search suggesting this process is common for abundant peptides. This type of peptide fragmentation was actually the cause, or a contributing factor, to the vast majority of negative Δmass values.
Figure 3. Many negative Δmass peptides are generated via in-source dissociation.
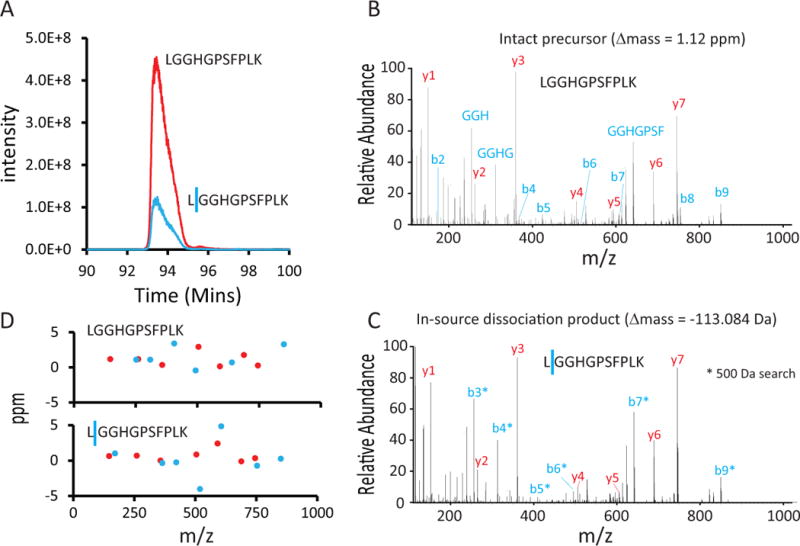
A) In-source dissociation is observed as the co-elution of two related ions, one being the precursor ion and the second being the same precursor with a mass loss due to fragmentation. These two related ions once fragmented and recorded in MS2 spectra share fragment ion masses. B) MS/MS spectrum for the intact precursor from Panel A. C) MS/MS spectrum for the in-source fragmented peptide. This peptide is only matched in the Open search. In-source dissociation events are observed in 500-Da searches as amino acid losses from one terminus of the peptide. In this example, all b-type ions (shown with an asterisk) were not matched in the 500-Da search, but nearly all y-type ions were, identifying the peptide. D) With accurate mass measurements in the MS2 scans, the fragment ions were measured at low part-per-million accuracy.
Detection of a complex array of biological modifications
Many co- and post-translational modifications (PTMs) were detected by the Open search. Phosphorylation (Fig. 2I) was the most abundant with 1866 peptides across 655 proteins (ΔM=+79.9663). Examples of abundant sites included S227 from G2bp2, S696 from Srrm1 and T205 from Pgrmc2 (Supplementary Figure 5). A total of 86 peptides with multiple sites were also observed with a Δmass value of +159.9329 Da.
Three distinct types of N-terminal processing were observed including N-terminal methionine acetylation, N-terminal methionine cleavage and methionine cleavage followed by acetylation (Supplementary Figure 6). In total, the N-terminal state for 790 proteins was assigned through the Open search. These data confirm existing literature demonstrating the preferred substrates for N-terminal methionine aminopeptidase and N-terminal aminotransferases36–38 (Supplementary Figure 6). The percentage of proteins with N-terminal acetylation was 76.3%, which is consistent with reported literature37–39.
Protein glycosylation, an important post-translational modification for protein-protein interactions and cell adhesion, was identified in various forms in 293 cells. The most dominant form was N-acetylglucosamine (GlcNAc) with an average Δmass of +203.0792 Da observed for 342 peptides. Like phosphorylation, GlcNAc was also observed on peptides in multiples. Furthermore, GlcNAc modifications provided modification-specific MS2 ions corresponding to +204.0872 Da (GlcNAc + H+) and subsequent water losses (+186.0766 Da and +168.066 Da). For example, Host Cell Factor 1 (Hcf1) was identified with 11 GlcNAc modifications (Supplementary Figure 7). Moreover, glycosylation was observed in various forms, which included fucose, glucose, glucose-xylose, glucose-xylose-xylose and Glc-GlcNAc. Three notch receptors (Notch1, 2, and 3) were identified in the 293 cells containing these complex glycosylation events (Supplementary Figure 7) all present in EGF-like domains known to be important domains used for glycosylation40.
Protein mono- and di-methylation, commonly known for their roles in histone modification processes were identified in the 293 cell dataset. Methylation was most commonly observed on arginine and lysine residues. Peptide analysis revealed many sites of protein methylation and dimethylation, which correlated with a conserved RGG-rich motif known for methylation. Heterogeneous nuclear ribonucleoprotein A family members commonly showed evidence of mono- and di-methylation as represented by Hnrnpa2b1, Hnrnpa1, Hnrnpa3, Hnrnpab and Hnrnpa0. The THO complex subunit 4 (Thoc4), an arginine and glycine rich transcriptional coactivator, was identified with multiple mono and di-methylation sites including R58, R63, R196. Histone H3, a known lysine methylated protein was identified with mono-, di- and tri-methylation of K27. Furthermore, this site was also modified by acetylation (distinguishable from trimethylation by 0.0364 Da, Supplementary Figure 8). These data demonstrate the utility of an Open search approach in the characterization of a complex array of post-translational modifications important for all biological systems.
Detection of rare biological modifications and AA variants
To further demonstrate utility, the 293 cell dataset was investigated for rare but biologically important modifications. A Δmass bin with an average mass of 197.0426 Da was detected containing 114 peptides (Supplementary Table 3) all with the AA sequence, SVEMHHEALSEALPGDNVGFNVK, of Elongation factor 1a2. The modification was confirmed as glycerol phosphoryl ethanolamine at position E301, a biological modification known to modify only this elongation factor (Fig. 4A)41. The peptide was identified in the modified form at a six-fold higher rate than in the unmodified version. Further validation of the GPE modification was provided by the detection of MS2 ions specific to the addition of GPE and GPE with the loss of ethanamine (Supplementary Table 1). Elongation factor 2 was also identified with a specific modification of diphthalamide (Δmass = 142.1092 Da, Fig. 4B) at position H715, the only known protein with this type of modification42. MS2 manual inspection determined that diphthalamide produces unique fragment ions that are the result of the modification with the loss of trimethylamine (Supplementary Figure 9). Actin B can harbor a 3-methylhistidine at position H73, which was confirmed by Ascore (Fig. 4C). A notable modification was identified on Nucleophosmin (Npm1), where E136 was modified by glutamylation (Fig. 4D), which is -to our knowledge- the first demonstration of Npm1 glutamylation. The modification was also exclusively dependent on the adjacent serine (S135) being phosphorylated.
Figure 4. Analysis of ~185,000 peptides provided insights into rare biological modifications and amino acid variants/variations.
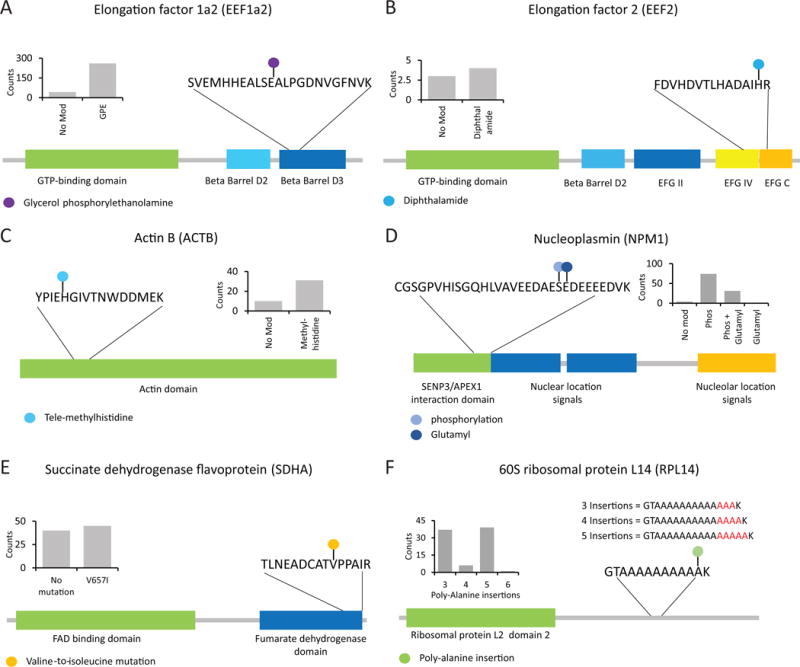
In each example, as shown in the inset, the modified form was detected more frequently than the matching unmodified peptide form. A) Glycerol phosphorylethanolamine modification of glutamate residue 301 in Elongation factor 1a2 was identified with hundreds of spectral counts. B) A diphthalamide modification was identified in position H715 for Elongation factor 2. C) A tele-methylhistidine modification was identified on cytoplasmic actin, ACTB. D) Nuceloplasmin was identified with two modifications, a phosphorylation event at S135 and glutamyl modifications at E136. The glutamylation event was only identified when phosphorylation was present giving a Δmass value of +209.0089 Da. E) One example from numerous amino acid variations identified in 293 cell Open searches. Succinate dehydrogenase with a V657I mutation is shown. F) Complex variations were also identified using the open search. For example, several alanine residues were added to the Ribosomal Protein L14 at position 159. These insertions numbered from as low as three to as many as six alanines.
We next investigated the dataset for the presence of AA variants. We found that AA substitutions could be identified through unique Δmass values and could be further validated using high resolution MS2 manual inspection. For example, the succinate dehydrogenase flavoprotein (Shda) was identified with a Δmass value of +14.0157 Da, which corresponded to a V657I (rs6962) mutation (Fig. 4E) that was confirmed by MS2 manual inspection. Methylmalonyl-CoA mutase (Mut), a protein involved in AA and fatty acid degradation, was found to harbor two specific mutations, A499T (rs2229385) and I671V (rs8589, Supplementary Figure 10). Likewise, tumor supressor 53-binding protein 1 (Tp53bp1) was identified with a known AA variant of D353E (rs560191) as observed by a Δmass shift of +14.009 Da and was localized by MS2 manual inspection (Supplementary Figure 10). An Open search was also able to identify novel mutation sites as observed for the protein Copg1, which had a +14.0161 Da Δmass and fragmentation ions suggesting a V333I mutation (Supplementary Figure 10). Notably, AA variations were also detected as a result of multiple AA insertions (Fig. 4F). The ribosomal protein L14 (Rpl14) was frequently detected via a peptide containing multiple Δmass values (+213.113 Da, +284.152 Da, +355.182 Da and +426.223 Da). These Δmass values corresponded to poly-alanine insertions with as little as three to as many as six insertions (Supplementary Figure 10). Collectively, these data demonstrate the utility of the Open search approach for the identification of rare modifications and AA variations.
Discussion
In a typical shotgun proteomics experiment hundreds of thousands MS/MS spectra are collected. Each spectrum generally records the fragmentation information for just one peptide. The sequence is assigned to the spectrum using algorithms like Sequest3 and Mascot4. The first step is to set a precursor (peptide) ion tolerance. Only peptides from the database with masses within the tolerance are passed to the algorithm for scoring. This increases algorithm sensitivity by limiting potential matches. Predicted fragment ions from these peptides are then compared to the acquired ones in the MS/MS spectrum. Decoy sequences are usually present in the database which allow for false discovery rates to be determined35. Final datasets can include hundreds of thousands of matched peptides, mapped back to as many as 10,000 proteins. But despite constant technological and analytical progress currently usually less than half of all MS/MS acquired are confidently matched to peptides.
One explanation for the low rate of positive matches is that peptides carrying modifications might be plentiful in proteome-scale experiments43 as their sequences are not considered due to the mass change of the modification. Search algorithms can dynamically accommodate several anticipated modifications, but generally not unknown modifications. Using a ±500-Da precursor ion tolerance permitted modified peptides with net mass changes of less than 500 Da to be considered as potential matches with the caveat that the peptide search space is vastly increased. We found that high resolution MS/MS spectra often supplied sufficient information to match modified peptides in Open searches. From a collection of more than 1 million MS/MS spectra derived from proteolyzed HEK293 lysate, 184,000 modified peptides were confidently identified—the largest collection assembled from a single source. Their accurate ΔM values led to 523 distinct groups. The most frequent modification was oxidation (+15.9949), yet it only represented 11% of all modified peptides. Thus, modified peptide spectra are both plentiful in number and diverse in origin.
Modifications fell into several categories including i) biological (phosphorylation, methylation, acetylation, insertions, amino acid variants, etc), ii) chemical (iron adducts, carbamoylation, etc), and iii) MS-induced apparent modifications (wrong isotope selected, electrospray induced fragmentation, etc). It is difficult to estimate category frequencies because the source for most ΔM bins we detected is not known. However, the vast majority of modifications could be localized to a specific amino acid region. For example, oxidative modifications were localized to methionine, tryptophan and proline. However, not all modifications could be localized to a specific residue due to the labile nature of the modification, producing a complete fragmentation of both b-type and y-type ions (e.g., glycosylation). In the case of certain modifications like glycerol phosphorylethanolamine and diphthalamide, the MS2 spectra provided additional structural information that was used to confirm the type of modification. For example, dipthalamide produces fragment ions that contain the exact mass of the modification less trimethylamine. The ability to discern structural information is useful for the identification of unknown modifications.
Though we identified more than 184,000 modified peptides, this is an underestimate and likely represents less than 50% of the total modified peptide spectra present in our datasets. As shown in Figure 1, the recovery for any single modification when comparing an Open to a directed Closed search for a simple modification was less than half. Likewise, directed searching for the top 15 modifications also resulted in recoveries by the Open search of less than 50%. By extrapolation, at least another 184,000 spectra are present in the dataset and correspond to still-unmatched modified peptides. Notably, this provides evidence that there are at least similar, and likely much higher, numbers of spectra in shotgun sequencing experiments collected from modified peptides than from unmodified. This finding has far-reaching consequences for proteome-wide experiments where very low abundance proteins may be missed even with extended fractionation or faster scan rates due to overwhelming numbers of modified peptides selected for MS/MS. Some combination of targeted MS/MS analysis combined with shotgun sequencing is needed to avoid selecting unproductive, modified ions from a sea of peptides while selecting those that will increase proteome coverage.
Open searches are not a replacement for Closed searches. As described, they are less sensitive than Closed searches which can be directed at a subset of anticipated modifications. However, they can be used as an alternative search option to uncover a wealth of information about proteome-scale datasets. Finally, these wide-tolerance searches could, in principle, be easily adapted to any search algorithm.
Open searches consider >1000 fold more peptides than traditional ones, and for spectra from modified peptides on average only 50% of predicted b- and y-type ions would be expected to match their surrogates from the database sequence. Fragment ions encompassing the modification site would have masses not predicted by the Sequest algorithm. Despite these substantial challenges, Open searches still identify en masse up to 50% of all modification spectra present with mass shifts of less than 500 Da. To accommodate Open searches for the proteomics community, the software package, Proteome Discoverer Ver. 2.0 includes support for wide-tolerance searches. New instrumentation and/or new methods capable of even greater mass accuracy for fragment ions could improve the sensitivity of our method. Another potential improvement for the Open search strategy would be to limit the search space to only proteins that were identified from unmodified peptides (in the case of the 293 cells that would be ~9,000). This would reduce the search space by 5 fold.
In many ways, the resource described here represents a starting point toward clarifying the unassigned-spectra enigma that is so pervasive in shotgun proteomics datasets. Undoubtedly, a large fraction of unassigned spectra correspond to modification-laden peptides. However, additional spectra remain unmatched due to other factors, and further improvements in assigning modified peptides are needed. The HEK293 proteome-scale dataset including the raw mass spectrometry files and ΔM bins are a resource that can be used to benchmark new and existing localization or modification searching algorithms. Thus, the ability to understand and apply the totality of the structural information present in MS/MS datasets is within reach.
Methods
Materials
Water and organic solvents were from J.T. Baker (Center Valley, PA). Unless otherwise noted, all other chemicals were from Sigma-Aldrich (St. Louis, MO).
Human HEK293 cell protein extraction and digestion
HEK293 cells were cultured in DMEM media. Cells were lysed in 8 M urea supplemented in 50 mM Tris (pH 8.5) and 1 × Roche protease inhibitors. The lysate was reduced with 5 mM dithiothreitol for 30 minutes at 56ºC followed by alkylation with 10 mM iodoacetamide for 30 minutes at room temperature in the dark. Reactions were quenched with 5 mM dithiothreitol for 15 minutes at room temperature in the dark. Lysates were then methanol/chloroform precipitated using 4 parts methanol, 1 part chloroform, 1 part sample and 3 parts water, all ice cold. Protein pellets were subsequently washed twice with ice cold methanol. Protein pellets from HEK293 cells were resuspended in 4 M urea, which was then digested overnight at room temperature with Lys-C (1:200 enzyme to protein ratio) followed by dilution to 1.5M urea and 4 hour digestion with trypsin (1:200 enzyme to protein ratio). Digests were then desalted using a Sep-Pak (Sep-Pak, Waters) column and dried down by vacuum centrifugation.
Mouse tissue protein extraction and digestion
The mice used in these experiments included a Mus Musculus cross (C57BL/6 × 129/sv; house mouse). Mouse brain was homogenized in 8 M urea containing 50 mM Tris (pH 8.5) and 1 × Roche protease inhibitors using an Omni TH homogenizer. Lysates were reduced with 5 mM dithiothreitol for 30 minutes at 56ºC followed by alkylation with 10 mM iodoacetamide for 30 minutes at room temperature in the dark. Reactions were quenched with 5 mM dithiothreitol for 15 minutes at room temperature in the dark. Lysates were then methanol/chloroform precipitated using 4 parts methanol, 1 part chloroform, 1 part sample and 3 parts water, all ice cold. Protein pellets were subsequently washed twice with ice cold methanol. Mouse tissue protein pellets were digested with Lys-C (1:200 enzyme to protein ratio) overnight. Digests were then desalted using a Sep-Pak (Sep-Pak, Waters) column and dried down by vacuum centrifugation.
Basic pH reverse phase fractionation
HEK293 cell peptides were separated by basic pH reverse phase fractionation that was performed on ~0.5 mg sample. Using an Agilent 1100 quaternary pump equipped with a degasser and a photodiode array (PDA) detector (set at 220 and 280-nm wavelength), a 50 min linear gradient from 5% to 35% acetonitrile in 10mM ammonium bicarbonate pH 8 at a flow rate of 0.8 mL/min with an Agilent 300 Extend C18 column (5 μm particles, 4.6 mm ID and 220 mm in length) separated the peptide mixture into a total of 96 fractions which were consolidated into 24. Samples were subsequently acidified with 1% formic acid and vacuum centrifuged to near dryness. Each fraction was desalted via StageTip, dried via vacuum centrifugation, and reconstituted in 1% formic acid for LC-MS/MS processing.
Liquid chromatography electrospray ionization tandem mass spectrometry (LC-ESI-MS/MS)
Mouse whole brain lysate peptides were analyzed by LC-ESI-MS/MS on a hybrid dual-pressure linear ion trap/orbitrap mass spectrometer (LTQ Orbitrap Elite, Thermo Scientific, San Jose, CA) equipped with a Famos autosampler (LC Packings, Sunnyvale, CA) and an Agilent 1200 binary HPLC pump (Agilent Technologies, Palo Alto, CA). Peptide mixtures were separated on a 100 μm I.D. microcapillary column packed first with ∼0.5 cm of Magic C4 resin (5 μm, 100 Å, Michrom Bioresources, Auburn, CA) followed by 20 cm of Maccel C18AQ resin (3 μm, 200 Å, Nest Group, Southborough, MA). Peptides were separated using a 3 hr gradient of 6 to 30% acetonitrile gradient in 0.125% formic acid with a flow rate of ∼300 nL/min. In each data collection cycle, one full MS scan (300–1500 m/z) was acquired in the Orbitrap (6 × 10⁴ resolution setting, automatic gain control (AGC) target of 1.5 × 10⁵) and the top 10 most abundant ions were selected for isolation and fragmentation by HCD-MS2. Ions were selected for isolation when their intensity reached a threshold of 500 counts. HCD was performed using a 2 m/z isolation window, an AGC setting of 5 × 10⁴ and a maximum ion accumulation time of 250 ms. Previously selected ions were dynamically excluded for 60 s. Normalized collision energies were set to 35% with an activation time of 2 ms for the MS2 method.
Basic pH reverse phase fractions from HEK293 cells were analyzed on a Q-Exactive Orbitrap mass spectrometer. Peptides were separated using a 3 hr gradient of 6 to 30% acetonitrile gradient in 0.125% formic acid with a flow rate of ∼300 nL/min. In each data collection cycle, one full MS scan (300–1500 m/z) was acquired in the Orbitrap (7 × 10⁴ resolution setting, automatic gain control (AGC) target of 3 × 10⁶) and the top 20 most abundant ions were selected for isolation and fragmentation by HCD. Ions were selected for isolation when their intensity reached a threshold of 500 counts. HCD was performed using a 2 m/z isolation window, a resolution of 1.75 × 10⁴, an AGC setting of 5 × 10⁵ and a maximum ion accumulation time of 60 ms. Previously selected ions were dynamically excluded for 60 s. Normalized collision energies were set to 25%.
Database Searching
Software tools were used to convert mass spectrometric data from raw file to the mzxml format20. Erroneous charge state and monoisotopic m/z values were corrected as per previous publication20. MS/MS spectra assignments were made with the Sequest algorithm3 using indexed Ensembl databases (Mouse: Mus_musculus NCBIM37.61, Human: Homo_sapiens GRCh37.61). Databases were prepared with forward and reversed sequences concatenated according to the target-decoy strategy35. All searches were performed using a static modification for cysteine alkylation (57.02146 Da).
Closed Searches
Closed searches were performed with Sequest (Rev28) using indexed databases with a precursor ion tolerance of 5 ppm. The fragment ion tolerance was set very narrow (0.01 Da). Specificity was set based on the protease used (trypsin for HEK293 studies and Lys-C for mouse studies) and allowing 1 missed cleavage. Cysteine alkylation was considered static modification (+57.021464 Da). Sequest matches were filtered by linear discriminant analysis as described previously20 first to a dataset level error of 1% at the peptide level based on matches to reversed sequences35. Peptide probabilities were then multiplied to create protein rankings and the dataset was again filtered to a final dataset level error of 1% FDR at the protein level. The final peptide-level FDR fell well below 1% (~0.2% peptide level).
Open Searches
Open searches were performed with Sequest exactly as for Closed searches with the following changes. The precursor ion tolerance was set to 500 Da unless otherwise specified. The GUI (graphical user interface) in Proteome Discoverer 2.0 allows wide-tolerance searches to be conducted. Oxidized methionine was not considered as a dynamic modification. To remove any ambiguity, spectra that were matched using a Closed search but were identified differently in the Open search were removed from the analysis and did not contribute to the final number of modified spectra. Post-search filtering via linear discriminant analysis did not use mass accuracy (ppm) as a feature for differentiating true and false positives. These searches often considered more than 1000 fold greater peptide search spaces. However, the time penalty for this increase does not scale linearly for Sequest and was ~10 fold. Open searches for each 3-hr LC-MS run considered on average 44,390 MS/MS spectra and finished in less than two hours on a standard desktop computer (6-core CPU with 6 GB RAM). Note that using the pre-indexed database option is essential to achieving reasonable search times.
Closed search with dynamic modifications
To test the sensitive of the open search, we performed closed searches with dynamic modifications specified. The following dynamic modifications were used in each of the Closed searches as shown in Figure S3. Set 1) Oxidation (M), deamidation (N, Q), phosphorylation (ST), pyro-glutamate (N-term Q), carbamylation (K); Set 2) Formylation (ST), iron (ED), iodoacetmaide (M), N-terminal methionine cleavage and acetylation; Set 3) Acetylation (K), dihydroxy tryptophan (W), methylation (K), iodination (Y), N-terminal methionine cleavage.
Guassian fit analysis
Mass shifts were clustered using Gaussian mixture models using the mclust package for R44. Mass shifts were binned into 1 Da windows bounded at each half Da point. Within each bin, the number of mass shifts annotated in UniMod falling within that bin were used to set the maximum number of Gaussian mixtures in the model, and the mixture models allowing for variable mixture variances were fitted within that window. An optimal number of mixture components was calculated by the software using BIC, and the model for that number of components was used. Fitted mixture components with a variance greater than 0.01 were then removed from the data set.
Ascore
The Ascore algorithm34 uses the cumulative binomial probability distribution to provide a localization score for a mass difference (phosphorylation, +79.9663) to a serine, threonine, or tyrosine. We modified the Ascore algorithm to allow for the localization of any modification mass to any potential site within the peptide. Because sufficient information was not always present to localize to a specific site, scores were calculated for individual sites as well as regions. An Ascore value of >20 (p<0.01) was used as a threshold significance value for assigning modifications to an amino acid or region within a peptide. Supplementary table 2 contains the Ascore, Ascore sequence (potential location of modification), Ascore region (amino acids in which the score is identical) and the number of amino acids considered in the region. In addition, a modification could not be localized if the number of ions matched for a peptide did not increase when the modification was considered throughout the sequence.
Dissemination
Open searches are supported in the Proteome Discoverer software suite in Version 2.0 (ThermoFisher Scientific). The 24 raw mass spectrometry data files (.raw) from HEK293 cells are available upon request and have been deposited into ProteomeXchange (PXD001468). Hyperlinks to both the .out and .dta files are found within the supplementary tables. Annotated MS/MS spectra are also visualized via hyperlink for any matched spectrum. The following tables have been submitted as supplementary tables to complement this manuscript;
Supplementary Material
Supplementary table 1: Closed search analysis of HEK 293 cells.
Supplementary table 2: Open search analysis of HEK 293 cells.
Supplementary table 3: Guassian mixed model analysis of HEK 293 cells searched using the Open search.
Figure S1: The mass accuracy of fragment ions is important for peptide recovery in wide-tolerance searches. The same data as in Figure 1B was searched with varying fragment ion tolerances (FIT). Peaks in MS/MS spectra were thus required to match with differing tolerances. A 1.0 Da FIT is typically used to search spectra collected at lower resolution. For the ±500-Da precursor ion search, only 43.9% of peptides were recovered for a FIT of 1.0 Da. In contrast, the ±500-Da precursor ion search using FIT of 0.01 recovered 85.5% of peptides.
Figure S2. The Open search approach assigns peptide matches without violating the target-decoy strategy. A) First-ranked peptides are more commonly derived from the target (forward) database. Triplicate LC-MS/MS analysis of mouse brain peptides (same as in Figure 1B) were searched with either a 5 ppm or 500 Da precursor ion search tolerance. Matches were partitioned (regardless of score) based on their database origin (forward or reversed). Due to the large number of correctly-matched peptides, the target database is more frequently selected. B) Tenth-ranked peptides from these same searches are equally distributed between the forward and reversed databases. This rank position would overwhelmingly correspond to random matches. The 5 ppm closed search at a Sequest rank of 10 had an even split of 49.2 % for forward and 50.8% for reversed matches. Likewise, a 500 Da search showed a 49.6% forward and 50.4% reverse identification rate.
Figure S3. Comparisons using a Closed searches directed at the 15 most-frequently detected modifications. The same data as in Figure 1B were subjected to three different Closed searches (+/− 5 ppm) but 5 modifications were specified in each set. The modifications were chosen in order as the 15 most abundantly detected based on the Open search. They included the following three sets with the affected amino acids shown in parentheses. Set 1: Oxidation (M), deamidation (N, Q), phosphorylation (ST), pyro-glutamate (N-term Q), carbamylation (K). Set 2: Formylation (ST), iron (ED), iodoacetmaide (M), N-terminal methionine cleavage and acetylation. Set 3: Acetylation (K), dihydroxy tryptophan (W), methylation (K), iodination (Y), N-terminal methionine cleavage.
A) Breakdown for each search comparing the number of modified peptides found in each search with the overlap to the Open search results. Note that the Open search identified ~50% or fewer of the same peptides compared to the directed closed search. Similar to Figures 1F–1I, the sensitivity of the Open search for any modification is ~50%.
B) Comparison of the overlap between directed Closed and Open searches. Three directed searches with 5 modifications in each identified 145,138 modified peptides. The overlap with the 184,982 modified matches from the Open search was 71,995. Most assigned spectra from an Open search (117,073) correspond to one of the remaining ~500 ΔM bins.
Figure S4. In-source dissociation produces fragment ions that can be selected as precursor ions for MS/MS analysis. During the ionization process, we often detected evidence of in-source fragmentation. An example from an Open search shows that these peptides 1) co-elute, and 2) differ in mass by the removal of one or more amino acids from one terminus. In this example, a peptide from HSPA8 appears to co-elute with another peptide. The Open search identified the correct tryptic sequence with a ΔM value corresponding to the loss of two isoleucines (−226.1683 Da). A–C) MS/MS spectrum, extracted ion chromatogram, and predicted and observed fragment ions for the in-source dissociation species. D–F) MS/MS spectrum, extracted ion chromatogram, and predicted and observed fragment ions for the unmodified species. The intact species was recorded at 66-fold higher abundance than the in-source dissociation one.
Figure S5. The ±500-Da search identified ~2,000 phosphopeptides. A frequently-detected modification was phosphorylation. Likely due to high stoichiometry, many of these were detected only in their phosphorylated forms. Some examples of phosphorylation sites follow. A) Serine/arginine repetitive matrix protein 1 was identified with the phosphorylation of serine 696, which was not observed in an unmodified form. Ras GTPase-activating protein-binding protein 2 (G3bp2) was identified with phosphorylation of threonine 227 in which 76% of the peptides with that sequence were phosphorylated. There were other modifications on this peptide thus the total does not sum to 100%. C) Progesterone receptor membrane component 2 (Pgrmc2) was identified frequently with phosphorylation at threonine 205.
Figure S6. Characterization of protein N termini identified through the 500-Da search in HEK293 cells. A-D) N-terminal peptides were identified with four main distinct Δmass values (−89 Da, −131 Da, +42 Da and unmodified). These values corresponded to protein N-terminal processing events which included methionine cleavage and/or acetylation. E) Summary of protein N-terminal modifications. The majority of proteins (78%) are acetylated in HEK293 cells. F) Venn diagram representation of all the N-terminal peptides demonstrating that a small fraction of protein N termini were actually identified with more than one processing type. In a few cases, all 4 possible N-terminal modifications were present.
Figure S7. Glycosylated peptides were detected in the 500-Da search approach. Host cell factor 1 was identified with 11 glycosylation sites, all of which were O-GlcNAc modifications. A) Diagrammatic representation of Host cell factor and its domains showing the position of each GlcNAc modification. These GlcNAc sites cluster around the known protein-protein interaction domains. B-E) Example MS/MS spectra for several GlcNAc sites showing the matching of fragment ions and the detection of the GlcNAc-specific ion at 204 Da with subsequent water losses (186 Da and 168 Da) (F-H) Three notch receptors were identified with various types of glycosylation modifications throughout EGF repeats. F) Notch 2 contained nine different peptides with several types of glycosylation, including fucose, Glc, Glc-Xyl, Glc-Xyl-Xyl, GlcNAc and GlcNAc-Glc. G) Notch 1 was identified with both fucose and Glc-Xyl-Xyl on five peptides. H) Notch 3 was identified with fucose, Glc and Glc-Xyl-Xyl on four different peptides.
Figure S8. Example spectra showing the identification of the same peptide from Histone H3 with four different modifications. A) mono-methylation, B) di-methylation, C) tri-methylation, and D) acetylation.
Figure S9. Detection of a diphthalamide modification on H715 in Elongation factor 2. A) Chemical formula and structure of the modified histidine. B) Predicted and identified fragment ions with a modified histidine residue. C) MS/MS spectrum with b- and y-type ions labeled with the addition of +83.065 Da to the histidine residue. The large diphthamide modification subsequently fragments to release a trimethylamine leaving the histidine modified by only a Δmass +83.0651 Da.
Figure S10. Example MS/MS spectra for single amino acid variants and poly-alanine insertions in HEK293 proteins. A-D) Examples of four detected mutations and their corresponding MS/MS spectra. Fragment ions are labeled based on the modification and position shown. E-F) Ribosomal protein L14 was identified with multiple alanine insertions ranging from three to six insertions. Blue circles designate b-type ions that were the result of the loss of water from the threonine residue (b2).
Acknowledgments
We thank all members of the Gygi lab for fruitful discussions about this work. This work was funded in part by NIH grants (HG3456 and GM67945) to SPG.
Footnotes
Author Contributions
B.Z. collected the proteomic dataset. J.M.C and S.P.G implemented the search strategy, performed the data analysis and interpreted the results. D.P.N provided Guassian modeling analysis. D.K. and E.H. provided computational support. E.H provided statistical expertise regarding FDR analysis. R.R performed the Ascore localization analysis. J.M.C, S.P.G, conceived the idea, discussed and wrote the manuscript.
References
- 1.Washburn MP, Wolters D, Yates JR., 3rd Large-scale analysis of the yeast proteome by multidimensional protein identification technology. Nat Biotechnol. 2001;19:242–247. doi: 10.1038/85686. [DOI] [PubMed] [Google Scholar]
- 2.Wolters DA, Washburn MP, Yates JR., 3rd An automated multidimensional protein identification technology for shotgun proteomics. Anal Chem. 2001;73:5683–5690. doi: 10.1021/ac010617e. [DOI] [PubMed] [Google Scholar]
- 3.Eng JK, McCormack AL, Yates JR. An approach to correlate tandem mass spectral data of peptides with amino acid sequences in a protein database. J Am Soc Mass Spectrom. 1994;5:976–89. doi: 10.1016/1044-0305(94)80016-2. [DOI] [PubMed] [Google Scholar]
- 4.Perkins DN, Pappin DJ, Creasy DM, Cottrell JS. Probability-based protein identification by searching sequence databases using mass spectrometry data. Electrophoresis. 1999;20:3551–3567. doi: 10.1002/(SICI)1522-2683(19991201)20:18<3551::AID-ELPS3551>3.0.CO;2-2. [DOI] [PubMed] [Google Scholar]
- 5.Beck M, et al. The quantitative proteome of a human cell line. Mol Syst Biol. 2011;7:549. doi: 10.1038/msb.2011.82. [DOI] [PMC free article] [PubMed] [Google Scholar]
- 6.Geiger T, Wehner A, Schaab C, Cox J, Mann M. Comparative proteomic analysis of eleven common cell lines reveals ubiquitous but varying expression of most proteins. Mol Cell Proteomics. 2012;11:M111 014050. doi: 10.1074/mcp.M111.014050. [DOI] [PMC free article] [PubMed] [Google Scholar]
- 7.Nagaraj N, et al. Deep proteome and transcriptome mapping of a human cancer cell line. Mol Syst Biol. 2011;7:1–8. doi: 10.1038/msb.2011.81. [DOI] [PMC free article] [PubMed] [Google Scholar]
- 8.Dasari S, et al. TagRecon: high-throughput mutation identification through sequence tagging. J Proteome Res. 2010;9:1716–1726. doi: 10.1021/pr900850m. [DOI] [PMC free article] [PubMed] [Google Scholar]
- 9.Mann M, Wilm M. Error-tolerant identification of peptides in sequence databases by peptide sequence tags. Anal Chem. 1994;66:4390–4399. doi: 10.1021/ac00096a002. [DOI] [PubMed] [Google Scholar]
- 10.Tabb DL, Saraf A, Yates JR., 3rd GutenTag: high-throughput sequence tagging via an empirically derived fragmentation model. Anal Chem. 2003;75:6415–6421. doi: 10.1021/ac0347462. [DOI] [PMC free article] [PubMed] [Google Scholar]
- 11.Kim S, Gupta N, Bandeira N, Pevzner PA. Spectral dictionaries: Integrating de novo peptide sequencing with database search of tandem mass spectra. Mol Cell Proteomics. 2009;8:53–69. doi: 10.1074/mcp.M800103-MCP200. [DOI] [PMC free article] [PubMed] [Google Scholar]
- 12.Liu C, Yan B, Song Y, Xu Y, Cai L. Peptide sequence tag-based blind identification of post-translational modifications with point process model. Bioinformatics. 2006;22:e307–13. doi: 10.1093/bioinformatics/btl226. [DOI] [PubMed] [Google Scholar]
- 13.Bern M, Cai Y, Goldberg D. Lookup peaks: a hybrid of de novo sequencing and database search for protein identification by tandem mass spectrometry. Anal Chem. 2007;79:1393–1400. doi: 10.1021/ac0617013. [DOI] [PubMed] [Google Scholar]
- 14.Shilov IV, et al. The Paragon Algorithm, a next generation search engine that uses sequence temperature values and feature probabilities to identify peptides from tandem mass spectra. Mol Cell Proteomics. 2007;6:1638–1655. doi: 10.1074/mcp.T600050-MCP200. [DOI] [PubMed] [Google Scholar]
- 15.Sunyaev S, Liska AJ, Golod A, Shevchenko A. MultiTag: multiple error-tolerant sequence tag search for the sequence-similarity identification of proteins by mass spectrometry. Anal Chem. 2003;75:1307–1315. doi: 10.1021/ac026199a. [DOI] [PubMed] [Google Scholar]
- 16.Renard BY, et al. Overcoming species boundaries in peptide identification with Bayesian information criterion-driven error-tolerant peptide search (BICEPS) Mol Cell Proteomics. 2012;11:M111 014167. doi: 10.1074/mcp.M111.014167. [DOI] [PMC free article] [PubMed] [Google Scholar]
- 17.Creasy DM, Cottrell JS. Error tolerant searching of uninterpreted tandem mass spectrometry data. Proteomics. 2002;2:1426–1434. doi: 10.1002/1615-9861(200210)2:10<1426::AID-PROT1426>3.0.CO;2-5. [DOI] [PubMed] [Google Scholar]
- 18.Tsur D, Tanner S, Zandi E, Bafna V, Pevzner PA. Identification of post-translational modifications by blind search of mass spectra. Nat Biotechnol. 2005;23:1562–1567. doi: 10.1038/nbt1168. [DOI] [PubMed] [Google Scholar]
- 19.Savitski MM, Nielsen ML, Zubarev RA. ModifiComb, a new proteomic tool for mapping substoichiometric post-translational modifications, finding novel types of modifications, and fingerprinting complex protein mixtures. Mol Cell Proteomics. 2006;5:935–948. doi: 10.1074/mcp.T500034-MCP200. [DOI] [PubMed] [Google Scholar]
- 20.Huttlin EL, et al. A Tissue-Specific Atlas of Mouse Protein Phosphorylation and Expression. Cell. 2010;143:1174–1189. doi: 10.1016/j.cell.2010.12.001. [DOI] [PMC free article] [PubMed] [Google Scholar]
- 21.Zielinska DF, Gnad F, Schropp K, Wisniewski JR, Mann M. Mapping N-glycosylation sites across seven evolutionarily distant species reveals a divergent substrate proteome despite a common core machinery. Mol Cell. 2012;46:542–548. doi: 10.1016/j.molcel.2012.04.031. [DOI] [PubMed] [Google Scholar]
- 22.Choudhary C, et al. Lysine acetylation targets protein complexes and co-regulates major cellular functions. Science (80-.) 2009;325:834–840. doi: 10.1126/science.1175371. [DOI] [PubMed] [Google Scholar]
- 23.Kim W, et al. Systematic and quantitative assessment of the ubiquitin-modified proteome. Mol Cell. 2011;44:325–340. doi: 10.1016/j.molcel.2011.08.025. [DOI] [PMC free article] [PubMed] [Google Scholar]
- 24.Zhang Y, Wang J, Ding M, Yu Y. Site-specific characterization of the Asp- and Glu-ADP-ribosylated proteome. Nat Methods. 2013;10:981–984. doi: 10.1038/nmeth.2603. [DOI] [PubMed] [Google Scholar]
- 25.Banerji S, et al. Sequence analysis of mutations and translocations across breast cancer subtypes. Nature. 2012;486:405–409. doi: 10.1038/nature11154. [DOI] [PMC free article] [PubMed] [Google Scholar]
- 26.Jones S, et al. Core signaling pathways in human pancreatic cancers revealed by global genomic analyses. Science (80-.) 2008;321:1801–1806. doi: 10.1126/science.1164368. [DOI] [PMC free article] [PubMed] [Google Scholar]
- 27.Zhang J, et al. PEAKS DB: de novo sequencing assisted database search for sensitive and accurate peptide identification. Mol Cell Proteomics. 2012;11:M111 010587. doi: 10.1074/mcp.M111.010587. [DOI] [PMC free article] [PubMed] [Google Scholar]
- 28.Li J, Duncan DT, Zhang B. CanProVar: a human cancer proteome variation database. Hum Mutat. 2010;31:219–228. doi: 10.1002/humu.21176. [DOI] [PMC free article] [PubMed] [Google Scholar]
- 29.Makarov A, et al. Performance evaluation of a hybrid linear ion trap/orbitrap mass spectrometer. Anal Chem. 2006;78:2113–2120. doi: 10.1021/ac0518811. [DOI] [PubMed] [Google Scholar]
- 30.Makarov A, Denisov E, Lange O, Horning S. Dynamic range of mass accuracy in LTQ Orbitrap hybrid mass spectrometer. J Am Soc Mass Spectrom. 2006;17:977–982. doi: 10.1016/j.jasms.2006.03.006. [DOI] [PubMed] [Google Scholar]
- 31.Olsen JV, et al. Parts per million mass accuracy on an Orbitrap mass spectrometer via lock mass injection into a C-trap. Mol Cell Proteomics. 2005;4:2010–2021. doi: 10.1074/mcp.T500030-MCP200. [DOI] [PubMed] [Google Scholar]
- 32.Olsen JV. Higher-energy C-trap dissociation for peptide modification analysis. Nat Methods. 2007;4:709–712. doi: 10.1038/nmeth1060. [DOI] [PubMed] [Google Scholar]
- 33.Boyne MT, et al. Tandem mass spectrometry with ultrahigh mass accuracy clarifies peptide identification by database retrieval. J Proteome Res. 2009;8:374–379. doi: 10.1021/pr800635m. [DOI] [PMC free article] [PubMed] [Google Scholar]
- 34.Beausoleil SA, Villen J, Gerber SA, Rush J, Gygi SP. A probability-based approach for high-throughput protein phosphorylation analysis and site localization. Nat Biotechnol. 2006;24:1285–1292. doi: 10.1038/nbt1240. [DOI] [PubMed] [Google Scholar]
- 35.Elias JE, Gygi SP. Target-decoy search strategy for increased confidence in large-scale protein identifications by mass spectrometry. Nat Methods. 2007;4:207–214. doi: 10.1038/nmeth1019. [DOI] [PubMed] [Google Scholar]
- 36.Mullen JR, et al. Identification and characterization of genes and mutants for an N-terminal acetyltransferase from yeast. EMBO J. 1989;8:2067–2075. doi: 10.1002/j.1460-2075.1989.tb03615.x. [DOI] [PMC free article] [PubMed] [Google Scholar]
- 37.Polevoda B, Sherman F. N-terminal acetyltransferases and sequence requirements for N-terminal acetylation of eukaryotic proteins. J Mol Biol. 2003;325:595–622. doi: 10.1016/s0022-2836(02)01269-x. [DOI] [PubMed] [Google Scholar]
- 38.Arnesen T, et al. Proteomics analyses reveal the evolutionary conservation and divergence of N-terminal acetyltransferases from yeast and humans. Proc Natl Acad Sci U S A. 2009;106:8157–8162. doi: 10.1073/pnas.0901931106. [DOI] [PMC free article] [PubMed] [Google Scholar]
- 39.Helbig AO, et al. Profiling of N-acetylated protein termini provides in-depth insights into the N-terminal nature of the proteome. Mol Cell Proteomics. 2010;9:928–939. doi: 10.1074/mcp.M900463-MCP200. [DOI] [PMC free article] [PubMed] [Google Scholar]
- 40.Takeuchi H, Kantharia J, Sethi MK, Bakker H, Haltiwanger RS. Site-specific O-glucosylation of the epidermal growth factor-like (EGF) repeats of notch: efficiency of glycosylation is affected by proper folding and amino acid sequence of individual EGF repeats. J Biol Chem. 2012;287:33934–33944. doi: 10.1074/jbc.M112.401315. [DOI] [PMC free article] [PubMed] [Google Scholar]
- 41.Whiteheart SW, Shenbagamurthi P, Chen L, Cotter RJ, Hart GW. Murine elongation factor 1 alpha (EF-1 alpha) is posttranslationally modified by novel amide-linked ethanolamine-phosphoglycerol moieties. Addition of ethanolamine-phosphoglycerol to specific glutamic acid residues on EF-1 alpha. J Biol Chem. 1989;264:14334–14341. [PubMed] [Google Scholar]
- 42.Moehring JM, Moehring TJ, Danley DE. Posttranslational modification of elongation factor 2 in diphtheria-toxin-resistant mutants of CHO-K1 cells. Proc Natl Acad Sci U S A. 1980;77:1010–1014. doi: 10.1073/pnas.77.2.1010. [DOI] [PMC free article] [PubMed] [Google Scholar]
- 43.Nielsen ML, Savitski MM, Zubarev RA. Extent of modifications in human proteome samples and their effect on dynamic range of analysis in shotgun proteomics. Mol Cell Proteomics. 2006;5:2384–2391. doi: 10.1074/mcp.M600248-MCP200. [DOI] [PubMed] [Google Scholar]
- 44.Fraley C, Raftery Adrian E, Murphey T Brendan, Scrucca L. mclust Version 4 for R: Normal Mixture Modeling for Model-Based Clustering, Classification, and Density Estimation Technical Report No. 597. Dep Stat Univ Ofwashingt. 2012 [Google Scholar]
Associated Data
This section collects any data citations, data availability statements, or supplementary materials included in this article.
Supplementary Materials
Supplementary table 1: Closed search analysis of HEK 293 cells.
Supplementary table 2: Open search analysis of HEK 293 cells.
Supplementary table 3: Guassian mixed model analysis of HEK 293 cells searched using the Open search.
Figure S1: The mass accuracy of fragment ions is important for peptide recovery in wide-tolerance searches. The same data as in Figure 1B was searched with varying fragment ion tolerances (FIT). Peaks in MS/MS spectra were thus required to match with differing tolerances. A 1.0 Da FIT is typically used to search spectra collected at lower resolution. For the ±500-Da precursor ion search, only 43.9% of peptides were recovered for a FIT of 1.0 Da. In contrast, the ±500-Da precursor ion search using FIT of 0.01 recovered 85.5% of peptides.
Figure S2. The Open search approach assigns peptide matches without violating the target-decoy strategy. A) First-ranked peptides are more commonly derived from the target (forward) database. Triplicate LC-MS/MS analysis of mouse brain peptides (same as in Figure 1B) were searched with either a 5 ppm or 500 Da precursor ion search tolerance. Matches were partitioned (regardless of score) based on their database origin (forward or reversed). Due to the large number of correctly-matched peptides, the target database is more frequently selected. B) Tenth-ranked peptides from these same searches are equally distributed between the forward and reversed databases. This rank position would overwhelmingly correspond to random matches. The 5 ppm closed search at a Sequest rank of 10 had an even split of 49.2 % for forward and 50.8% for reversed matches. Likewise, a 500 Da search showed a 49.6% forward and 50.4% reverse identification rate.
Figure S3. Comparisons using a Closed searches directed at the 15 most-frequently detected modifications. The same data as in Figure 1B were subjected to three different Closed searches (+/− 5 ppm) but 5 modifications were specified in each set. The modifications were chosen in order as the 15 most abundantly detected based on the Open search. They included the following three sets with the affected amino acids shown in parentheses. Set 1: Oxidation (M), deamidation (N, Q), phosphorylation (ST), pyro-glutamate (N-term Q), carbamylation (K). Set 2: Formylation (ST), iron (ED), iodoacetmaide (M), N-terminal methionine cleavage and acetylation. Set 3: Acetylation (K), dihydroxy tryptophan (W), methylation (K), iodination (Y), N-terminal methionine cleavage.
A) Breakdown for each search comparing the number of modified peptides found in each search with the overlap to the Open search results. Note that the Open search identified ~50% or fewer of the same peptides compared to the directed closed search. Similar to Figures 1F–1I, the sensitivity of the Open search for any modification is ~50%.
B) Comparison of the overlap between directed Closed and Open searches. Three directed searches with 5 modifications in each identified 145,138 modified peptides. The overlap with the 184,982 modified matches from the Open search was 71,995. Most assigned spectra from an Open search (117,073) correspond to one of the remaining ~500 ΔM bins.
Figure S4. In-source dissociation produces fragment ions that can be selected as precursor ions for MS/MS analysis. During the ionization process, we often detected evidence of in-source fragmentation. An example from an Open search shows that these peptides 1) co-elute, and 2) differ in mass by the removal of one or more amino acids from one terminus. In this example, a peptide from HSPA8 appears to co-elute with another peptide. The Open search identified the correct tryptic sequence with a ΔM value corresponding to the loss of two isoleucines (−226.1683 Da). A–C) MS/MS spectrum, extracted ion chromatogram, and predicted and observed fragment ions for the in-source dissociation species. D–F) MS/MS spectrum, extracted ion chromatogram, and predicted and observed fragment ions for the unmodified species. The intact species was recorded at 66-fold higher abundance than the in-source dissociation one.
Figure S5. The ±500-Da search identified ~2,000 phosphopeptides. A frequently-detected modification was phosphorylation. Likely due to high stoichiometry, many of these were detected only in their phosphorylated forms. Some examples of phosphorylation sites follow. A) Serine/arginine repetitive matrix protein 1 was identified with the phosphorylation of serine 696, which was not observed in an unmodified form. Ras GTPase-activating protein-binding protein 2 (G3bp2) was identified with phosphorylation of threonine 227 in which 76% of the peptides with that sequence were phosphorylated. There were other modifications on this peptide thus the total does not sum to 100%. C) Progesterone receptor membrane component 2 (Pgrmc2) was identified frequently with phosphorylation at threonine 205.
Figure S6. Characterization of protein N termini identified through the 500-Da search in HEK293 cells. A-D) N-terminal peptides were identified with four main distinct Δmass values (−89 Da, −131 Da, +42 Da and unmodified). These values corresponded to protein N-terminal processing events which included methionine cleavage and/or acetylation. E) Summary of protein N-terminal modifications. The majority of proteins (78%) are acetylated in HEK293 cells. F) Venn diagram representation of all the N-terminal peptides demonstrating that a small fraction of protein N termini were actually identified with more than one processing type. In a few cases, all 4 possible N-terminal modifications were present.
Figure S7. Glycosylated peptides were detected in the 500-Da search approach. Host cell factor 1 was identified with 11 glycosylation sites, all of which were O-GlcNAc modifications. A) Diagrammatic representation of Host cell factor and its domains showing the position of each GlcNAc modification. These GlcNAc sites cluster around the known protein-protein interaction domains. B-E) Example MS/MS spectra for several GlcNAc sites showing the matching of fragment ions and the detection of the GlcNAc-specific ion at 204 Da with subsequent water losses (186 Da and 168 Da) (F-H) Three notch receptors were identified with various types of glycosylation modifications throughout EGF repeats. F) Notch 2 contained nine different peptides with several types of glycosylation, including fucose, Glc, Glc-Xyl, Glc-Xyl-Xyl, GlcNAc and GlcNAc-Glc. G) Notch 1 was identified with both fucose and Glc-Xyl-Xyl on five peptides. H) Notch 3 was identified with fucose, Glc and Glc-Xyl-Xyl on four different peptides.
Figure S8. Example spectra showing the identification of the same peptide from Histone H3 with four different modifications. A) mono-methylation, B) di-methylation, C) tri-methylation, and D) acetylation.
Figure S9. Detection of a diphthalamide modification on H715 in Elongation factor 2. A) Chemical formula and structure of the modified histidine. B) Predicted and identified fragment ions with a modified histidine residue. C) MS/MS spectrum with b- and y-type ions labeled with the addition of +83.065 Da to the histidine residue. The large diphthamide modification subsequently fragments to release a trimethylamine leaving the histidine modified by only a Δmass +83.0651 Da.
Figure S10. Example MS/MS spectra for single amino acid variants and poly-alanine insertions in HEK293 proteins. A-D) Examples of four detected mutations and their corresponding MS/MS spectra. Fragment ions are labeled based on the modification and position shown. E-F) Ribosomal protein L14 was identified with multiple alanine insertions ranging from three to six insertions. Blue circles designate b-type ions that were the result of the loss of water from the threonine residue (b2).