

Abstract
MAS-1, a nanoparticular, emulsion-based adjuvant, was evaluated for its ability to promote Th2 and regulatory immune responses and prevent type 1 diabetes progression when given alone or as antigen-specific immunotherapy (ASI) using insulin B chain (IBC; MER3101) and its analog B:9-23(19Ala) (MER3102). MAS-1 formulations were administered to NOD mice at age 9 and 13 weeks and followed through 52 weeks. MER3101 and MER3102 provided long-term protection with 60% and 73% of mice remaining diabetes-free at week 35, and 60% and 47% at week 52. MAS-1 adjuvant emulsion by itself also provided protection with 60% and 40% of mice diabetes-free at 35 and 52 weeks, respectively. Higher levels of interleukin (IL)-10 and IL-2 positive T cells were detected among splenocytes by week 15 in MER3101 and MER3102 immunized mice, whereas MAS-1 alone induced higher levels of IL-10-positive T cells. Diabetes-free 52-week-old mice expressed significant levels of antigen-specific IL-10-positive type 1 regulatory T cells and FoxP3-positive T cells when stimulated ex vivo with IBC. Antibodies targeting IBC and B:9-23(19Ala) induced by MER3101 and MER3102 were overwhelmingly Th2 type IgG1 and IgG2b isotypes. Splenocyte cultures from 52 week diabetes-free, MER3101-treated mice secreted significantly increased levels of IL-4 and IL-5 Th2 cytokines. Based on these pre-clinical results and its clinical safety profile, MAS-1 has the requisite qualities to be considered for use in prophylactic or early stage disease settings to augment ASI to prevent disease progression in type 1 diabetes.
Keywords: Autoimmune, diabetes, immunotherapy, insulin, NOD, Th2 type adjuvant, type 1
Introduction
Antigen-specific immunotherapy (ASI) has the potential to restore immune balance in autoimmune diabetes (T1D) while at the same time providing an excellent safety profile [1]. However, the results of ASI clinical trials so far, including those reported recently with alum-adjuvanted glutamic acid decarboxylase 65 (GAD65), have been disappointing [2–4]. Various islet cell autoantigens, including insulin, GAD65, insulinoma antigen 2 and glucose-6-phophatase catalytic subunit are recognized in T1D [5–8] and all are potential candidates for ASI. Insulin, in particular, is recognized as a dominant autoantigen in both murine and human autoimmune diabetes [9–16], with a high proportion of islet-infiltrating CD8 T cells in recent and long-term T1D patients being insulin-reactive [17]. Proinsulin-/insulin-based approaches have been evaluated as candidates for ASI.
With the exception of alum-adjuvanted GAD65, surprisingly little attention has been given to exploiting adjuvants to suitably augment ASI. Alum is a safe Th2 adjuvant approved in vaccines by regulatory authorities, but it is a weak Th2 adjuvant when combined with self-antigens. By contrast, incomplete Freund’s adjuvant (IFA) is a potent adjuvant that has shown potential to augment ASI in both preclinical studies with insulin B:9-23/IFA [18–20], and in a limited clinical safety study with IFA-adjuvanted insulin B chain (IBC/IFA) [21]. This approach has been associated with induction of several different protective T-cell phenotypes including FoxP3 Treg, IL-10 producing type 1 regulatory T cells (Tr1) and Th2 cells. Despite having been evaluated for more than 70 years, IFA has never been approved for human vaccines. MAS-1 adjuvant was originally developed to augment the immunogenicity of otherwise poorly immunogenic self-antigens to elicit neutralizing antibodies toward specific target antigens involved in gastrointestinal adenocarcinoma and prostate cancer [22]. MAS-1 was shown to exhibit an approximately 50-fold more potent immune response than alum when used with these self-antigens. Moreover, these MAS-1-adjuvanted self-antigen vaccines were administered in multiple dose regimens to almost 1500 patients without a single incident of systemic toxicity [22–24]. In this study, the potential of MAS-1 adjuvant to augment ASI in T1D was evaluated in a NOD mouse model using IBC (MER3101), and B:9-23 peptide with 19 alanine substitution (B19A) (MER3102) peptide antigens, for its potential to promote protective immune responses and prevent disease progression in T1D. The mutation of B:19 cystine (Cys) to alanine avoids potential problems with an unpaired Cys and it does not change the recognition by T cells [25].
Research design and methods
Materials and preparation
MAS-1 adjuvant vehicle was provided by Mercia Pharma, Inc. (New York, NY). IFA was purchased from SEPPIC (Paris, France) as ISA51. Mouse IBC and peptides were synthesized by Genemed Systhesis, Inc. (San Antonio, TX), at >95% purity. IFA-adjuvanted formulations were prepared by combining peptide in phosphate-buffered saline (PBS) with IFA in a 50:50 ratio (vol:vol) and vortexing at maximal speed with a table top vortex machine for 30 min at room temperature. The MAS-1 emulsion formulations were made by combining peptide in aqueous phase with MAS-1 in a 30:70 aqueous:oil ratio by weight and mixed by repetitively passing the mixture between two syringes for 90–120 s to produce stable, free-flowing, nanoparticular emulsions. The final peptide concentration was 1.0 mg/ml in all of the vaccine formulations.
Animal immunizations
NOD/LtJ female mice were purchased from The Jackson Laboratories (Bar Harbor, ME) and maintained in University of Colorado animal facilities under specific pathogen-free conditions. At nine weeks of age, the NOD mice were randomly assigned to six treatment groups: IBC/MAS-1 (n = 19), IBC/IFA positive control (n = 19), B19A/MAS-1 (n = 19), PBS/MAS-1 adjuvant emulsion (n = 19), B19A/PBS non-adjuvanted ASI control (n = 19) and PBS normal control (n = 19). Mice were injected subcutaneously with 100 μg of peptide antigen in either 100 μl PBS or in 100 μl MAS-1 adjuvant emulsion or with 100 μl MAS-1 adjuvant emulsion alone. The first injection was given at 9 weeks and repeated at 13 weeks. Two mice from each peptide or adjuvant treatment group were sacrificed at 11 and 15 weeks for ELISPOT assay. Serum insulin autoantibodies (IAA) were monitored by radioimmunoassay before treatment and every two weeks after immunization [26]. Fifteen mice for each group were monitored to ensure that the test detects a difference of 5 with 80% power. Blood glucose levels were monitored weekly starting from 10 weeks of age. Mice were diagnosed as diabetic after two consecutive blood glucose values of ≥250 mg/dl. Mice that were hyperglycemic for more than three consecutive measurements were killed; mice not meeting this criterion were followed to 52 weeks of age.
ELISA
Peptide-specific antibodies were measured by a europium-antibody-ELISA against target peptides [27]. Briefly, peptides IBC, B:9-23 and B19A were coated onto plates at 10 μg/ml in PBS overnight at 4°C. Sera (1–600 dilution) were added in and biotinylated rabbit anti-mouse IgG, IgM and IgA were used as secondary antibody, followed by streptavidin–europium conjugate. IgG isotype subclasses were detected using biotinylated rabbit anti-mouse IgG1, IgG2a, IgG2b and IgG3.
Insulin autoantibody assay
Serum IAA were monitored by radioimmunoassay [26].
ELISPOT assay
Splenocytes producing IL-10, IL-2 and interferon (IFN)-g in response to antigenic stimulation ex vivo were enumerated at 11 and 15 weeks in mice from all groups, and at 52 weeks of age in diabetes-free survivors, by ELISPOT kits (BD Biosciences, San Jose, CA). Single cell suspensions of splenocytes (5 × 10⁵ cells/0.2 ml/well) were incubated at 37°C for 72 h with or without stimulating antigens at 100 μg/ml. The stimulating antigens included IBC, B:9-23, B19A, negative control tetanus toxin (TT830-843) peptide and positive control anti-CD3 antibody at 0.1 μg/ml. Baseline values were obtained from cultures in the presence of PBS. Spots were enumerated using an ImmunoSpot reader and software version 3.1 (Cellular Technology Limited, Cleveland, OH). Group mean stimulation values are presented as the number of specific cytokine-positive cells per 5 × 10⁵ splenocytes (adjusted for PBS background).
Cytokine measurements
Splenocytes from mice surviving for 52 weeks were analyzed for Th1/Th2 cytokine profiles by analyzing supernatants of ELISPOT cultures using the mouse Th1/Th2 9-Plex Multispot 96-well plate assay (MESO Scale Discovery, Rockville, MD). The cytokines evaluated included murine IFN-γ, IL-1b, IL-2, IL-4, IL-5, IL-6, IL-10, IL-12 and tumor necrosis factor (TNF)-α. In addition, mouse IL-17 and active transforming growth factor beta 1 (TGF-β1) were measured by ELISA (eBioscience, San Diego, CA).
FACS analysis
FoxP3 staining was done using an anti-mouse/rat FoxP3 staining kit according to the manufacturer’s instructions (eBioscience 77-5775-40) and analyzed by flow cytometry (FACScalibur; BD Biosciences).
Histology
Mouse pancreata and salivary glands were harvested and fixed following sacrifice at 52 weeks of age and evaluated by insulin and hematoxylin and eosin (H&E) staining. Nonspecific inflammation was determined by assessment of sialitis. At 52 weeks, a minimum of four long-term diabetes-free mice from each group treated with IBC/IFA, IBC/MAS-1 and PBS/MAS were sacrificed and organs (kidneys, liver, lung, pancreas spleen, adrenal, aorta, stomach, duodenum, jejunum, ileum, cecum, colon, esophagus and trachea) were evaluated for histopathology following H&E staining.
Statistics
The age of IAA appearance, cytokine levels and mean ELISPOT numbers between groups were analyzed using the Mann–Whitney test. Survival curves for diabetes prevention were analyzed with the Chi square log-rank test using PRISM software (Graphpad, La Jolla, CA). p Values ≤0.05 were considered statistically significant.
Results
MAS-1 alone and when given with self-antigen can prevent progression to diabetes in NOD mice
The progression of diabetes development in this study is illustrated by the survival curves shown in Figure 1 and the data analyzed are listed in Table 1. This was also evident in blood glucose levels (Supplemental Figure 1), which were monitored weekly in each animal starting at 10 weeks of age. The results demonstrate that treatment beginning at 9 weeks of age with IBC/MAS-1 or IBC/IFA resulted in significant long-term protection from disease progression (IBC/MAS-1: 60% at both 35 and 52 weeks; IBC/IFA: 80% at 35 weeks and 73% at 52 weeks). Interestingly, treatment with PBS/MAS-1 alone provided 60% protection at 35 weeks and 40% protection by 52 weeks. Fousteri et al. [20] also observed a protective effect for PBS/IFA placebo, albeit to a lesser degree than was seen with PBS/MAS-1 adjuvant emulsion in this study. MAS-1-adjuvanted peptide B19A also provided protection, with 73% of mice diabetes-free at 35 weeks and 47% at 52 weeks of age. Treatment beginning at 9 weeks with B19A/PBS was minimally protective with only one animal remaining diabetes-free at 35 weeks. No PBS control animals remained diabetes-free by 35 weeks. Compared with PBS control and B19A/PBS control, the long-term 52 week protection by IBC/MAS-1, B19A/MAS-1 and IBC/IFA was highly statistically significant (p<0.001). Protection afforded by MAS-1 adjuvant emulsion alone at 52 weeks was statistically superior to PBS and B19A non-adjuvanted ASI controls (p = 0.002 and p = 0.009, respectively). The development of insulitis in diabetes-free mice at 52 weeks was evaluated histologically; no major difference in the degree of insulitis was noted among any of the groups of long-term surviving diabetes-free mice (Supplementary Figure 2).
Figure 1.
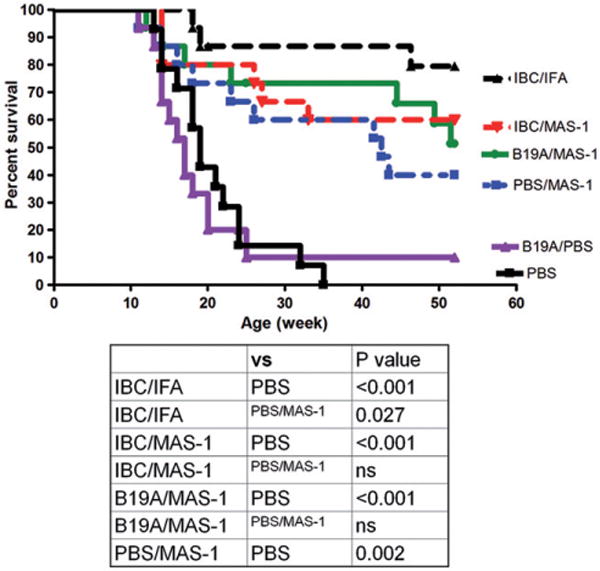
Cumulative percentages of diabetes-free mice over time for each study group. Black triangle (broken line) = IBC/IFA; red triangle = IBC/MAS-1 group; green circle = B19A/MAS-1 group; blue square = PBS/MAS-1 adjuvant emulsion; purple triangle = B19A/PBS non-adjuvanted ASI control group; black square = PBS normal control group. n = 15 for each group. Statistical analysis comparing the protection afforded by different treatment groups is included.
Table 1.
Diabetes-free survival data for NOD mice treated at 9 weeks of age.
| Age 9 weeks BS<250 mg/dL n/groupa |
Age 35 weeks BS<250 mg/dL n/group |
p Values (vs PBS)b |
Age 52 weeks BS<250 mg/dL n/group |
p Values (vs PBS) |
|
|---|---|---|---|---|---|
| IBC/MAS-1 | 15 | 9 (60%) | <0.001 | 9 (60%) | <0.001 |
| IBC/IFA | 15 | 12 (80%) | <0.001 | 11 (73%) | <0.001 |
| B19A/MAS-1 | 15 | 11 (73%) | <0.001 | 7 (47%) | <0.001 |
| PBS/MAS-1 | 15 | 9 (60%) | <0.001 | 6 (40%) | 0.008 0.037c |
| B19A/PBS | 15 | 1 (6%) | nsd | 1 (6%) | ns |
| PBS | 15 | 0 | 0 |
BS: blood glucose.
Two tailed Fisher exact probability test.
p Value vs B19A/PBS group.
No significant difference.
MAS-1-adjuvanted ASI induces IL-10- and IL-2-positive and IFN-γ-positive T cells
Protection of NOD mice from diabetes by IFA-adjuvanted insulin B:9-23 antigen was shown by Fousteri et al [20] to be associated in the immediate post-immunization period with increased expression of IL-10, IFN-γ and IL-4 cytokine-positive T cells [20]. In this study, the short-term cellular responses to IBC/MAS-1 and B19A/MAS-1 were characterized by evaluating IL-10, IFN-γ and IL-2 expression by ELISPOT at 11 and 15 weeks in antigen-stimulated spleen cells isolated from treated NOD mice.
At 11 weeks, splenocytes from mice treated with IBC/MAS-1, IBC/IFA and B19A/MAS-1 had more IL-10 secreting cells responding to B:9-23 compared to those treated with B19A/PBS non-adjuvanted ASI and MAS-1 adjuvant emulsion (Figure 2A). Of note, the IL-10-positive T cells induced by MAS-1-adjuvanted formulations were two- to threefold higher than those produced by IBC/IFA at 11 weeks. After the second immunization, the numbers of IL-10 secreting cells from the IBC/IFA group increased twofold but no increase was observed in IBC/MAS-1 and B19A/MAS-1 groups. IBC stimulation failed to elicit IL-10 production in mouse splenocytes at 11 weeks (Figure 2B); however, increased numbers of IBC-responsive IL-10-positive T cells were observed in all treated groups two weeks after the second dose of vaccine at 15 weeks. MAS-1-adjuvanted ASI-treated mice produced slightly more IL-10-positive T cells than B19A/PBS or PBS/MAS-1-treated mice.
Figure 2.
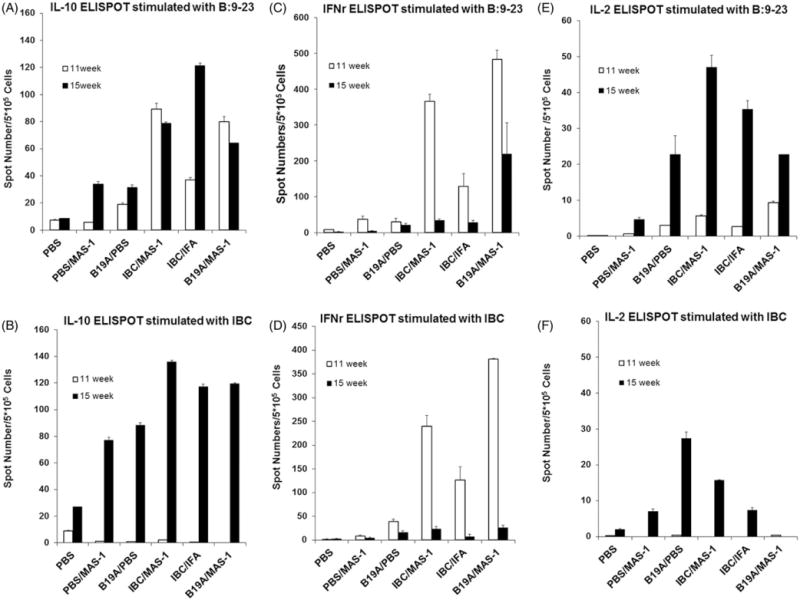
ELISPOT assay measuring antigen-specific IL-10, IFN-γ and IL-2 producing splenocytes of treated animals at 11 weeks (open bar) and 15 weeks (closed bar) upon re-stimulation with IBC and B9-23 ex vivo. (A and B) IL-10 producing cells stimulated with B:9-23 or IBC peptides. (C and D) IFN-γ-producing cells stimulated with B:9-23 or IBC peptides. (E and F) IL-2-producing cells stimulated with B:9-23 or IBC peptides. Two or three mice per group were analyzed at each time point. Parameters were tested in triplicate, with 5 × 10⁵ splenocytes/well. Error bars indicate the range of the duplicate or triplicate measurements.
ELISPOT analyses showed that B19A/MAS-1, IBC/IFA and IBC/MAS-1 immunized mice had significantly higher numbers of B:9-23- (Figure 2C) and IBC- (Figure 2D) specific IFN-γ-producing cells compared with PBS/MAS-1- or B19A/PBS-treated mice at 11 weeks. The strongest IFN-γ responses were seen from mice immunized with B19A/MAS-1 and IBC/MAS-1 (250–450 spots/5 × 105 cells), while IBC/IFA-treated mice yielded a somewhat weaker IFN-γ response. However, IFN-γ T cell responses from NOD mice treated with MAS-1-adjuvanted ASI were transient. By 15 weeks, the number of IBC or B:9-23 responsive IFN-γ-positive T cells in IBC/MAS-1, IBC/IFA and B19A/MAS-1 groups had decreased significantly to <50 per 5 × 10⁵ splenocytes (Figure 2C and D). By 15 weeks, only B19A/MAS-1-treated mice retained 50% of their week 11 IFN-γ response to stimulation with B:9-23 peptide, whereas, IBC-specific IFN-γ responses were hardly observed in any group despite strong IFN-γ responses to CD3 antibody controls (data not shown). No significant increase of B:9-23 or IBC-specific IFN-γ positive T cells were seen from either non-adjuvanted B19A or MAS-1 adjuvant emulsion treated animals at either time point (Figure 2C and D).
At 11 weeks, IL-2 positive T cell responses to B9–23 (Figure 2E) were weak and responses to IBC were not detectable (Figure 2F). However, 2 weeks after the second dose, IL-2-positive T cells were increased among splenocytes from mice immunized with all of the adjuvanted peptides, with the highest responses from IBC/MAS-1 immunized mice. By contrast, very little evidence for IL-2-positive T cells was found among splenocytes harvested from mice treated with MAS-1 adjuvant emulsion alone at either 11 or 15 weeks. The IL-2 response patterns to B9–23 and IBC were similar to those seen for IL-10, indicating an increased IL-2 response following the second immunization with antigen. The ELISPOT numbers after stimulation with TT830-843 peptide control were low and comparable to PBS stimulation in all the cytokine assays.
NOD mice protected long-term from diabetes have significantly elevated antigen-specific IL-10-positive and FoxP3-positive regulatory T cells
At 52 weeks, all of the surviving non-diabetic mice (non-DM) were sacrificed, and their spleen cells were assayed by ELISPOT for IL-10- and IFN-γ-positive T cells in response to peptides IBC, B:9-23 and B19A. As shown in Figure 3(A), IBC elicited substantial IL-10 responses from all MAS-1 treated groups compared to non-treated diabetic mice (DM). However, only the IBC/MAS-1 group had significantly higher IL-10 response to peptides B:9-23 and B19A (p = 0.006 and p = 0.01, respectively) compared to both non-treated diabetic and non-treated non-diabetic NOD mice. Interestingly, IL-10-positive T cells responsive to IBC were also seen in non-treated diabetes-free NOD mice of 25–30 weeks age. The prevalence of IL-10-positive T cells in IBC/MAS-1 treated mice at 200–300 per 5 × 10⁵ splenocytes was double that seen at 11 or 15 weeks of age (Figure 2B: 80–140 per per 5 × 10⁵ splenocytes). By contrast, the IL-10 responses to B:9-23 and B19A at 52 weeks were considerably lower than the response to IBC, and moreover, were significantly lower than the IL-10 responses to B:9-23 at 11 and 15 weeks. That significant levels of IL-10 cells were seen in all of the 52-week diabetes-free survivors, including those treated with just MAS-1, implies that the IL-10-positive T cell response is related to the disease-free status of these long-term diabetes-free mice. At age 52 weeks, the numbers of IFN-γ-positive splenocytes responding to B:9-23 and IBC (Figure 3B; 10–40/5 × 105 splenocytes) were approximately 10-fold lower than the peak numbers of IFN-γ producing cells seen at 11 weeks of age (Figure 2D; 100–400/5 × 105 splenocytes). Nevertheless, IBC, B:9-23, or B19A-specific IFN-γ-positive cells were slightly elevated in MAS-1-adjuvanted IBC and MAS-1-adjuvanted B19A-treated mice compared with TT stimulation (Figure 3B). The numbers of B19A-specific IFN-γ positive cells of the IBC/MAS-1 group (p = 0.005) and the B19A/MAS-1 group (p = 0.009) were significantly higher than those of the PBS/MAS-1 group. The relative proportion of IL-10-positive to IFN-γ-positive T cells (approximately 10:1) among splenocytes harvested from these long-term diabetes-free animals is consistent with their exhibiting a protective immunological phenotype.
Figure 3.
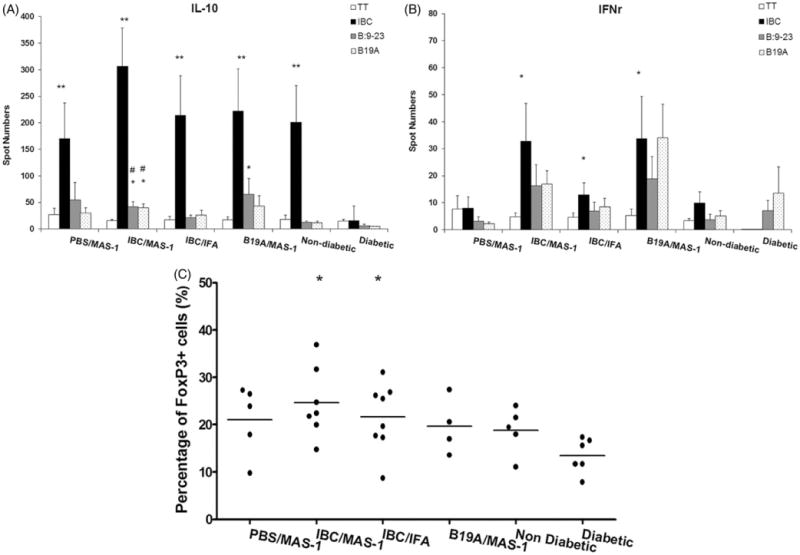
Antigen-specific IL-10- (A) and IFN-γ- (B) producing splenocytes of 52-week old diabetes-free NOD mice immunized with PBS/MAS-1, IBC/MAS-1, IBC/IFA or B19A/MAS-1 and re-stimulated ex vivo with PBS (open bar) insulin peptides IBC (black bar), B:9-23 (gray bar) and B19A (dot bar) measured by ELISPOT assay. Non-diabetic NOD mice at 25–30 weeks and new onset DM (within one week post diagnosis) were also analyzed for comparison. (C) The percentage of FoxP3+ population of CD4+ splenocytes from diabetes protected mice at 52 weeks. Each dot in (C) represents each surviving mouse. Statistical significance of <0.001 is denoted by **, * and #. *p≤0.005 and **p≤0.001 compared with new onset DM; #p≤0.05 and ##p≤0.001 compared with non-diabetic NOD mice.
The levels of FoxP3+ splenocytes at week 52 were determined by flow cytometry (Figure 3C). Because of the lack of 52-week-old untreated diabetes-free NOD mice, 25–30-week-old non-DM and new onset DM were analyzed at this time for comparative purposes. Diabetic NOD mice had the lowest mean frequency of FoxP3+ regulatory T cells among total splenocytes (13.5%), while FoxP3+ Treg cells among non-diabetic untreated NOD mice were 18.8% of total splenocytes. Compared with the frequency in new onset DM (13.5%), the elevated frequencies of FoxP3+-positive regulatory T cells among splenocytes in both the IBC/MAS-1 (24%, p = 0.004) and IBC/IFA (22%, p = 0.010) groups were statistically significant.
NOD mice protected long-term from diabetes express potentially protective Th2 cytokines
In addition to being associated with a regulatory T cell phenotype, protection from diabetes has also been associated with a shift from pathogenic Th1 to protective Th2 cytokine production as a beneficial outcome of immunization [20,28,29]. Th1/Th2 cytokine profiles of splenocytes from mice protected from diabetes at 52 weeks were analyzed by testing supernatants of ELISPOT cultures. Splenocytes from IBC/MAS-1-treated mice secreted increased levels of IL-4 and IL-5 in response to B:9-23 and IBC peptides compared with mice treated with PBS/MAS-1 and untreated diabetes-free control NOD mice aged 25–30 weeks (Figure 4A and B). Whereas IL-2 expression was increased at 11 and 15 weeks of age in response to MAS-1-adjuvanted ASI (Figure 2E and F), IL-2 expression was unchanged in the long-term protected diabetes-free animals at 52 weeks. Similarly, there were no statistically significant differences in expression of IL-12, IL-1β, TNF-α, IL-6 and IL-17 in long-term diabetes-free NOD mice (data not shown). No differences were found between any of the groups of long-term protected animals with respect to active TGF-β1 expression.
Figure 4.
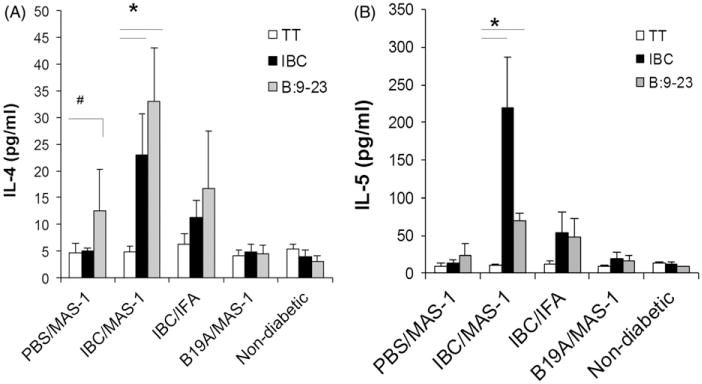
Antigen-specific cytokines of splenocytes harvested from diabetes-free NOD mice at 52 weeks of age. IL-4 (A) and IL-5 (B) secretion by splenocytes in responding to re-stimulation with TT control (white bar), peptides IBC (black bar) and B:9-23 (blue bar) ex-vivo, measured in cell culture supernatants by cytokine specific ELISAs. Data are presented as mean ± SEM of 4–5 mice per group. #p = 0.05, *p<0.001 vs. TT control.
MAS-1-adjuvanted ASI induce Th2 type antigen-specific antibody responses
IBC/MAS-1- and B19A/MAS-1-induced robust antigen-specific antibodies that increased significantly after the second dose, peaked by 15 weeks of age, and persisted throughout follow up to 52 weeks of age (Figure 5A and B, respectively). Antibody responses induced by IBC were similar for the MAS-1 and IFA adjuvants (Figure 5A). Anti-IBC antibodies induced by IBC/MAS-1 and IBC/IFA vaccines did not cross-react with the B19A peptide (Figure 5B), and the anti-B19A IgG did not cross-react with IBC (Figure 5A). The IgG subclasses in the three responding groups were measured in individual sera collected at ages 8 (pre-immunization – none detected), 15, 25 and 50 weeks by ELISA. In each case, the post-immunization IgG isotypes were overwhelmingly Th2-type IgG1 and IgG2b, with little to no Th1-type IgG2a or IgG3 isotypes (Figure 5C–E). No significant antigen-specific IgM or IgA responses were detected following immunization with any of the vaccines.
Figure 5.
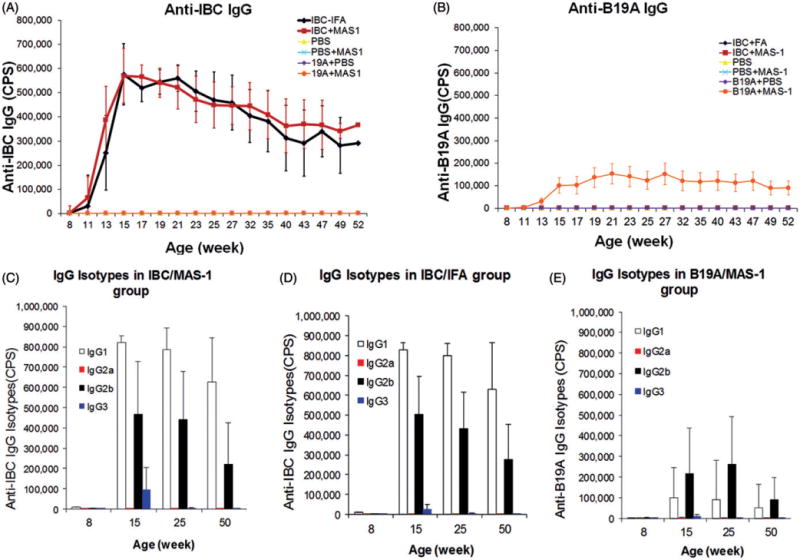
The development of antigen-specific IgG antibodies and their isotypes induced by immunization with MAS-1 and IFA-adjuvanted insulin-derived peptides. The development of anti-IBC IgG antibodies (A) and anti-B19A IgG antibodies (B) in NOD mice treated with IBC/IFA (black diamond), IBC/MAS-1 (red bar), PBS (yellow triangle), PBS/MAS-1 (blue cross), B19A/PBS (purple diamond) and B19A/MAS-1 (orange circle). PBS, PBS/MAS-1, B19A/PBS and B19A/MAS-1 did not induce any IBC-specific antibodies (lines overlap with x-axis (A)). Only B19A/MAS-1 induced B19A-antibodies (B). The peptide-specific IgG in serum from mice immunized with IBC/MAS-1 (C), IBC/IFA (D) and B19A/MAS-1 (E), were isotyped by mouse IGg1 (white bar), IgG2a (red bar), IgG2b (black bar) and IgG3 (blue bar) ELISA. Sera were diluted 1–600, and experiments were done in triplicate wells. Data are presented as the mean±SEM of all the mice of each group.
The development of IAA
Low levels of IAA were observed in sera from groups immunized with B19A/PBS and PBS/MAS-1 at levels not significantly different from IAA levels in PBS control animals (Supplemental Figure 3); whereas, IBC/MAS-1-, IBC/IFA- and B19A/MAS-1-treated mice exhibited significantly higher IAA levels compared to PBS control mice.
The specificity of the IAA response from groups immunized with PBS/MAS-1 adjuvant emulsion, B19A/MAS-1 and IBC/MAS-1 were assessed by peptide inhibition in the IAA radioimmunoassay (Supplemental Figure 3B–D). IAA from PBS-treated NOD mouse controls and B19A, formulated with or without MAS-1, were inhibited only by the native insulin molecule, but not by B:9-23 or IBC insulin-derived peptides, suggesting that these antibodies were targeting the autoimmune-associated insulin conformational epitope [30]. However, most IAA in sera from IBC/MAS-1- and IBC/IFA-treated mice (Supplemental Figure 3D) were absorbed by IBC peptides. These results demonstrate the increased IAA measured by RIA in the sera of IBC/MAS-1- and IBC/IFA-treated NOD mice are cross-reactive antibodies induced by IBC peptide immunization and recognize the B chain on the intact insulin molecule.
Safety
No adverse side effects were observed for any of the treatments. The body weights of the treated mice were not significantly different among any of the treatment groups. At 52 weeks of age, the long-term diabetes-free mice from each group were sacrificed and organs were evaluated by a veterinary pathologist. No organ lesions were observed in any of the treated mice (data not shown).
Discussion
Adjuvants that shift the cytokine milieu in favor of tolerogenic and regulatory mechanisms would be advantageous in the design of clinical treatments for autoimmune diseases. Approaches using vector containing cytokines such as IL-4, IL-5 and IL-10 have yielded varying degrees of success, but add complexity to the treatment regimen. MAS-1 appears to enhance existing regulatory pathways in NOD mice to down-regulate the autoimmune response, with further amplification by the addition of insulin peptides resulting in higher levels of antigen-specific regulatory responses including significantly elevated numbers of IL-10 and FoxP3+ T cells even through 52 weeks of age.
This is the first time that evaluation of the potential for MAS-1-adjuvanted ASI for autoimmune diabetes has been reported. In this study, MAS-1 adjuvant when formulated with IBC (MER3101), and B19A (MER3102), was evaluated for its ability to induce protective regulatory Tr1 [31] and Foxp3+ [32] cellular and cytokine [33] responses capable of providing long-term (52 weeks of age) protection from diabetes in late stage pre-diabetic NOD mice. Dosing beginning at 9 weeks of age was selected to examine the ability of MAS-1 to prevent disease progression in the NOD mouse, since starting at 4 weeks non-adjuvanted B9-23 [34] delays progression by 50% compared with 6% of non-adjuvanted B19Ala in this study. In this model, all untreated NOD mice developed diabetes by 35 weeks of age, NOD mice treated at 9 and 13 weeks of age with MAS-1-adjuvanted ASI were significantly protected long-term from disease progression through 52 weeks of age. In IBC/MAS-1-treated mice, FoxP3+ regulatory T cells were significantly increased among splenocytes (24% of total CD4 T cells) of long-term (52 week) diabetes-free NOD mice compared with untreated new onset diabetic NOD mice (13.5% of total). Moreover, significantly increased numbers of IL-10-positive T cells were seen among splenocytes from IBC/MAS-1-treated NOD mice. The increase in IL-10-positive T cells was evident by 11 and 15 weeks and further increased by 52 weeks in diabetes-free animals. In IBC/MAS-1-treated mice, increased expression of IFN-γ appears to be transient; after peaking at age 11 weeks, it fell back by 15 weeks, and remained low through 52 weeks of age.
Antigen-specific secretion of Th2 cytokines IL-4 and IL-5 seen at 52 weeks is consistent with the overwhelmingly Th2 biased antigen-specific IgG responses to MAS-1-adjuvanted ASI. Curiously, we saw persistence of this Th2 cytokine response for IBC/MAS-1-treated mice, but not in B19A/MAS-1-treated mice. This may suggest that different antigenic epitopes may lead to different mechanisms of tolerance. The absence of significant differences in expression of IL-12, IL-1b, TNF-α, IL-6 and IL-17 in long-term diabetes-free NOD mice is also consistent with the observations reported by Fousteri et al. [20].
Although most prevention ASI studies in NOD mouse were conducted in the early stages of the disease [35,36], Fousteri et al. [20] reported that adjuvanted ASI with B:9-23/IFA protected NOD mice from diabetes through 35 weeks of age when administered to late-stage pre-diabetic animals (blood glucose <10 mmol/L; 180 mg/dL), to a lesser degree when administered to animals with higher blood glucose levels (10–13.9 mmol/L; 180–250 mg/dL), but not at all in animals who were already hyperglycemic. Protection was associated with post-immunization development of FoxP3+ regulatory T cells and expression of IL-10, IFN-γ and IL-4. Although it was evident that IL-10 and IFN-γ actively contributed to protection from disease progression, the role for IL-4 is less clear [11,20,37].
Our findings confirm previous observations with IFA [20] and demonstrate for the first time the ability of MAS-1 to push the immune system in the direction of a tolerogenic phenotype. The effect appears to be multifactorial since different types of Tregs may be responsible for the protective effect observed. The similarity of the immunological profile from non-diabetic NOD mice at age of 25–30 weeks with that from treated 52-week-old mice suggests that NOD mice are trying to regulate the disease process by similar mechanisms particularly with respect to IL-10 and FoxP3 expression, and that ASI with MAS-1 adjuvant, and even MAS-1 adjuvant alone, can augment this natural capacity to restore immunological tolerance to insulin perhaps by both de novo induction and amplification of pre-existing autoantigen-responsive regulatory T cells.
In humans, the appearance of high affinity insulin-specific autoantibodies in pre-diabetic individuals indicates islet autoimmune reactivity, while significant quantities of beta cells remain [38]. This is precisely the prophylactic setting when immunotherapy should ideally begin for maximum clinical benefit. Although alum is characterized by a favorable safety record, this Th2 type adjuvant lacks sufficient robustness for use with self-antigens in humans [2–4]. IFA-adjuvanted ASI with B:9-23 produces a robust regulatory immune response that protects NOD mice from progression to diabetes, but IFA lacks the requisite safety profile to be used for prevention of T1D in a prophylactic setting. Despite IFA having been evaluated for more than 70 years, it has never been licensed for any indication in any human vaccines. IFA consists largely of non-metabolizable mineral oil that remains at injection sites. It produces water-in-oil (W/O) emulsions with aqueous globules typically 3–10 μm diameter; emulsions that are highly viscous with poor syringeability and limited stability. By contrast, MAS-1 adjuvant is a blend of four metabolizable components. It forms stable, free-flowing, nanoparticular W/O emulsions previously demonstrated safe and immunologically robust when combined with self antigens in nearly 1500 patients [22–24]. In addition, a MAS-1-adjuvanted self-antigen vaccine targeting amyloid beta (A-beta), MER5101, for use in a prophylactic setting to prevent disease progression in Alzheimer’s disease has been evaluated in wild type and transgenic mouse disease models [39]. The anti-A-beta response to MER5101 was overwhelmingly by Th2 IgG isotypes, accompanied by increased levels of antigen-specific FoxP3+ regulatory T cells and increased expression of IFN-γ, IL-10, IL-2 and IL-4 cytokines, was associated with decreased amyloid-associated microglial cell activation, and resulted in improved cognitive performance [39]. These immunological observations are largely recapitulated here with MAS-1-adjuvanted IBC and B19A in the late-stage pre-diabetic NOD mouse model. In addition, MAS-1-adjuvanted self-antigen vaccines aimed at inducing neutralizing antibodies targeting GnRH and gastrin-17 in prostate and gastric adenocarcinoma patients, respectively, have been safely administered to almost 1500 subjects in over 20 clinical trials while inducing robust immune responses [22–24].
In conclusion, MAS-1-adjuvanted ASI provided long-term protection from diabetes when administered to late-stage pre-diabetic NOD mice. The MAS-1-adjuvanted insulin-derived peptide-based vaccines induced protective regulatory cellular and Th2 biased immune responses. Induction of autoantigen-specific Tregs, either de novo and/or by amplification of preexisting pools, has the potential to restore targeted immunological balance and self-tolerance [40,41] as immunological self-tolerance is maintained at least in part by Tregs that suppress self-reactive T cells in the periphery [42–45]. MAS-1-adjuvanted self-antigen vaccines have a safety profile that supports their potential use in prophylactic settings, and for repeat booster dosing should this be needed, in the absence of a cure, for life-long management of the disease. We believe that MAS-1-adjuvanted ASI has the potential to be used to restore immunological balance and self-tolerance in early-stage disease and in pre-diabetic individuals to arrest and prevent further disease progression of type 1 diabetes autoimmunity.
Supplementary Material
Acknowledgments
The authors acknowledge the late Dr. George Eisenbarth for his ideas, inspiration and mentorship.
Footnotes
Declaration of interest
P. B. as President and Founder and S. G. as a Principal Scientist have a commercial interest in Mercia Pharma, Inc. L. Z. is the guarantor of this work and had full access to all the data and takes responsibility for the integrity and the accuracy of the data. L. Z. designed, researched data and wrote the manuscript. L. Z. is supported by NIH grant U19 AI05864 and JDRF grant 10-2011-138. L. P. and L. Y. researched data. P. G., S. G. and P. B. contributed to the overall design of the program. G. S. E. contributed research design.
Supplementary material available online
References
- 1.Peakman M, von H M. Antigen-specific immunotherapy for type 1 diabetes: maximizing the potential. Diabetes. 2010;59:2087–2093. doi: 10.2337/db10-0630. [DOI] [PMC free article] [PubMed] [Google Scholar]
- 2.Axelsson S, Hjorth M, Akerman L, et al. Early induction of GAD(65)-reactive Th2 response in type 1 diabetic children treated with alum-formulated GAD(65) Diabetes Metab Res Rev. 2010;26:559–568. doi: 10.1002/dmrr.1126. [DOI] [PubMed] [Google Scholar]
- 3.Ludvigsson J, Krisky D, Casas R, et al. GAD65 antigen therapy in recently diagnosed type 1 diabetes mellitus. N Engl J Med. 2012;366:433–442. doi: 10.1056/NEJMoa1107096. [DOI] [PubMed] [Google Scholar]
- 4.Wherrett DK, Bundy B, Becker DJ, et al. Antigen-based therapy with glutamic acid decarboxylase (GAD) vaccine in patients with recent-onset type 1 diabetes: a randomised double-blind trial. Lancet. 2011;378:319–327. doi: 10.1016/S0140-6736(11)60895-7. [DOI] [PMC free article] [PubMed] [Google Scholar]
- 5.Di Lorenzo TP, Peakman M, Roep BO. Translational mini-review series on type 1 diabetes: systematic analysis of T cell epitopes in autoimmune diabetes. Clin Exp Immunol. 2007;148:1–16. doi: 10.1111/j.1365-2249.2006.03244.x. [DOI] [PMC free article] [PubMed] [Google Scholar]
- 6.Alleva DG, Crowe PD, Jin L, et al. A disease-associated cellular immune response in type 1 diabetics to an immunodominant epitope of insulin. J Clin Invest. 2001;107:173–180. doi: 10.1172/JCI8525. [DOI] [PMC free article] [PubMed] [Google Scholar]
- 7.Peakman M, Stevens EJ, Lohmann T, et al. Naturally processed and presented epitopes of the islet cell autoantigen IA-2 eluted from HLA-DR4. J Clin Invest. 1999;104:1449–1457. doi: 10.1172/JCI7936. [DOI] [PMC free article] [PubMed] [Google Scholar]
- 8.Kent SC, Chen Y, Bregoli L, et al. Expanded T cells from pancreatic lymph nodes of type 1 diabetic subjects recognize an insulin epitope. Nature. 2005;435:224–228. doi: 10.1038/nature03625. [DOI] [PubMed] [Google Scholar]
- 9.Dardenne M, Lepault F, Bendelac A, Bach JF. Acceleration of the onset of diabetes in NOD mice by thymectomy at weaning. Eur J Immunol. 1989;19:889–895. doi: 10.1002/eji.1830190516. [DOI] [PubMed] [Google Scholar]
- 10.Muir A, Peck A, Clare-Salzler M, et al. Insulin immunization of nonobese diabetic mice induces a protective insulitis characterized by diminished intraislet interferon-gamma transcription. J Clin Invest. 1995;95:628–634. doi: 10.1172/JCI117707. [DOI] [PMC free article] [PubMed] [Google Scholar]
- 11.Coon B, An LL, Whitton JL, von Herrath MG. DNA immunization to prevent autoimmune diabetes. J Clin Invest. 1999;104:189–194. doi: 10.1172/JCI7209. [DOI] [PMC free article] [PubMed] [Google Scholar]
- 12.Jaeckel E, Klein L, Martin Orozco N, von Boehmer H. Normal incidence of diabetes in NOD mice tolerant to glutamic acid decarboxylase. J Exp Med. 2003;197:1635–1644. doi: 10.1084/jem.20030215. [DOI] [PMC free article] [PubMed] [Google Scholar]
- 13.Thebault-Baumont K, Dubois-LaForgue D, Krief P, et al. Acceleration of type 1 diabetes mellitus in proinsulin 2-deficient NOD mice. J Clin Invest. 2003;111:851–857. doi: 10.1172/JCI16584. [DOI] [PMC free article] [PubMed] [Google Scholar]
- 14.Moriyama H, Abiru N, Paronen J, et al. Evidence for a primary islet autoantigen (preproinsulin 1) for insulitis and diabetes in the nonobese diabetic mouse. Proc Natl Acad Sci USA. 2003;100:10376–10381. doi: 10.1073/pnas.1834450100. [DOI] [PMC free article] [PubMed] [Google Scholar]
- 15.Martin-Pagola A, Pileggi A, Zahr E, et al. Insulin2 gene (Ins2) transcription by NOD bone marrow-derived cells does not influence autoimmune diabetes development in NOD-Ins2 knockout mice. Scand J Immunol. 2009;70:439–446. doi: 10.1111/j.1365-3083.2009.02316.x. [DOI] [PubMed] [Google Scholar]
- 16.Nakayama M, Abiru N, Moriyama H, et al. Prime role for an insulin epitope in the development of type 1 diabetes in NOD mice. Nature. 2005;435:220–223. doi: 10.1038/nature03523. [DOI] [PMC free article] [PubMed] [Google Scholar]
- 17.Coppieters KT, Dotta F, Amirian N, et al. Demonstration of islet-autoreactive CD8 T cells in insulitic lesions from recent onset and long-term type 1 diabetes patients. J Exp Med. 2012;209:51–60. doi: 10.1084/jem.20111187. [DOI] [PMC free article] [PubMed] [Google Scholar]
- 18.Daniel D, Wegmann DR. Protection of nonobese diabetic mice from diabetes by intranasal or subcutaneous administration of insulin peptide B-(9-23) Proc Natl Acad Sci USA. 1996;93:956–960. doi: 10.1073/pnas.93.2.956. [DOI] [PMC free article] [PubMed] [Google Scholar]
- 19.Alleva DG, Gaur A, Jin L, et al. Immunological characterization and therapeutic activity of an altered-peptide ligand, NBI-6024, based on the immunodominant type 1 diabetes autoantigen insulin B-chain (9-23) peptide. Diabetes. 2002;51:2126–2134. doi: 10.2337/diabetes.51.7.2126. [DOI] [PubMed] [Google Scholar]
- 20.Fousteri G, Dave A, Bot A, et al. Subcutaneous insulin B:9-23/IFA immunisation induces Tregs that control late-stage prediabetes in NOD mice through IL-10 and IFNgamma. Diabetologia. 2010;53:1958–1970. doi: 10.1007/s00125-010-1777-x. [DOI] [PMC free article] [PubMed] [Google Scholar]
- 21.Orban T, Farkas K, Jalahej H, et al. Autoantigen-specific regulatory T cells induced in patients with type 1 diabetes mellitus by insulin B-chain immunotherapy. J Autoimmun. 2010;34:408–415. doi: 10.1016/j.jaut.2009.10.005. [DOI] [PMC free article] [PubMed] [Google Scholar]
- 22.Simms MS, Scholfield DP, Jacobs E, et al. Anti-GnRH antibodies can induce castrate levels of testosterone in patients with advanced prostate cancer. Br J Cancer. 2000;83:443–446. doi: 10.1054/bjoc.2000.1315. [DOI] [PMC free article] [PubMed] [Google Scholar]
- 23.Ajani JA, Hecht JR, Ho L, et al. An open-label, multinational, multicenter study of G17DT vaccination combined with cisplatin and 5-fluorouracil in patients with untreated, advanced gastric or gastroesophageal cancer: the GC4 study. Cancer. 2006;106:1908–1916. doi: 10.1002/cncr.21814. [DOI] [PubMed] [Google Scholar]
- 24.Gilliam AD, Watson SA, Henwood M, et al. A phase II study of G17DT in gastric carcinoma. Eur J Surg Oncol. 2004;30:536–543. doi: 10.1016/j.ejso.2004.03.009. [DOI] [PubMed] [Google Scholar]
- 25.Zhang L, Nakayama M, Eisenbarth GS. Insulin as an autoantigen in NOD/human diabetes. Curr Opin Immunol. 2008;20:111–118. doi: 10.1016/j.coi.2007.11.005. [DOI] [PMC free article] [PubMed] [Google Scholar]
- 26.Babaya N, Liu E, Miao D, et al. Murine high specificity/sensitivity competitive europium insulin autoantibody assay. Diabetes Technol Ther. 2009;11:227–233. doi: 10.1089/dia.2008.0072. [DOI] [PMC free article] [PubMed] [Google Scholar]
- 27.Zhang L, Barker JM, Babu S, et al. A robust immunoassay for anti-interferon autoantibodies that is highly specific for patients with autoimmune polyglandular syndrome type 1. Clin Immunol. 2007;125:131–137. doi: 10.1016/j.clim.2007.07.015. [DOI] [PMC free article] [PubMed] [Google Scholar]
- 28.Arif S, Tree TI, Astill TP, et al. Autoreactive T cell responses show proinflammatory polarization in diabetes but a regulatory phenotype in health. J Clin Invest. 2004;113:451–463. doi: 10.1172/JCI19585. [DOI] [PMC free article] [PubMed] [Google Scholar]
- 29.Tian J, Atkinson MA, Clare-Salzler M, et al. Nasal administration of glutamate decarboxylase (GAD65) peptides induces Th2 responses and prevents murine insulin-dependent diabetes. J Exp Med. 1996;183:1561–1567. doi: 10.1084/jem.183.4.1561. [DOI] [PMC free article] [PubMed] [Google Scholar]
- 30.Achenbach P, Koczwara K, Knopff A, et al. Mature high-affinity immune responses to (pro)insulin anticipate the autoimmune cascade that leads to type 1 diabetes. J Clin Invest. 2004;114:589–597. doi: 10.1172/JCI21307. [DOI] [PMC free article] [PubMed] [Google Scholar]
- 31.Groux H, O’Garra A, Bigler M, et al. A CD4 + T-cell subset inhibits antigen-specific T-cell responses and prevents colitis. Nature. 1997;389:737–742. doi: 10.1038/39614. [DOI] [PubMed] [Google Scholar]
- 32.Sakaguchi S. Naturally arising CD4 + regulatory t cells for immunologic self-tolerance and negative control of immune responses. Annu Rev Immunol. 2004;22:531–562. doi: 10.1146/annurev.immunol.21.120601.141122. [DOI] [PubMed] [Google Scholar]
- 33.O’Shea JJ, Ma A, Lipsky P. Cytokines and autoimmunity. Nat Rev Immunol. 2002;2:37–45. doi: 10.1038/nri702. [DOI] [PubMed] [Google Scholar]
- 34.Liu E, Abiru N, Moriyama H, et al. Induction of insulin autoantibodies and protection from diabetes with subcutaneous insulin B:9-23 peptide without adjuvant. Ann N Y Acad Sci. 2002;958:224–227. doi: 10.1111/j.1749-6632.2002.tb02974.x. [DOI] [PubMed] [Google Scholar]
- 35.Devendra D, Paronen J, Moriyama H, et al. Differential immune response to B:9-23 insulin 1 and insulin 2 peptides in animal models of type 1 diabetes. J Autoimmun. 2004;23:17–26. doi: 10.1016/j.jaut.2004.03.008. [DOI] [PubMed] [Google Scholar]
- 36.Liu E, Moriyama H, Paronen J, et al. Nondepleting anti-CD4 monoclonal antibody prevents diabetes and blocks induction of insulin autoantibodies following insulin peptide B:9-23 immunization in the NOD mouse. J Autoimmun. 2003;21:213–219. doi: 10.1016/s0896-8411(03)00116-1. [DOI] [PubMed] [Google Scholar]
- 37.Bot A, Smith D, Bot S, et al. Plasmid vaccination with insulin b chain prevents autoimmune diabetes in nonobese diabetic mice. J Immunol. 2001;167:2950–2955. doi: 10.4049/jimmunol.167.5.2950. [DOI] [PubMed] [Google Scholar]
- 38.Yu L, Miao D, Scrimgeour L, et al. Distinguishing persistent insulin autoantibodies with differential risk: nonradioactive bivalent proinsulin/insulin autoantibody assay. Diabetes. 2012;61:179–186. doi: 10.2337/db11-0670. [DOI] [PMC free article] [PubMed] [Google Scholar]
- 39.Liu B, Frost JL, Sun J, et al. MER5101, a novel abeta1-15:DT conjugate vaccine, generates a robust anti-abeta antibody response and attenuates abeta pathology and cognitive deficits in APPswe/PS1DeltaE9 transgenic mice. J Neurosci. 2013;33:7027–7037. doi: 10.1523/JNEUROSCI.5924-12.2013. [DOI] [PMC free article] [PubMed] [Google Scholar]
- 40.Wing K, Sakaguchi S. Regulatory T cells exert checks and balances on self tolerance and autoimmunity. Nat Immunol. 2010;11:7–13. doi: 10.1038/ni.1818. [DOI] [PubMed] [Google Scholar]
- 41.Staeva-Vieira T, Peakman M, von H M. Translational mini-review series on type 1 diabetes: immune-based therapeutic approaches for type 1 diabetes. Clin Exp Immunol. 2007;148:17–31. doi: 10.1111/j.1365-2249.2007.03328.x. [DOI] [PMC free article] [PubMed] [Google Scholar]
- 42.Wing K, Sakaguchi S. Regulatory T cells exert checks and balances on self tolerance and autoimmunity. Nat Immunol. 2010;11:7–13. doi: 10.1038/ni.1818. [DOI] [PubMed] [Google Scholar]
- 43.Tonkin DR, He J, Barbour G, Haskins K. Regulatory T cells prevent transfer of type 1 diabetes in NOD mice only when their antigen is present in vivo. J Immunol. 2008;181:4516–4522. doi: 10.4049/jimmunol.181.7.4516. [DOI] [PubMed] [Google Scholar]
- 44.Bisikirska BC, Herold KC. Regulatory T cells and type 1 diabetes. Curr Diab Rep. 2005;5:104–109. doi: 10.1007/s11892-005-0036-x. [DOI] [PubMed] [Google Scholar]
- 45.Grinberg-Bleyer Y, Baeyens A, You S, et al. IL-2 reverses established type 1 diabetes in NOD mice by a local effect on pancreatic regulatory T cells. J Exp Med. 2010;207:1871–1878. doi: 10.1084/jem.20100209. [DOI] [PMC free article] [PubMed] [Google Scholar]
Associated Data
This section collects any data citations, data availability statements, or supplementary materials included in this article.