

Summary
Hepatitis C virus (HCV) readily sets up persistence after acute infection. Cellular immune responses are thought to play a major role in control of the virus. Failure of CD4+ T-cell responses in acute disease is associated with viral persistence but the dynamics of this are poorly understood. We aimed to assess such responses using a novel set of Class II tetrameric complexes (tetramers) to study helper T-cells ex vivo in acute disease. We analysed the HCV-specific CD4+ T-cell response in a patient with acute hepatitis c infection. We were able to track the virus-specific CD4+ T-cells directly ex vivo with HLA DR4 tetramers. Proliferative responses were absent initially, recovered as viral load dropped and were lost again during relapse. Longitudinal tetramer analyses showed expanded populations of antiviral CD4+ T-cells throughout acute infection despite lack of proliferation. A pattern of transient CD4+ T-cell proliferative responses as HCV is partially controlled is observed. Failure to control virus is associated with emergence of ‘dysfunctional’ CD4+ T-cell populations. Failure to control HCV in acute disease may relate to the capacity to sustain efficient immune responses as virus attempts to ‘bounce back’ after partial control.
Keywords: acute hepatitis C, CD4+ T-cell, Class II tetrameric complexes, hepatitis C virus
Introduction
Hepatitis C virus (HCV) has emerged as a major cause of liver disease worldwide. The majority of those infected develop persistent viremia, which may be associated with progressive liver fibrosis, cirrhosis and hepatocellular carcinoma. Cellular immune responses are thought to play a major role in control of the virus acutely, and may also contribute to the immunopathogenesis of hepatic damage. In particular, MHC Class II restricted CD4+ T-cells have been linked to disease resolution, both in genetic studies and also in functional analyses [1, 2]. Failure of CD4+ T-cell responses is associated with viral persistence [3, 4], and chronic infection is typified in many studies by relatively weak CD4+ T-cell responses, compared with those where infection is controlled [5–7]. Most analyses of CD4+ T-cell responses have, however, relied on functional assays, particularly of proliferative capacity ex vivo. Thus, the mechanism behind apparent loss of CD4+ T-cell responses has not been dissected and it is not clear whether such cells are physically deleted or still present but fail to respond in culture. Furthermore, the dynamics of this process in acute HCV – where it is most relevant – have not been addressed.
We and others have previously studied CD8+ T-cell responses during acute and post-acute HCV infection using Class I tetramers [8–11]. Such reagents have revealed novel features of the CD8+ T-cell response in acute, resolved and persistent infection and, importantly, have allowed the analysis of T-cells ex vivo independent of their function. Indeed T-cell populations have been repeatedly observed [10–12] which, during acute infection show weak cytokine secretion. Typically, in acute infection progressing to chronicity, studies using tetramers show that CD8+ T-cell populations are induced, but not sustained in the blood [13]. Similar reagents for the study of CD4+ T-cell responses have recently become available [14]. The development of such tools has been slower than that for the analysis of CD8+ T-cells because of technical issues relating to the stable refolding of MHC Class II peptide complexes, and partly because of the relatively low frequency of CD4+ T-cells in blood, which demands the use of enrichment techniques in order to reliably visualize T-cell populations. A recent study using such tools to analyse CD4+ T-cell responses to HCV showed maintenance of robust populations of tetramer+ T-cells in those which resolved in infection, although no tetramer staining populations were observed in individuals with established chronic infection [15]. These studies are limited by the restricted HLA type and peptide specificity which can be analysed, but gave a first glimpse into the populations which can be observed in a steady state.
A further measure which can be assessed using such tools is the surface ‘phenotype’ of circulating T-cell populations. T-cells express markers which indicate their homing ability and the so-called maturation state [16]. Effector T-cell populations typically lack lymph node homing markers such as CCR7 and CD62L, while resting or ‘central’ memory T-cells generally express these molecules. T-cells which have been continuously stimulated over time may also lose expression of the molecule CD27, as has been shown in studies of CD4+ and CD8+ T-cell responses to persistent infections such as EBV and CMV [17, 18].
We identified one subject who exhibited an important pattern of HCV infection, in whom partial resolution of infection was followed by clinical relapse. This person was subsequently treated using interferon-alpha therapy. The appropriate tissue type (HLA DRB1*0401) of this patient allowed us to track, for the first time in detail, the evolution of CD4+ T-cell responses during an ‘unsuccessful’ immune response - in terms of frequency, function and phenotype.
Methods
Patients
In this study, one patient with acute hepatitis C infection was included. Acute hepatitis C was diagnosed by all of the following: acute onset of hepatitis in a previously healthy individual, aminotransferases over 10× the upper limit of normal, exclusion of other infectious, metabolic or toxic causes of hepatitis. The patient gave informed consent to participate in the study, and the protocol and the procedures of the study were conducted in conformity with the ethical guidelines of the Declaration of Helsinki.
HCV proteins
Recombinant HCV proteins were kindly provided by M. Houghton (Chiron, Emeryville, CA, USA) comprising the core, NS3, NS4 and NS5 region of the HCV polyprotein [C22-3 = aa 1–119, C200 = aa 1192–1931, NS5 = aa 2054–2995 and c25 (fusion protein of core and C200)]. All proteins were expressed as COOH-terminal fusion proteins with human superoxide dismutase (SOD) in yeast (Saccharomyces cerevisiae). Proteins were purified to >90%.
Peripheral blood mononuclear cells proliferation assay
Peripheral blood mononuclear cells (PBMC) were isolated on Ficoll-Hypaque gradients (Biochrom, Berlin, Germany) and washed four times in PBS. PBMCs (5 × 10⁴ per well) were incubated in 96-well U-bottom plates (TPP, Trasadingen, Switzerland) for 5 days in the presence of HCV proteins (2 μg/mL; C22-3, C200 and NS5) in 150 μL of tissue culture medium (RPMI 1640 medium; Gibco, Grand Island, NY, USA) containing 2 mM l-glutamine, 1 mm sodium pyruvate, 100 U of penicillin per millilitre, 100 μg of streptomycin per millilitre and 5% human AB serum. Cultures were labelled by incubation for 16 h with 2 μCi of 3H-thymidine (specific activity, 80 mCi/mmol; Amersham, Little Chalfont, UK). The cells were collected and washed on filters (Dunn, Asbach, Germany) by using a cell harvester (Skatron, Sterling, VA, USA), and the amount of radiolabel incorporated into DNA was estimated with a beta counter (LKB/Pharmacia, Uppsala, Sweden). Triplicate cultures were assayed routinely, and the results are expressed as mean counts per minute. The stimulation index (SI) was calculated as the ratio of counts per minute obtained in the presence of antigen to that obtained without antigen. An SI of >3 was considered significant.
Cytokine secretion assay
An interferon-gamma (IFN-γ) and interleukin-2 (IL-2) or an IFN-γ secretion cell enrichment and detection kit was used to enrich the IFN-γ or IL-2 secreting CD4+ T-cells following the manufacturer's instructions (Miltenyi Biotec, Bergisch-Gladbach, Germany). In brief, PBMC (1–10 × 106 cells) were resuspended in tissue culture medium. Cells were incubated for 16 h either with 1 μg/mL pool of HCV proteins (C25 and NS5) at 37 °C in 5% CO2. Human SOD (equimolar concentration) served as a negative control. Cell surface detection of IFN-γ-secreted or IL-2-secreted molecules was performed as follows: cells were labelled for 5 min at 4 °C with an IFN-γ-specific and/or IL-2-specific high-affinity capture matrix (Miltenyi Biotec). Afterwards, cells were transferred into 37 °C medium for 45 min to permit secretion of IFN-γ and/or IL-2, washed, and stained for 30 min at 4 °C with FITC-conjugated anti-CD4 (Miltenyi Biotec), APC-conjugated anti-IFN-γ mAb, PE-conjugated anti-IL-2 mAB (Miltenyi Biotec), PerCP-conjugated anti-CD14, anti-CD19 and Viaprobe (all Becton Dickinson, Oxford, UK). Ten percentage of each cell sample was then analysed by flow cytometry (pre-enrichment sample), while the remaining cells were washed and magnetically labelled for 15 min at 4 °C with anti-PE and anti-APC mAb microbeads (Miltenyi Biotec), as previously described [15]. APC-conjugated IFN-γ+ cells and PE-conjugated IL-2+ cells were enriched in two rounds of positive selection by magnetic cell sorting (post-enrichment sample) and analysed by flow cytometry. Cells were gated on the CD4+, CD14−, CD19− and Viaprobe− population. Total number of CD4+ cells in the post-enrichment sample was calculated by multiplication of the total number of CD4+, CD14−, CD19− and Viaprobe− cells in the pre-enrichment sample by 9. The correction factor allows the calculation of the input number of CD4+ in the post-enrichment fraction. The frequency of cytokine+ cells was determined by dividing the number of CD4+ cytokine+ cells after enrichment by the total number of CD4+ cells.
MHC Class II tetramer staining on peripheral blood mononuclear cells
The following MHC Class II tetramers (DRB1*0401) were used: HCV 1248 GYKVLVLNPSVAATL, HCV 1579 SGENLPYLVAYQATVCARA, HCV 1770 SGIQYLAGLSTLPGNPAIASL, annexin II (res. 208–223) and the unchanged CLIP [15]. For tetramer formation, biotinylated DR/peptide complexes were incubated with PE-labelled streptavidin for at least 1 h on ice, at a 4:1 molar ratio of DR:streptavidin and a final DR concentration of 0.2 mg/mL. PBMC were stained in 100 μL medium (RPMI, 10% fetal calf serum, 2 mm glutamine, 50 U/mL Penicillin–Streptomycin) with 2 μg of PE-conjugated MHC Class II tetramer for 2 h at room temperature. APC-conjugated anti-CD4, PerCP-conjugated anti-CD14, PerCP-conjugated anti-CD19, Viaprobe (Becton Dickinson), and either FITC-conjugated anti-CD27 (R and D Systems, Minneapolis, MN, USA) or anti-CCR7 monoclonal antibodies (Becton Dickinson) were added at least 20 min of incubation. Cells were washed twice and then stained with anti-PE microbeads for 20 min at 4 °C. The cells were then washed once and 90% of cells were applied to MS columns according to manufacturer's instructions. The other 10% were reserved for FACS analysis (pre-enrichment sample). The PE positive cell were eluted from the column (post-enrichment sample) and analysed by FACS. Cells were gated on the CD4+, CD14−, CD19− and Viaprobe− population. The total number of CD4+ cells in the post-enrichment sample was calculated by multiplication of the total number of CD4+, CD14−, CD19− and Viaprobe− cells in the pre-enrichment sample by 9 as for cytokines. The frequency of tetramer+ cells was determined by dividing the number of CD4+ tetramer+ cells after enrichment by the total number of input CD4+ cells.
Results
Clinical course
Figure 1 shows data from an individual in whom detailed analyses of T-cell proliferative function were made throughout the course of acute infection and then early treatment (shaded area). Initially (early phase) there is partial control of the viral load (middle trace), associated with liver inflammation (as measured through blood ALT levels; upper trace). The viral load is controlled to a nadir point (marked by arrow), but subsequently rises again. During the relapse, although viral load rises significantly, the level of liver inflammation (reflecting the numbers of activated antiviral lymphocytes [13]) is much weaker than in the first phase. Similar clinical data have been observed in other cases [3].
Fig. 1.
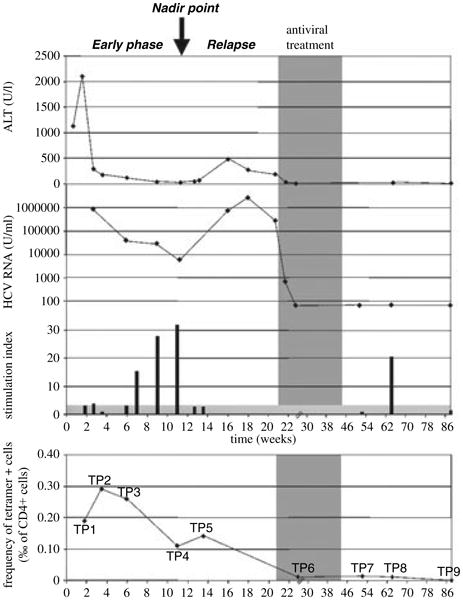
Kinetics of virus and T-cell responses in acute infection. Data from a single individual are shown, in whom clinical and T-cell proliferation data are plotted over time. Early interferon-alpha/ribavirin therapy was instituted (shaded area), leading to resolution of infection. The upper trace shows ALT, the middle trace shows viral load and the lower bars show proliferative responses to HCV non-structural (NS) proteins (NS3/4) over time. Standard [3H] thymidine incorporation assays were used [3] with a stimulation index >3 considered significant. The lowest trace shows MHC Class II tetramer staining (pool of DRB1*0401-HCV 1248, 1579 and 1770 tetramers) over time, as described previously [15, 21]. The scale of the y-axis is shown in ‰ (i.e. 0.1% = 1‰).
T-cell analysis
Proliferative responses to HCV antigens show a peak around the point of lowest viral load. Prior to this, in early acute disease, they are weak or absent, and then lost again during relapse. To understand this phenomenon, we took advantage of recently described MHC Class II tetramers [15] and the appropriate HLA type (HLA DRB1*0401) of the this patient, to track CD4+ T-cells directly ex vivo through these three phases.
The NS3-specific response was mapped using an overlapping peptide approach and found to include responses to peptide NS3 1248–1260 [1, 19] (data not shown). Tetramers using HLA DRB1*0401 were used coupled to this peptide as well as two other well-recognized peptides (see Section ‘Methods’) [15]. The percentage of CD4+ T-cells staining positive for these tetramers over time is shown in Fig. 1 (lowest trace). We identified a significant tetramer+ population during the early phase, when proliferative responses were undetectable (Fig. 2, e.g. timepoint 2). At the nadir point, when viral load had fallen to 6000 U/mL, a strong proliferative response was detectable (Fig. 2, timepoint 4). During the relapse phase, when tetramer responses were still detectable, the proliferative response again became undetectable (Fig. 2, timepoint 5). After therapy, virus was controlled for long term, with very small but still detectable tetramer+ populations at timepoints 7 and 8, although undetectable at timepoint 9 (88 weeks post-infection; data not shown).
Fig. 2.
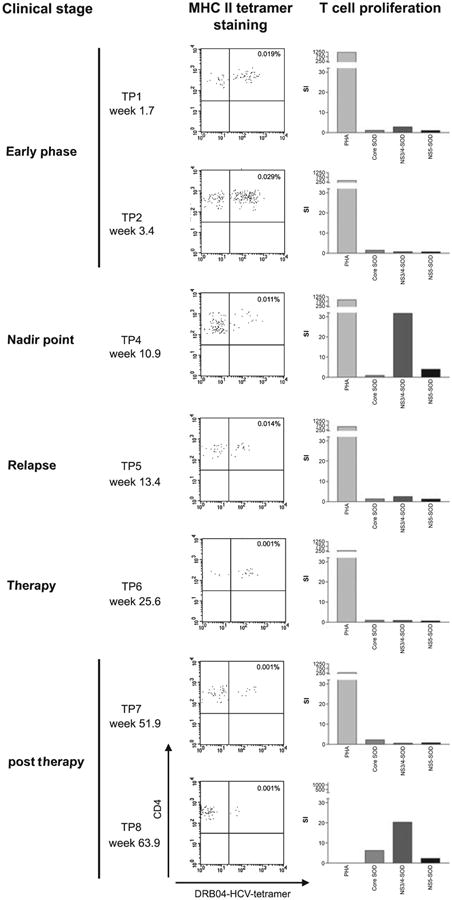
Illustration of ex vivo tetramer staining during acute infection. FACS plots from sequential timepoints of the patient are shown (left-hand panels). The y-axis of each plot represents CD4 staining and the x-axis represents tetramer (pool of DRB1*0401-HCV 1248, 1579 and 1770 tetramers) staining. Plots are gated on live lymphocytes and exclude B cells and monocytes. Control stainings are typically negative using this technique [15]. The stimulation index from proliferative assays from the same timepoints are also shown (right-hand panels).
Analysis of phenotype and function
Tetramer+ CD4+ T-cells in the early phase (e.g. timepoint 2) were found to show a CCR7 low (effector) as opposed to a CCR7 high (central) phenotype (Fig. 3a,b). Cells stained from the relapse phase (e.g. timepoint 5) showed a slightly higher degree of CCR7 expression. Tetramer+ populations post-treatment were too small to allow accurate phenotypic analysis. Staining for CD27 during the early phase, showed a largely CD27+ phenotype, which was maintained. Only small populations of CD27-cells were seen at early time-points (Fig. 3b, middle panel).
Fig. 3.

Phenotype and function of antiviral CD4+ T-cell responses. (a) Analysis of CCR7 expression over time on tetramer+ CD4+ T-cells (pool of DRB1*0401-HCV 1248, 1579 and 1770 tetramers). (b) Representative data for CCR7 staining (left-hand panel), CD27 staining (middle panel) and cytokine secretion (right-hand panel) from TP2/3. CD27 expression at TP1 and TP3 was similar. Cytokine secretion/enrichment analysis was as described in Section ‘Methods’, and unstimulated controls showed no secretion. Percentage of cells in each quadrant is shown. In all cases, plots are gated on CD14−/Viaprobe−/CD19− cells.
Antigen-specific CD4+ T-cells were stimulated in vitro and the culture supernatants were analysed using a Bio-Plex cytokine assay (Table 1). At early time points, IFN-γ was present in the supernatants, despite the lack of proliferation. This IFN-γ secretion was confirmed by an ex vivo surface cytokine capture assay, which also showed very weak IL-2 secretion (Fig. 3b). At the nadir point, IFN-γ secretion was still detectable, however, this was not detected during the relapse period (Table 1).
Table 1. Summary analysis of phenotype, function and presumptive ‘status’ of CD4+ T-cells over time.
| Clinical phase | Controlling | Critical point | Relapse |
|---|---|---|---|
| Weeks/TP | 5.9/TP3 | 10.9/TP4 | 13.4/TP5 |
| Viral load (U/mL) | 41 000 | 6000 | 770 000 |
| ALT (U/L) | 110 | 17 | 483 |
| T-cell proliferation (stimulation index) | − | +++ | − |
| IFN-γ in supernatant (pg/mL) | + | + | − |
| MHC Class II tetramer | +++ | ++ | ++ |
Discussion
Overall these data provide novel insight into the functional status of CD4+ T-cells during HCV infection, and indeed are the first data using such novel tools to examine any acute human infection in detail. Although MHC Class II tetramer staining has been used to examine T helper cell responses ex vivo in resolved HCV [15] and also influenza [20, 21] infection, in these cases, a close link between ex vivo staining and functional assays (such as proliferation) was maintained. Here we identified three distinct states of the CD4+ T-cell population with regard to function and phenotype. Initially, T-cells appear driven towards an effector status, with maintenance of IFN-γ secretion and low proliferative capacity [16, 22]. At the nadir point of viral load, proliferative capacity has recovered and a mixed effector/central memory status might be assigned. Effector function (IFN-γ secretion, proliferative capacity) appears to be lost again during viral relapse, although the CD4+ frequencies here are low.
We have recently described one case – individual 01-40 – who presented with acute infection and spontaneously resolved disease [15]. Samples taken at timepoints 3 and 4 months after presentation (equivalent to TP5–6 in P3) showed strong tetramer+ populations which were largely CCR7+ and accompanied by proliferative responses [15]. Further longitudinal studies will be required to establish at which point differences between ‘successful’ and ‘unsuccessful’ CD4+ T-cell responses emerge.
The biphasic nature of the viral infection and immune responses highlighted here has been previously noted in acute HCV infection [3, 12]. It seems possible that failure to control HCV is linked to a failure to sustain CD4+ T-cell responses over time, as judged by the lack of ex vivo proliferation or IFN-γ secretion, poor in vivo expansion of tetramer+ cells and minimal liver inflammation in the relapse phase and may be potentially linked to the emergence of T regulatory populations, which have been observed in chronic HCV [23]. Whether such phenomena are causal or result from failure of other arms of the immune response [as we have postulated previously based on the lymphocytic choriomeningitis virus (LCMV) model], is not clear [24]. In the case of LCMV, failure of CD8+ T-cells, followed by escape from neutralizing antibody responses leads ultimately to failure of CD4+ T-cells and their deletion [25, 26]. These murine experiments showed a biphasic profile of viral load very similar to the pattern observed here. In humans and in chimpanzee models, loss of CD4+ T-cell proliferation is very common in HCV progressing onto persistence [4]. Failure to maintain these populations or to provide help for CD8+ T-cells could have significant impacts on long-term control of HCV [27].
The use of Class II tetramers may be readily extended to other areas, although enrichment techniques are likely to be necessary in many cases to identify antigen-specific T-cell populations outside the peak of acute infection. Tetramer-based assays for helper cells along with functional assays allow real definition for the first time of the status of CD4+ T-cell populations during acute and persistent infection and will have an important role to play in defining the correlates of protection in HCV and other major viral infections of man. Finally, the nature of the viral ‘bounce back’ phenomenon is of clinical relevance as acute HCV infection which goes onto chronicity may pass through a transient period where virus is apparently controlled. Appropriate monitoring should be instituted, as early therapy, as used in these cases, is highly effective.
Acknowledgments
We thank Scott Ward, Cheryl Day, Sophie Sierro, Gillian Harcourt and Andrew D. Lucas for helpful discussion. Jutta Doehrmann, Carmen Amsel and Christine Falk for excellent technical help. This work was supported by the EU (QLK2-CT-2002-01329), Bundesministerium fuer Bildung und Forschung (Kompetenznetzwerk Hepatitis), Wellcome Trust and the National Institute of Health (AI45757).
Abbreviations
- HCV
hepatitis C virus
- SOD
superoxide dismutase
- PBMC
peripheral blood mononuclear cells
- SI
stimulation index
- IFN-g
interferon-gamma
- IL-2
interleukin-2
- NS
non-structural
References
- 1.Diepolder HM, Gerlach JT, Zachoval R, et al. Immunodominant CD4+ T-cell epitope within nonstructural protein 3 in acute hepatitis C virus infection. J Virol. 1997;71(8):6011–6019. doi: 10.1128/jvi.71.8.6011-6019.1997. [DOI] [PMC free article] [PubMed] [Google Scholar]
- 2.Thursz M, Yallop R, Goldin R, Trepo C, Thomas HC. Influence of MHC class II genotype on outcome of infection with hepatitis C virus. The HENCORE group.Hepatitis C European Network for Cooperative Research. Lancet. 1999;354(9196):2119–2124. doi: 10.1016/s0140-6736(99)91443-5. [DOI] [PubMed] [Google Scholar]
- 3.Gerlach J, Diepolder H, Jung MC, et al. Recurrence of HCV after loss of virus specific CD4+ T cell response in acute Hepatitis C. Gastroenterology. 1999;117:933–941. doi: 10.1016/s0016-5085(99)70353-7. [DOI] [PubMed] [Google Scholar]
- 4.Missale G, Bertoni R, Lamonaca V, et al. Different clinical behaviours of acute HCV infection are associated with different vigor of the anti-viral T cell response. J Clin Invest. 1996;98:706–714. doi: 10.1172/JCI118842. [DOI] [PMC free article] [PubMed] [Google Scholar]
- 5.Godkin A. Characterization of novel HLA-DR11-restricted HCV epitopes reveals both qualitative and quantitative differences in HCV-specific CD4+ T cell responses in chronically infected and non-viremic patients. Eur J Immunol. 2001;31:1438–1446. doi: 10.1002/1521-4141(200105)31:5<1438::AID-IMMU1438>3.0.CO;2-2. [DOI] [PubMed] [Google Scholar]
- 6.Naumov N. HCV specific CD4+ T cells: do they help or damage. Gastroenterology. 1999;117:1012–1014. doi: 10.1016/s0016-5085(99)70361-6. [DOI] [PubMed] [Google Scholar]
- 7.Day CL, Lauer GM, Robbins GK, et al. Broad specificity of virus-specific CD4+ T-helper-cell responses in resolved hepatitis C virus infection. J Virol. 2002;76(24):12584–91255. doi: 10.1128/JVI.76.24.12584-12595.2002. [DOI] [PMC free article] [PubMed] [Google Scholar]
- 8.He XS, Rehermann B, Lopez-Labrador F, et al. Quantitative analysis of HCV-specific CD8+ T cells in peripheral blood and liver using peptide-MHC tetramers. Proc Natl Acad Sci U S A. 1999;96:5692–5697. doi: 10.1073/pnas.96.10.5692. [DOI] [PMC free article] [PubMed] [Google Scholar]
- 9.Wedemeyer H, He XS, Nascimbeni M, et al. Impaired effector function of hepatitis C virus-specific CD8+ T cells in chronic hepatitis C virus infection. J Immunol. 2002;169(6):3447–3458. doi: 10.4049/jimmunol.169.6.3447. [DOI] [PubMed] [Google Scholar]
- 10.Lechner F, Wong DK, Dunbar PR, et al. Analysis of successful immune responses in persons infected with hepatitis C virus. J Exp Med. 2000;191(9):1499–1512. doi: 10.1084/jem.191.9.1499. [DOI] [PMC free article] [PubMed] [Google Scholar]
- 11.Thimme R, Oldach D, Chang KM, Steiger C, Ray SC, Chisari FV. Determinants of viral clearance and persistence during acute hepatitis C virus infection. J Exp Med. 2001;194(10):1395–1406. doi: 10.1084/jem.194.10.1395. [DOI] [PMC free article] [PubMed] [Google Scholar]
- 12.Gruener NH, Lechner F, Jung MC, et al. Sustained dysfunction of antiviral CD8+ T lymphocytes after infection with HCV. J Virol. 2001;75(12):5550–5558. doi: 10.1128/JVI.75.12.5550-5558.2001. [DOI] [PMC free article] [PubMed] [Google Scholar]
- 13.Lechner F, Gruener N, Urbani S, et al. CTL responses are induced during acute HCV infection but are not sustained. Eur J Immunol. 2000;30:2479–2487. doi: 10.1002/1521-4141(200009)30:9<2479::AID-IMMU2479>3.0.CO;2-B. [DOI] [PubMed] [Google Scholar]
- 14.Novak EJ, Liu AW, Nepom GT, Kwok WW. MHC class II tetramers identify peptide-specific human CD4(+) T cells proliferating in response to influenza A antigen. J Clin Invest. 1999;104(12):R63–R67. doi: 10.1172/JCI8476. see comments. [DOI] [PMC free article] [PubMed] [Google Scholar]
- 15.Day CL, Seth NP, Lucas M, et al. Ex vivo analysis of human memory CD4 T cells specific for hepatitis C virus using MHC class II tetramers. J Clin Invest. 2003;112(6):831–842. doi: 10.1172/JCI18509. [DOI] [PMC free article] [PubMed] [Google Scholar]
- 16.Sallusto F, Langenkamp A, Geginat J, Lanzavecchia A. Functional subsets of memory T cells identified by CCR7 expression. Curr Top Microbiol Immunol. 2000;251:167–171. doi: 10.1007/978-3-642-57276-0_21. [DOI] [PubMed] [Google Scholar]
- 17.Amyes E, Hatton C, Montamat-Sicotte D, et al. Characterization of the CD4+ T cell response to Epstein-Barr virus during primary and persistent infection. J Exp Med. 2003;198(6):903–911. doi: 10.1084/jem.20022058. [DOI] [PMC free article] [PubMed] [Google Scholar]
- 18.Appay V, Dunbar PR, Callan M, et al. Memory CD8+ T cells vary in differentiation phenotype in different persistent virus infections. Nat Med. 2002;8(4):379–385. doi: 10.1038/nm0402-379. [DOI] [PubMed] [Google Scholar]
- 19.Diepolder H, Zachoval R, Hoffman R, et al. Possible mechanism involving T lymphocyte response to NS3 in viral clearance in acute HCV infection. Lancet. 1995;346:1006–1007. doi: 10.1016/s0140-6736(95)91691-1. [DOI] [PubMed] [Google Scholar]
- 20.Danke NA, Kwok WW. HLA class II-restricted CD4+ T cell responses directed against influenza viral antigens postinfluenza vaccination. J Immunol. 2003;171(6):3163–3169. doi: 10.4049/jimmunol.171.6.3163. [DOI] [PubMed] [Google Scholar]
- 21.Lucas M, Day CL, Wyer JR, Cunliffe SL, McMichael A, Klenerman P. Direct ex vivo analysis of influenza-specific CD4+ T cell populations. J Virol. 2004;78(13):7284–7287. doi: 10.1128/JVI.78.13.7284-7287.2004. [DOI] [PMC free article] [PubMed] [Google Scholar]
- 22.Day CL, Walker BD. Progress in defining CD4 helper cell responses in chronic viral infections. J Exp Med. 2003;198(12):1773–1777. doi: 10.1084/jem.20031947. [DOI] [PMC free article] [PubMed] [Google Scholar]
- 23.Sugimoto K, Ikeda F, Stadanlick J, Nunes FA, Alter HJ, Chang KM. Suppression of HCV-specific T cells without differential hierarchy demonstrated ex vivo in persistent HCV infection. Hepatology. 2003;38(6):1437–1448. doi: 10.1016/j.hep.2003.09.026. [DOI] [PubMed] [Google Scholar]
- 24.Klenerman P, Lechner F, Kantzanou M, Ciurea A, Hengartner H, Zinkernagel R. Viral escape and the failure of cellular immune responses. Science. 2000;289(5487):2003. doi: 10.1126/science.289.5487.2003a. [DOI] [PubMed] [Google Scholar]
- 25.Ciurea A, Klenerman P, Hunziker L, et al. Viral persistence in vivo through selection of neutralizing antibody-escape variants. Proc Natl Acad Sci U S A. 2000;97(6):2749–2754. doi: 10.1073/pnas.040558797. [DOI] [PMC free article] [PubMed] [Google Scholar]
- 26.Ciurea A, Hunziker L, Klenerman P, Hengartner H, Zinkernagel R. Impairment of CD4(+) T cell responses during chronic virus infection. J Exp Med. 2001;193(3):297–306. doi: 10.1084/jem.193.3.297. [DOI] [PMC free article] [PubMed] [Google Scholar]
- 27.Grakoui A, Shoukry NH, Woollard DJ, et al. HCV persistence and immune evasion in the absence of memory T cell help. Science. 2003;302(5645):659–662. doi: 10.1126/science.1088774. [DOI] [PubMed] [Google Scholar]