

Abstract
E.coli class I ribonucleotide reductase (RNR) catalyzes the conversion of nucleotides to deoxynucleotides and is composed of two subunits: α2 and β2. β2 contains a stable di-iron tyrosyl radical (Y122•) cofactor required to generate a thiyl radical (C439•) in α2 over a distance of 35 Å, which in turn initiates the chemistry of the reduction process. The radical transfer process is proposed to occur by proton-coupled electron transfer (PCET) via a specific pathway: Y122 ⇆ W48[?] ⇆ Y356 in β2, across the subunit interface to Y731⇆ Y730 ⇆ C439 in α2. Within α2 a co-linear PCET model has been proposed. To obtain evidence for this model, 3-amino tyrosine (NH2Y) replaced Y730 in α2 and this mutant was incubated with β2, CDP and ATP to generate a (NH2Y730•) in D2O. [2H]-Electron-nuclear double resonance (ENDOR) spectra at 94 GHz of this intermediate were obtained and together with DFT models of α2 and quantum chemical calculations allowed assignment of the prominent ENDOR features to two hydrogen bonds likely associated with C439 and Y731. A third proton was assigned to a water molecule in close proximity (2.2 Å O-H---O distance) to residue 730. The calculations also suggest that the unusual g-values measured for NH2Y730• are consistent with the combined effect of the hydrogen bonds to Cys439 and Tyr731, both nearly perpendicular to the ring plane of NH2Y730. The results provide the first experimental evidence for the hydrogen bond network between the pathway residues in α2 of the active RNR complex, for which no structural data is available.
Keywords: RNR, proton-coupled electron transfer, high-field ENDOR, DFT, hydrogen bond network
Introduction
Ribonucleotide reductases (RNRs) convert nucleotides (NDPs) to their corresponding deoxynucleotides (dNDPs) in all organisms based on a catalytic mechanism which involves highly controlled radical chemistry.1,2 These enzymes are responsible for generating a balanced pool of the deoxynucleoside triphosphates (dNTPs) and provide the monomeric precursors for DNA replication and repair3. The E. coli class Ia RNR is composed of two homodimeric subunits α2 and β2, which form an α2β2 complex during nucleotide turnover. β2 harbours a stable di-iron tyrosyl radical (Y122•) cofactor, which is essential for catalysis. Each turnover requires radical propagation from Y122• to the active site in α2, where a cysteinyl radical C439• is generated and initiates nucleotide reduction. A model for radical propagation has been postulated (Figure 1) based on in silico docking of the X-ray structures of the individual subunits, and requires that Y122• is ∼ 35 Å removed from C439• 4,5. Using PELDOR spectroscopy, our distance measurements between Y122• and a nitrogen radical from the mechanism-based inhibitor 2′-azido-2′-deoxyuridine 5′-diphosphate trapped in the active site of α2 provided the first evidence for the long distance between the two sites.6
Fig 1.
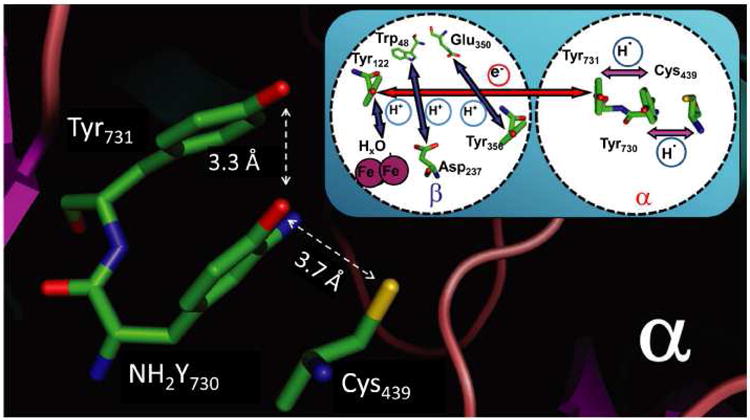
Crystal structure of the Y730NH2Y-α2 mutant of E. coli RNR from19 (molecule A) showing the residues Y731, NH2Y730 and C439 in the PCET pathway. The O-O distance and the O-S distance between the essential amino acid residues are marked. The inset shows the current model for the long-range (∼ 35 Å), reversible PCET starting at Y122 in β2 and reaching C439 in α2. Note that the position of Y356 is unknown as the C-terminus is disordered in all X-ray structures of β2.
The unprecedented mechanism for radical initiation over a pathway of conserved redox active amino acids, Y122• ⇆ [W48?] ⇆ Y356 on β2 and Y731⇆ Y730 ⇆ C439 in α2, has attracted considerable attention in the past decade. Mutagenesis studies provided the first experimental support for the importance of the proposed pathway residues.7,8 However, recent studies using site-specifically incorporated unnatural tyrosine analogs with altered redox potentials and pKas in place of pathway residues9-11 and studies with photo-initiated RNRs12 have suggested a more detailed chemical mechanism for this long-range oxidation. Specifically co-linear and orthogonal proton-coupling to the electron transfer (PCET) steps within α2 and β2 respectively, have been proposed.13,16 The mechanism of oxidation across the subunit interface remains unclear, as the C-terminal 35 amino acids of E. coli β2, which include pathway residue Y356, are not visible in the structure.
The original crystallographic data of α2,- indicated that the orientation of Y731 and Y730 relative to each other (Figure 1, inset) is unusual and suggested a co-linear PCET mechanism14-17 The importance of Y731 and Y730 in the initiation process is supported by a number of different types of experiments. Mutagenesis studies in which Y731 and Y730 were replaced by F were inactive and the structures of the mutant-α2s were not perturbed, demonstrating their importance.8 The first direct support for the redox role of Y356, Y730 and Y731 was obtained by site-specific incorporation of a variety of tyrosine analogues using either expressed protein ligation18 or the suppressor tRNA/aminoacyl-tRNA synthetase (RS) methodology11. The insertion of 3-aminotyrosine (NH2Y) in place of each of these Ys, for example, revealed that the Y122• can oxidize NH2Y to an amino tyrosyl radical (NH2Y•) in the presence of the appropriate substrate and allosteric effector pair, while retaining low levels of enzymatic activity.11,19,20 Thus, the NH2Y•s, produced in a kinetically competent fashion, represent excellent mechanistic probes of a pathway radical intermediate involved in nucleotide reduction.
The radical generated in NH2Y730-α2 E. coli RNR was recently characterized by multifrequency EPR spectroscopy21 and revealed unprecedented g-values (gx = 2.0052, gy = 2.0042 and gz = 2.0022) suggesting that it resides in an environment with unusual electrostatic and H-bond interactions.22 This study prompted us to examine in more detail the structure around NH2Y730• to find evidence for the proposed intermolecular hydrogen bonding network to the next essential pathway residues, Y731 and C439. For this purpose we have performed electron-nuclear double resonance spectroscopy (ENDOR) at high fields and frequencies (3.4 Tesla/94 GHz) to detect the hyperfine coupling to protons that were exchanged to deuterons using D2O buffer. Specifically, the method at high fields permits separation of the resonances of the deuterons from the 1H resonances of non-exchangeable protons or of other low-gamma (γ) nuclei such as 14N. Furthermore, the high-field/high-frequency approach allows orientation-selective experiments to be carried out.23 Here, only a few molecular orientations are excited within individual experiments permitting the reconstruction not only of the magnetic hyperfine tensors, but also of their orientations in the molecular frame. Nevertheless, the interpretation of the EPR data in terms of a structure requires the use of sophisticated quantum chemical calculations, as was shown in previous work.24-27 DFT calculations can generate possible molecular structures of the trapped intermediate that serve as a model(s) for the simulation of the EPR data. The calculated EPR parameters can then be employed for the interpretation of the spin-Hamiltonian parameters of the intermediate. In the present study we demonstrate that the combination of the ENDOR and DFT methods has allowed the assignment of exchangeable protons with their distances and orientations around the NH2Y730• intermediate. Moreover, our study detects an exchangeable proton that given the X-ray structures and the observed magnetic parameters is very likely a conserved water molecule at close distance (2.2 Å O-H---O distance) from the oxygen of NH2Y730•. This water molecule was previously mentioned by Siegbahn and co-workers, but was not used in their model14 and has not been considered to date in a possible PCET mechanism within α2. The present work has used combined experimental and theoretical approaches to establish the hydrogen bond network in the PCET pathway in α2 of an active RNR complex for which no X-ray structure is available. The results are used to rationalize the radical transfer between Y731⇆ Y730 ⇆ C439 in α2.
Results
94 GHz ENDOR spectra of exchangeable protons coupled to NH2Y730•
ENDOR spectra of a radical reveal the hyperfine couplings to magnetic nuclei that are in the vicinity (usually approx. ≤ 5 Å) of this center. When the buffer is exchanged with D2O, a deuterium ENDOR spectrum displays the resonances of exchangeable protons, such as those attached to heteroatoms including water molecules and amide protons in proximity. Each deuteron contributes to the spectrum a line pattern characterized by a hyperfine and quadrupole splitting (quartet). A representative deuterium ENDOR spectrum of the NH2Y730• radical trapped during reaction of NH2Y730-α2, β2, CDP/ATP in D2O buffer is displayed in Figure 2. The spectrum shows a complex deuterium ENDOR signal with a spectral width (± ∼ 2 MHz) consistent with the strong deuterium resonances of the ND2-group of the NH2Y• probe, as previously reported from the analysis of the EPR spectra21, and other overlapping signals. Nevertheless, the most prominent features are two strong peaks at around ± 0.6 MHz and a Pake pattern of at least one weakly coupled deuteron around the deuterium Larmor frequency. The strong peaks at ± 0.6 MHz lie in a region expected for coupled hydrogen bonds.28,29 To gain insight into the possible number of exchangeable protons that could contribute to the ENDOR spectrum, the crystal structure of the NH2Y730-α2 mutant in the resting state was examined. However, it should be kept in mind that the X-ray structure of the active α2β2 RNR complex is unknown. The predominant structure reported of NH2Y-α219 (Figure 1) is very similar to the wt structure (see also overlaid structures in SI, Fig.S8) and suggests that several exchangeable protons might be found in a distance range of ≤ 5 Å (Figure 2, inset) in the active complex. First, the oxygen of Y731, the sulfur of C439 and the oxygen of Y413 are all protonated and could contribute H bonding interactions with NH2Y730•. Second, two water molecules reside at distances < ∼ 5 Å, but only one is conserved in the structure of resting wt α2.
Fig. 2.
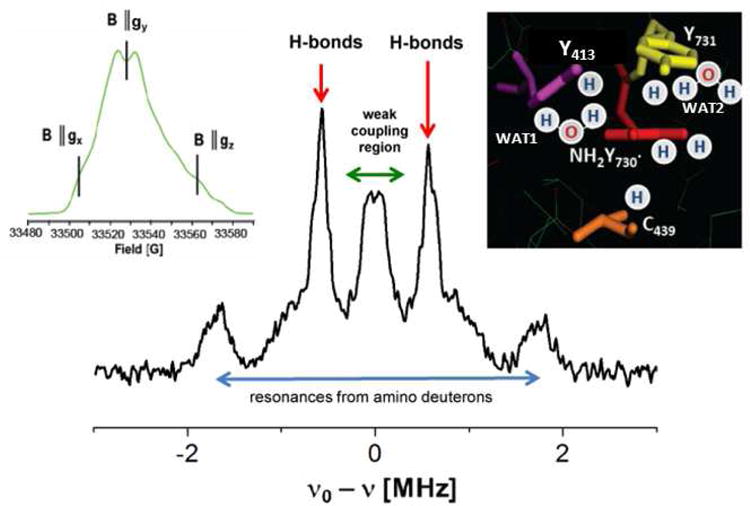
94 GHz 2H-Mims ENDOR spectrum of NH2Y730• in D2O assay buffer generated after reaction of NH2Y730 with CDP/ATP and quenching after 30 s. The spectrum was recorded at B‖gy (see EPR spectrum on the inset left). Different resonant regions are indicated with arrows and discussed in the text. The stars denote blind spots given by the Mims ENDOR sequence. The inset reveals the resting structure of NH2Y730-α2 from19 and possible protons around this residue. The water molecules have been denoted WAT1 and WAT2, as described in the text. Exp. conditions (for field sweep): T = 70 K, MW (π/2) = 32 ns, τ = 260 ns, MW (π) = 64 ns, repetition time = 3 ms, shots/point = 50, scans = 700. Conditions (for ENDOR): T = 10 K, MW pulse (π/2) = 20 ns, τ = 360 ns, RF pulse = 40μs, repetition time = 150 ms, 1700 scans.
Couplings to external H-bonds
To increase the resolution of the ENDOR experiment we recorded ENDOR spectra of the segments in the region of ± 1.5 MHz together with their orientation selection (Fig.3b). The unusual intensity of the peaks occurring at ± 0.6 MHz suggested that they could constitute the perpendicular component of an axially symmetric hyperfine tensor (A⊥) arising from more than one deuteron. If this tensor was purely dipolar, the wings at about 1-1.2 MHz could represent the A‖ component; however the amino deuterons also contribute in this region and are not distinguishable. We note that the precise form of the ND2 tensors is still to be established, as previous EPR simulations21 were not sensitive to small tensor components (i.e. ≤ 6 MHz for 1H or about ≤ 1 MHz for 2H).
Fig. 3.
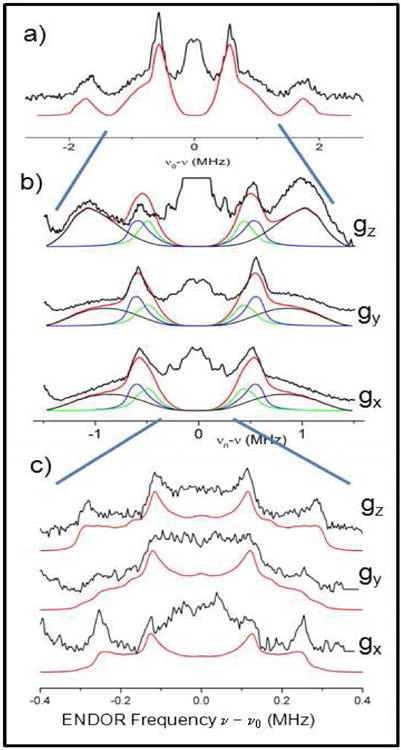
(a) 2H-Mims ENDOR spectrum of NH2Y730• in D2O assay buffer of the weakly coupled regions (black, from Fig. 2) and simulation (red). (b,c) Orientation selected ENDOR spectra recorded across the EPR line (Fig.2, inset). The blue lines connect the spectra segments from (a) to (c), which have been expanded. (b) Conditions: T = 10 K, MW pulse (π/2) = 20 ns, τ = 320 ns, RF pulse = 40 μs, repetition time = 150 ms, 2000-3000 scans/spectrum, 1 shot/point, random RF acquisition. The simulation (red) has been decomposed in the three separate simulations with the parameters for Y731-2HO (blue spectra) and C439-2HO (green spectra) and the amino deuterons (2H)2N (black) as listed in Table 1. (c) Exp. conditions as in (b) but τ = 360 ns. Simulation parameters are reported in Table 1. Average rmsd were about 0.09 for (b) and 0.07 for (c), as explained in Methods.
The orientation selective spectra in Figure 3b displayed a pronounced attenuation of the ± 0.6 MHz peaks at B ‖ gz. Attempts to simulate the spectra using either one or two deuterons with a pure dipolar tensor of 2A⊥ = A‖ ≈ 1.2 MHz and gz ‖ A‖ did not reproduce the observed intensities, when the absorption of the amino deuterons was taken into account as previously reported.21 We also note that part of the tensor belonging to the ± 0.6 MHz resonances might be hidden in the central part of the ENDOR spectrum, where the intensities are attenuated by the central hole of the Mims sequence30 and overlap with the weakly coupled deuteron(s). Therefore, the results indicated that the complete form of the hyperfine tensors cannot be easily disentangled from the observed ENDOR spectra.
The orientation selected ENDOR spectra in Figure 3c display the region of ± 0.4 MHz with higher resolution. In this region, the ENDOR line shape is reminiscent of a dipolar powder pattern from mainly one deuteron, with the orientation selectivity leading to sharpness of the spectra at B ‖ gx and gz. The position of the outer edges shifts only slightly between 0.25 MHz (gx) and 0.3 MHz (gz), suggesting a counteracting effect of orientation dependent hyperfine and quadrupole splittings. As in the high-field limit the quadrupole coupling splits the ENDOR line symmetrically around the hyperfine value, the observed line shape sets boundaries for the hyperfine tensor of this weakly coupled deuteron with A‖ ≈ 0.4 MHz. On the other hand, a further determination of the tensor elements and particularly their orientations is aggravated by the uncertainty about the number of weakly coupled deuterons contributing to this region.
Overall, the ENDOR spectra of Fig. 3 contain the fingerprints of the hydrogen bond network around NH2Y730• however spectral simulations could not be performed a priori due to the large and unknown number of possible couplings. We note that the ENDOR simulation requires at least eight independent parameters for each deuteron, i.e. three hyperfine and two quadrupole tensor components, three Euler angles relating A and g tensors if A and Q are assumed to be collinear. Not much rationale can be applied for the choice of these parameters, if a structural model and subsequent prediction of the related EPR parameters is lacking. Such a model can be obtained from DFT calculations, if possible energy minimized structures of the radical intermediate within its protein environment are examined.
Optimized structure of NH2Y730• from combined DFT and ENDOR results
In order to find an optimized structure with magnetic parameters compatible to the ENDOR spectra, six different models were investigated by DFT. All structures used the coordinates of α-NH2Y730 as input, but differed in the number and arrangement of the water molecules. Because in the X-ray structure of NH2Y730-α2 the amino tyrosine is reduced and the enzyme is not active, energy-minimized structures were evaluated on the basis of their computed EPR parameters for NH2Y730• as compared with the previously reported EPR parameters21, i.e. the g-values and the large hyperfine couplings to the β-methylene hydrogens and the 14N nucleus of the amino group.
Specifically, two structures contained only the water molecule (WAT1) located between NH2Y730 and Y413 (Fig. 2, inset), which is conserved in most X-ray structures,5,19,31,32, whereas three other structures took into account a second water molecule visible in α-NH2Y730 and located at ∼ 5 Å from both the nitrogen and the oxygen atom of NH2Y• (Fig. 2, inset). We note that the second water molecule is not conserved in the wt structure, but could be present in the NH2Y-mutant and contribute to the ENDOR spectra. The optimized cluster models are illustrated in the SI, Fig. S1- S5 and in Figure 4. However, the three structures (in SI models 1, 2 and 3) with two water molecules were discarded and not analysed further because they show that the second water molecule would interact strongly with either the carbonyl group of residue S694 (Fig. S1) or with the amino group of NH2Y• (Fig. S2 and S3). Both situations would give rise to nitrogen and Cβ methylene proton tensors for NH2Y• that are not compatible with our EPR data.21 Structure 5 (see Fig. S4, SI) with only one water shows this water molecule with one hydrogen at a 1.9 Å from the oxygen of NH2Y•. The calculated dipolar tensor for this deuteron has eigenvalues that by far exceed the experimentally observed values in Figure 3C. Finally, structure 4 (Figure 4) shows the water molecule with a proton at a distance of 2.2 Å. This arrangement generates a dipolar coupling tensor for this proton that is quite close to the experimental results (Table 1). Also, the DFT calculation of structure 4 predicts that both hydrogen bonds to the next essential pathway residues, Y731 and C439, should be observable in the ENDOR experiments. The calculated couplings are reported in Table 1. The hydrogen bond lengths to Y731 and C439 are quite different from one another (1.8 Å and 2.0 Å respectively, Figure 4). The form of the hyperfine tensor strongly depends on the out-of-plane angle between the bond vector and the NH2Y• ring, as indicated from systematic calculations that explore this dependency (data not shown; this behaviour has previously been described for a similar system, a quinone radical anion33). This dependency is readily rationalized when considering that the H-bond starts to overlap with the π-orbitals of the NH2Y• for large out-of-plane angles, as was already reported33. Thus, the form of the hyperfine tensor can significantly deviate from a typical axially symmetric dipolar tensor that we observed for the H-bond to the essential tyrosyl radical diiron-cofactor in S. cerevisiae RNR29 Also, for large out-of-plane angles, the point-dipole model cannot be used to derive the hydrogen bond length from the hyperfine couplings.
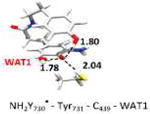
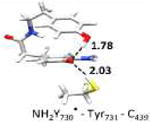
Fig. 4.
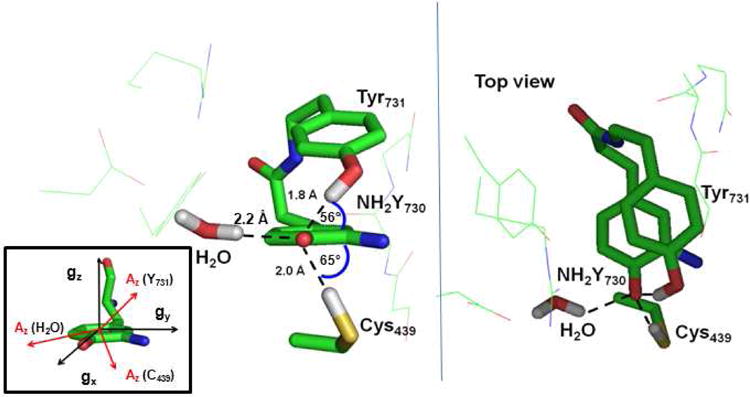
Combined EPR and DFT model for the hydrogen bond network around NH2Y730• in α2. Left (side view): distances and out-of-plane angles of the hydrogen bonds and to WAT1 within the optimized DFT model 4. Right: top view. Inset: Location of the g tensor within the NH2Y• structure. The direction of the hyperfine tensor component Az of the three hydrogen/deuteron couplings is also schematically drawn.
Table 1. Summary of magnetic and structural parameters of the exchangeable deuterons coupled to NH2Y• from combined HF-ENDOR and DFT calculations.
| Ax | Ay | Az | α | β | γ | Q1 | Q2 | Q3 | rO - D | |
|---|---|---|---|---|---|---|---|---|---|---|
| Cys439-SD | ||||||||||
| Sim | -1.1 | - 0.95 | 0.6 | -17 | 38 | -44 | -0.03 | - 0.02 | 0.06 | |
| DFT | -1.0 | - 0.8 | 0.6 | -17 | 38 | -44 | -0.04 | - 0.03 | 0.07 | 2.0 |
| Tyr731-OD | ||||||||||
| Sim | -1.25 | - 1.15 | 0.7 | -166 | 47 | 102 | - 0.02 | - 0.03 | 0.06 | |
| DFT | - 1.70 | - 1.15 | 0.73 | -166 | 47 | 102 | - 0.04 | - 0.06 | 0.11 | 1.8 |
| 2H2O | ||||||||||
| Sim H(1) | - 0.21 | - 0.21 | 0.42 | 6 | -81 | 10 | 0.14 | - 0.06 | - 0.05 | |
| DFT H(1) | - 0.31 | - 0.28 | 0.64 | 6 | -81 | 55 | 0.14 | - 0.06 | - 0.07 | 2.2 |
| 2H2N | ||||||||||
| Sim H(1) | -3.3 | 0 | -2.7 | 7 | 6 | 75 | -0.04 | 0.11 | -0.06 | |
| DFT H(1) | -3.3 | -0.1 | -2.7 | 7 | 6 | 75 | -0.05 | 0.13 | -0.07 | |
| Sim H(2) | -3.8 | 0 | -2.9 | 0 | -5 | -30 | 0.14 | -0.08 | -0.06 | |
| DFT H(2) | -4.0 | 0.1 | -2.6 | 4 | 5 | -30 | 0.14 | -0.08 | -0.06 |
All hyperfine and quadrupole values are given in MHz. The signs of the couplings from the simulation are only relative to each other within one tensor. The Euler angles (α, β, γ) in degrees are defined from the A to the g tensor with the second rotation around the y axis, counterclockwise. The orientation of the g tensor as well as the orientation of the Az direction for the three weakly coupled deuterons is illustrated in Figure 4. The latter is defined such that it coincides with the bond direction. Instead, for the amino deuterons, the N-H bond defines the y direction. Distances are given in Å. Uncertainties in the experiment and calculations are estimated up to 20%. The spin distribution, as derived from the Loewdin population analysis of the DFT calculations of model 4, is as follows: O(NH2Y•) 0.21, N(NH2Y•) 0.16, carbon skeleton(NH2Y•) 0.54, S(Cys439) 0.01, O(Tyr731) 0.01.
The calculated EPR parameters derived from model 4 for five deuterons, i.e. Tyr731-OD Cys439-OD WAT1-OD and the amino deuterons, were used as input for the simulations of the ENDOR spectra. Specifically, all Euler angles predicted by the DFT calculation for the couplings to Tyr731-OD and Cys439-OD were kept fixed and the hyperfine and quadrupole tensors were allowed to change as much as ± 20-30 % in order to reproduce the position and the relative intensities of the ENDOR lines. The values obtained in this way should represent boundaries for the magnitude of the hyperfine tensors. The obtained simulations are presented in Fig. 3, and the simulation parameters are compared with the DFT values in Table 1. As a result, only minor refinement of the DFT values was required to obtain reasonable agreement between simulations and experimental spectra, with rmsd less than 0.1 (for spectra normalized to unity). The simulation of the strong peaks at ± 0.6 MHz is reproduced by the Ax ≈ Ay components of almost axially symmetric tensors, as predicted for the hydrogen bonds to Tyr731 and Cys439. However, in contrast to typical dipolar tensors, here we find |Ax,y| > |Az| due to a non-zero isotropic coupling. Notably, the two tensors cannot be distinguished in the experimental spectra, but the intensity of both deuterons is required to reproduce the overall line shape, as also illustrated by the simulation of the single components in Fig.3b. The form of the tensors for these hydrogen bonds is consistent with the observed attenuation of the strong peaks (Ax,y) at B‖gz, as gz is close to Az, with the latter pointing to Tyr731 and/or Cys439 located above and/or below the NH2Y730• ring (Fig.4). The resonance of the Az component(s) remains invisible in the spectrum due to the overlap with the matrix peak. This region is also not reproduced by the simulation because of the hole caused by the Mims ENDOR preparation function.
The simulation of the weakly coupled deuteron required an overall scaling of the hyperfine tensor of about 30%, which is likely caused by a minor deviation of the DFT predicted distance with respect to the experimental distance. On the other hand, the orientation dependence of the spectra (Fig. 3c) was consistent with the calculated direction of the A and Q tensors for the closest deuteron of WAT1. Indeed Az for this interaction lies almost in the tyrosine plane and points between gx and –gy (Figure 4). Thus, the results strongly support the assignment of this deuteron to WAT1. We observe that the simulation requires Az closer to gx than predicted by the DFT (Euler angle γ). Again, the deviation might suggest a small displacement of the water, but could also be within the combined experimental and computational uncertainty.
The simulation of the weakly coupled deuteron in 3c does not entirely reproduce the matrix peak, which indicates that some other deuterons (presumably the second deuteron of WAT1) contribute to the matrix peak. Finally, the Ay tensor components of the ND2 resonances are also predicted around zero frequencies but not distinguishable. These resonances likely contribute the offset observed under the deuteron spectrum of WAT1. Moreover, the tensors of ND2 extend over the entire ENDOR spectrum, with the remaining principal axis values Ax and Az predicted far outside the resonances of the hydrogen bonds. This further supports our assignment of the strong peaks at ± 0.6 MHz to the external H-bonds.
DFT calculations of the g-tensor support strong hydrogen bond interactions to NH2Y730•
We used the optimized structure (model 4) and further DFT calculations to rationalize the g-tensor observed for NH2Y730•, which is the EPR parameter that is most sensitive to the electrostatic environment of a radical. Table 2 displays the g-tensors calculated for a set of model systems (see Table 2, entries 2-9) compared to the experimental value for the RNR mutant (see Table 2, entry 1).
Table 2. Comparison of computed g-values from DFT models with experiment.
| gx | gy | gz | ||
|---|---|---|---|---|
| 1 | Experiment | 20052 | 2.0042 | 2.0022 |
| DFT model | Deviation from experiment [in ppt] | |||
| 2 | Model 4 (with WAT1) | -0.3 | -0.1 | -0.4 |
| 3 | Model 6 (wirhout WATl) | -0.1 | -0.1 | -0.3 |
| 4 |
|
-0,6 | -0.3 | -0,5 |
| 5 |
|
-0.2 | -02 | -0.4 |
| 6 |
|
0.3 | 0.2 | -0.2 |
| 7 |
|
0.8 | 0,1 | -0,4 |
| S |
|
0.9 | 0.3 | 0.0 |
| 9 |

|
1.7 | 0,4 | 0.0 |
The optimized structure without water (entry 3, model 6) is shown in Figure S5. The optimized structure with water (entry 2, model 4) is shown in Figure 4. Small model systems were obtained by omitting residues of model 4, which are not involved in the PCET pathway. Hydrogen bond lengths are given in Å. Geometries and EPR parameters are calculated using COSMO (ε = 4.0). The uncertainty in the experimental values (entry 9) at 180 GHz is ± 0.1 ppt. The unit ppt refers as part per thousand of the g-value.
In the largest and most realistic model systems investigated here, 8 amino acid residues surrounding NH2Y730• are included (Fig. S6a). The initial coordinates were taken from the predominant structure of α-NH2Y730 (see Figure 1)19 and subjected to constrained geometry optimization. The water molecule (WAT1) between Y413 and NH2Y730• is present in model 4 (entry 2), but was omitted in model 6 (entry 3; see also Figure S5 for comparison). For both models 4 and 6 a gx-value is obtained that is very close to our experimental results (within the inherent accuracy of the theoretical methodology, i.e. ± 0.5 ppt). This shows on one hand that the model size is sufficiently large, but on the other hand that the g-tensor alone cannot be used to decide on the existence of the water molecule in the experimental structure. When comparing the experimental gx-value to the calculated gx-value of the isolated radical (entry 8) a substantial difference is observed (Δgx = 0.9 ppt). This is likely indicative for strong hydrogen bond interactions from the protein environment. In order to rationalize the effect of the intermolecular hydrogen bonds in the protein on the gx-value, the large models were systematically reduced in size (starting from entry 2) and the effect on the g-values calculated. Entry 4 shows the results for a model containing only the PCET pathway residues and WAT1, i.e. without the second sphere residues present in entries 2 and 3. With this model the gx-value is decreased compared to entry 2. This is due to the missing effect of the surrounding residues on the strength of the hydrogen bond between WAT1 and NH2Y730• (for more information see SI and Fig.S7). Removing WAT1 (entry 5) increases the gx-value and brings it again back into the range of the experimental results. Removing the hydrogen bonding partners Cys439 (entry 6) or Tyr731 (entry 7) increases the gx-value further by 0.5 and 1.0 ppt, respectively. Comparing entries 3 and 8 shows that it is mostly the combined effect of the hydrogen bonds to Cys439 and Tyr731, both nearly perpendicular to the ring plane of NH2Y730•, which substantially shifts the predicted gx-value towards the experimental value. The hydrogen bond to WAT1 also has an effect on the gx-value, but it is strongly influenced by the second sphere residues.
The isolated radical (entry 8) contains an additional intra-molecular hydrogen bond and we expected a further increase of the gx-value when removing this hydrogen bond. In order to analyze this we replaced the hydrogens of the amino-group in silico with methyl groups, thus removing the intramolecular hydrogen bond. As expected, an upward shift of the gx-value is observed (entry 9).
Discussion
In order to obtain structural insight into a putative hydrogen bond network in the Y731↔Y730↔C439 triad of E. coli RNR during radical propagation, 3-aminotyrosine (NH2Y) was site-specifically incorporated at position 730 using the in vivo nonsense suppressor t-RNA/RS methodology.34,35 Because the modified tyrosine residue has E°′ of 640 mV (pH 7), which is 190 mV11 less than that of Y at pH 7, NH2Y serves as a spin trap in radical transport through the α2-subunit. The first spectroscopic evidence for the formation of a NH2Y• in Y730NH2Y-α2 was provided by earlier studies using X-band EPR spectroscopy, stopped-flow UV-Vis kinetics11 and PELDOR spectroscopy.20 We have further characterized the electronic structure of the trapped radical at position 730 by multi-frequency EPR spectroscopy and have determined its g-values.21 The latter analysis suggested strong intermolecular H-bonding interactions around NH2Y• that could be essential for the PCET in the α-subunit.
The mutant employed here, Y730NH2Y-α2, has activity 5-8 % that of wt-α219 and provides a means to obtain structural insight in the PCET pathway within the α2-subunit of the α2β2 complex. Our high-field ENDOR spectra illustrate couplings to several exchangeable protons in a distance range < 5 Å to the oxygen of NH2Y•. Several spectral features, but particularly strong resonances at ± 0.6 MHz and a weakly coupled deuteron(s) with 2A⊥ = A‖ ≈ 0.4 MHz, provide fingerprints of the hydrogen bonding interactions of this intermediate. The DFT calculation on the basis of the X-ray structure in the resting state predicts an optimized structure of the NH2Y730•, in which three external deuterons should be visible in the ENDOR spectrum (i.e. with Ax,y,z ≥ 0.1 MHz), i.e. both exchangeable hydrogens of Y731 and C439 and one deuteron of a water molecule located between NH2Y730 and Y413 that is conserved in the wt structure. Spectral simulations illustrated that the hyperfine and quadrupole tensors predicted by DFT for this model are in agreement with the experimental spectra within 20% uncertainty. A more detailed DFT analysis of the g-values revealed that the observed unusual g-shifts are mostly due to the combined effect of the hydrogen bonds to Cys439 and Tyr731, both nearly perpendicular to the ring plane of NH2Y730. This is the first combined experimental and theoretical evidence for a hydrogen bond network between the essential residues in the α2 subunit of E. coli RNR in an active complex.
The hydrogen bonds and hyperfine couplings observed in this study are assigned to residues that are conserved in the wt structure. Because of the strong similarities in the X-ray structures of wt and NH2Y-α2 mutant around residue 730 (Fig. S8), our results strongly suggest that the observed hydrogen bond network is conserved also in the ‘active’ wt enzyme. The work establishes that the X-ray structure of the wt-α2 subunit alone with the unusual configuration of Y731 and Y730 is present in the active α2β2 complex in solution. We also note that the DFT optimized structure of the intermediate state (Fig. 4) reveals distances between the pathway residues Cys439-NH2Y730-Y731 that are considerably shorter than in the X-ray structure of the resting state (Fig.1). Specifically, the O---O distance between NH2Y730 and Y731 decreases from 3.3 Å (Fig.1) to 2.7 Å (Fig. 4) and the O---S distance between NH2Y730 and Cys439 from 3.7 Å to 3.4 Å. The obtained structural data can now be employed to rationalize the proposed mechanism of proton coupled electron transfer (PCET) within <x2.
For this goal, the energetics for the radical transfer between Y731⇆Y730⇆C439 were computed as a function of suitably chosen reaction coordinates. Relaxed surface scans were carried out by pulling the hydrogen atom from Y731/C439 towards Y730• via reducing the O(Y730•) - H bond length. For this purpose, an even larger model than 4 (Figure 4) was constructed in order to include the residues around Cys439 and the sugar of the substrate GDP (PDB code 4R1R31, model 7 with WAT1 and model 8 without WAT1, in Fig S6b SI); a total of 209 and 212 atoms, respectively, were considered in the quantum calculations. We display in Fig. 5 the energetics of the radical transfer using models 7 and 8 and consider explicitly the effect of the water molecule observed in this study. In the calculation with the water molecule, both Y731• and Y730• are isoenergetic, whereas radical transfer to Cys439 is endergonic by about 3-4 kcal/mol. From these data it can be estimated that the oxidation potential of Cys439 is about 120 mV greater than that of the tyrosines in the protein environment. Very recent studies on the distribution of the Y• between residues 356 in β2 and 731 and 730 in α2, suggested within error that Y731 and Y730 are isoenergetic36. These results are consistent with the similarities of the reduction potentials of Y731• and Y730• obtained in this work. Until now no experimental data is available on the redox gradient towards C439. Kinetic studies of tyrosyl radical reduction by the tripeptide glutathione indicate that the redox potential of the glutathione thiyl radical and the tyrosyl radical are nearly the same at pH 737. However this model system might be too simple to be compared with the Y730• and C439• in the active RNR complex.
Fig. 5.
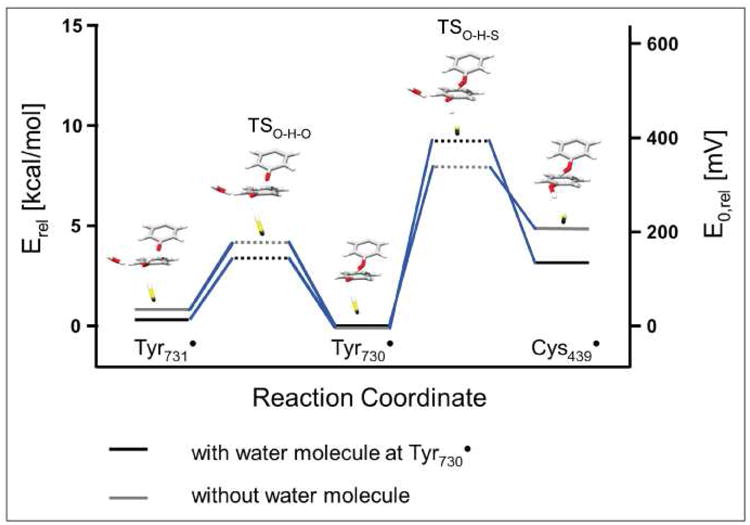
Energy level diagram including the transition states for the PCET pathway residues Y731-Y730-C439. The reaction coordinate was investigated using the large models 7 and 8 (Table 2), with and without the water molecule. Shown are only parts of the optimized structures of model 7 (with water molecule).
Upon removal of the water molecule, a destabilization of Y731• and Cys439• is observed in the calculation. The activation barrier is diminished for the PCET from Y730• to Cys439• by 1.2 kcal/mol (from 9.2 to 8.0 kcal/mol), whereas the barrier for the PCET from Y731• to Y730• is only slightly increased (from 3.1 to 3.4 kcal/mol). We point out that the absolute errors for energy barriers are certainly not less than about 2 kcal/mol in these DFT calculations. However, when comparing trends in very similar systems, as done here, the errors should be much smaller and an energy shift of 1.2 kcal/mol between two closely related structures is considered significant. By removing the water molecule, the kinetics of the radical transfer from Y731• to Cys439• is accelerated by about one order of magnitude. The difference is small as compared to the much higher energy barrier dominating the overall kinetic behaviour in RNR (the turnover number of 2-10 s-1 corresponds to a rate-determining step with a barrier of 15 to 16 kcal/mol). Nevertheless, changing a rate constant in a chemical mechanism perturbs the balance between different possible reaction channels and could allow off-pathway reactions to compete. We should mention that in the previous work of Siegbahn et al. the transfer from Y731• to Cys439• was studied, but with much smaller model systems and without WAT114. Their calculated barrier for the transfer from Y730• to Cys439• is almost identical (8.1 kcal/mol), whereas the barrier for the PCET from Y731• to Y730• is 1.5 kcal/mol higher than the one predicted by our calculations (4.9 kcal/mol versus 3.4 kcal/mol). In their early calculations, the dispersion interaction was not taken into account and affects the interaction between both tyrosine residues (e.g. the tyrosine-tyrosine distance in the transition state for the radical transfer from Y731• to Y730•, measured by the C(-OH)-C(-OH) distance, is 3.25 Å in their calculations and 2.97 Å in ours). We further note that the determination of transition states in quantum chemical calculations makes no a priori assumption about the actual mechanism (e.g. H-atom transfer or PCET of any kind). The calculations simply provide a transition state structure and associated energy which have the mathematically and physically well-defined property of representing a point on the potential energy surface that is a local maximum in exactly one degree of freedom. The important question of how the electronic structure of the system is to be interpreted at this point is an entirely different subject. In the present case we find the perhaps surprising result that the calculated transition state does not reflect classical hydrogen atom transfer HAT. If it would be HAT, the calculation would have to show positive spin population on both tyrosine residues and negative spin at the transferring hydrogen. Rather one observes essentially no spin on the transferring hydrogen (see Figures S9) and half of the spin density each on both tyrosine π-electron systems (see Figures S9).38 This means that the reaction is best described as a PCET in which the proton and electron move separately. It is noted that our results are in agreement with a recent study by Kaila and Hummer, who used dispersion corrected DFT for the calculation of the radical transfer between two stacked tyrosine residues.17 Their results, like ours for RNR, are in agreement with a co-linear PCET mechanism. Similar observations hold for the Y730↔C439 radical transfer (see Figure S9b). A more detailed theoretical analysis would involve going significantly beyond the Born-Oppenheimer approximation and is outside the scope of the present study.
Conclusion
We have presented using a combination of ENDOR spectroscopy and density functional calculations evidence for the structure of the hydrogen bond network around NH2Y730• in an NH2Y730-α2β2 complex of E. coli RNR competent in nucleotide reduction. The short distances and hydrogen bonding interactions revealed along the radical transfer pathway Y731⇆Y730⇆C439 support the current model of a co-linear PCET in the active α2. Our results also suggest the involvement of a water molecule near Y730 in the active complex, which is conserved in available X-ray structures of the wt α2-subunit. The results give insight into the complexity of H-bond interactions, which could regulate the energetics of PCET at the molecular level.
Methods
Preparation of high-field EPR samples
Y730NH2Y-α2 was prepared as previously described.11 Pre-reduced Y730NH2Y-α2 and β2 were combined in an equimolar ratio and concentrated at 4 °C in a Minicon concentration device (YM-30 membrane) to a final complex concentration of 100 μM (ε280 nm (α2+β2)) = 320 mM-1cm-1) in D2O buffer consisting 50 mM Hepes, 15 mM MgSO4 and 1 mM EDTA (assay buffer) at pD 8.0. The concentrated samples were divided into 100 μL aliquots, placed in 1.5 mL Eppendorf tubes, and flash-frozen in liquid N2. High-field EPR samples were prepared by thawing each aliquot on ice and adding CDP and ATP to final concentrations of 2 and 6 mM in a 20 μL sample volume. Each reaction was allowed to proceed for ∼ 30 s at room temperature and was then quenched in an EPR tube by hand-freezing with liquid N2. The reaction in D2O was carried out after exchanging the H2O buffer of prereduced α2-NH2Y730 and β2 into deuterated assay buffer by 5 concentration/dilution cycles at 4 °C using a Minicon concentration device and a YM-30 membrane until the solution consisted of > 99% deuterated buffer. Nucleotide stock solutions were also prepared in deuterated buffer.
High-frequency pulsed EPR and ENDOR on NH2Y730• in D2O buffer
Samples for 94 GHz EPR and ENDOR spectroscopy contained a volume of ∼ 0.25 μL in a Suprasil quartz tube from Wilmad (OD 0.5 mm) and 0.5 μL in a quartz tube from Bruker (OD 0.9 mm), respectively. Echo-detected EPR spectra at 94 GHz were recorded at 70 K on a Bruker E680 W-band with 400 mW output power. At 70 K only the ND2Y730• contributes to the pulsed EPR spectra due to the fast relaxation of the Y122• in the vicinity of the di-iron cluster 39. In order to get a spectrum with high signal-to-noise ratio, the shot per points (SPP), number of field sweeps and repetition times had to be adjusted appropriately at 70 K. Experimental conditions are given in the caption of Figure 2. 94 GHz 2H ENDOR measurements were carried out with the Mims ENDOR sequence (π/2 - τ - π/2 - RF - π/2 - τ - echo) at 10 K and random radio-frequency acquisition. RF pulses were produced with a 250 W RF amplifier from Amplifier Research (AR). τ and π/2 values were optimized for each experiment and spectral range as described in the figure captions. As the EPR/ENDOR spectra at 10 K also contain about 50-60% contribution of Y122•, the matrix peak of Y122• was recorded in a separate experiment and subtracted for each spectrum of Fig.3C. However, no H-bonds are observed in Y122•, as known from previous studies.22,29,40 All displayed ENDOR spectra were normalized for comparison with simulations.
Simulations of ENDOR spectra
94 GHz deuterium ENDOR spectra were simulated using a MATLAB routine developed in-house that is based on a first order Hamiltonian (high-field condition) for the hyperfine and quadrupolar interaction23,29. Previous simulations of the EPR spectra at two different frequencies (9 and 94 GHz)21 provided a set of hyperfine tensor principal values (Ax, Ay, Az) and Euler angles (α,β,γ) for the strongly coupled nuclei of NH2Y730• in D2O and H2O buffer, i.e. the β-methylene proton, the 14N of the amino group. The blind spots produced by the Mims ENDOR sequence were included by multiplying the calculated ENDOR powder pattern with an envelope function given by IENDOR = 1 - cos(2πAτ).41 This is valid for the I = 1 nuclei considered here, as all quadrupole couplings are much smaller than the hyperfine values.30 The simulations of spectra 3A and 3B did not include the weakly coupled deuteron due to the central hole produced in the simulation by the blind spots of the Mims sequence. For the same reason, the simulation of spectra 3c was performed without convolution with the blind spot function.
RMSD values for the orientation selected traces within one kind of experiment (Fig.3b or c) were summed up and subsequently divided by the number of traces. In both cases, the central part of the spectrum was not considered, i.e. the region of ± 0.37 MHz in (b) and ± 0.08 MHz in (c). Fitting procedures were not used due to the too large number of parameters involved.
Computational methodology
Cluster models 1 – 8
The cluster models were generated from the crystal structure of the Y730NH2Y-α2 mutant of E.coli RNR from19 (PDB code 2XO4). Models 1 to 6 incorporated, besides the residues NH2Y730•, Y731 and C439 that are directly involved in the PCET process, the surrounding residues D334, R411, Y413, S694, A695 and N696 (see Figure S6 in SI). Models 4 – 5 additionally incorporated the water molecule (WAT1 in Figure S6), which is present between NH2Y730• and D334 in all three molecules of the asymmetric unit of the crystal structure. Models 1 – 3 contain, in addition to WAT1, a second water molecule that is present in only two out of the three molecules in the asymmetric unit of the crystal structure (WAT2 in Figure S6). It is located between NH2Y730• and S694.
For the calculation of the PCET barriers for the triad Y731↔Y730↔C439 more extended models were used in which the residues surrounding C439 and the ribose of GDP are also included. The cluster models were generated from the crystal structure of E.coli RNR with bound substrate (PDB code 4R1R).31 The position of the backbone atoms of 4R1R and 2XO4 show practically no deviation in the region of interest (see Figure S8 in SI). Besides the region already incorporated in models 5 and 6 the residues T303, L438, E441, C225, C462 and ribose as a mimic for the substrate GDP were taken into account for the extended cluster models. Model 7 (see Figure S6b in SI) includes WAT1 in the same position as in model 4, in model 8 this water molecule is not included (similar to model 6). Because the interactions studied here are very local in nature, we believe that the size of the cluster choosen here should be large enough to cover effects from the protein electrostatics.
For all model structures the side chains of the residues were always fully incorporated. Bonds were truncated in the backbone region between Cα and C(C=O) and between Cα and N(N-H), respectively, and replaced by a C-H bond. If the neighbouring residue is present in the model structure (as for S694 – N696 and NH2Y730• – Y731) the respective backbone bonds were not cut. In order to mimic the steric influence of the protein in the native enzyme structure Cartesian constraints were included in the geometry optimization of the model structures. For all residues the coordinates of the Cα and Cβ atoms were kept fixed. In case of the truncated GDP model, the bonds between C4 and C5 of the ribose as well as the bond between C1 of the ribose and the base were replaced by a C-H bond. In order to preserve the orientation of ribose in the vicinity of C439, Cartesian constraints were imposed on these C-H bonds.
For the simulation of the radical transfer relaxed surface scans were carried out by pulling the hydrogen atom from Y731/C439 towards Y730•. Transition state optimizations were performed using the P-RFO algorithm with an approximate Hessian matrix as an initial Hessian as implemented in ORCA 42,43.
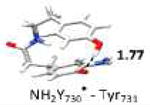
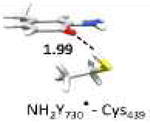
Small cluster model
Small model systems were constructed in order to analyze the influence of Y731 and C439 on the g-values of NH2Y730•. For this purpose, large parts of model 4 were removed. The simplest model contains only the 2-amino-4-methyl-phenol radical (2-AMPR) representing NH2Y730• (Table 2, entry 8). Y731 and C439 are mimicked by the bound neighbouring tyrosine (including the peptide bond) and cysteine, respectively. This gives rise to three additional models which are labelled as followed: NH2Y730• – C439, NH2Y730• – Y731, NH2Y730• – Y731 – C439 (Table 2, entry 5-7). Model NH2Y730• – Y731 – C439–WAT1 (Table 2, entry 4) contains an additional water molecule (in comparison to Table 2, entry 5). The effect of the intra-molecular hydrogen bond in NH2Y730• was also investigated in one small cluster model (Table 2, entry 9). In this model the intra-molecular hydrogen bond is disrupted by substituting the hydrogen atoms of the amino group with methyl groups. In order to mimic the effect of the protein on the geometry, the Cα and Cβ atom coordinates (Cβ and Cγ for 2-AMPR without backbone) were kept fixed during the geometry optimization.
QM methodology
The optimizations were performed with spin unrestricted RI-BP using the def2-TZVP basis set in conjunction with the def2-TZVP/J auxiliary basis set.44-48 Single-point energy calculations were carried out with RIJCOSX24-B3LYP48-51 using the def2-TZVPP basis set in conjunction with the def2-TZVPP/J as auxiliary basis set for all atoms. The long range electrostatic effects of the protein environment were crudely modeled using a dielectric continuum approach on the basis of the conductor like screening model (COSMO52) with a dielectric constant (ε) of 4.0.53 The EPR calculations were carried out using RIJCOSX-B3LYP using the EPR-II basis set (IGLO-II for sulfur) in accordance with def2-TZVPP/JK as auxiliary basis set for all atoms54-56. Grimme's 2006 semiempirical dispersion correction (keyword VDW06 in ORCA) was included to account for dispersion effects57. Numerical frequency calculations were carried out at the same level of theory as for the optimization. From these frequency calculations the zero point energies (ZPE) for the relative energies were derived.
Supplementary Material
Acknowledgments
T.A and M.B would like to thank E.C. Minnihan, M.R. Seyedsayamdost and T. Nick for their support in this work. The work was funded by the DFG-IRTG 1422, and the Max Planck Society (T.A. and M.B.). C.R. and F.N. gratefully acknowledge financial support by the Collaborative Research Center SFB 624. The financial support to J. S. is from NIH GM29595 is gratefully acknowledged.
Footnotes
Supporting Information Available: Energy-minimized DFT models (1, 2, 3, 5, 6) for the NH2Y730• intermediate as well as cluster models 1, 7 and 8. Influence of second sphere resudues on hydrogen bond interactions to NH2Y730•. Comparison of PDB structures 2X0X, 2XO4 and 4R1R. Spin density plots for the radical transfer transition states Y731↔Y730 and Y730↔C439. This information is available free of charge via the internet at http://pubs.acs.org.
Contributor Information
Frank Neese, Email: frank.neese@cec.mpg.de.
Marina Bennati, Email: Marina.Bennati@mpibpc.mpg.de.
References
- 1.Jordan A, Reichard P. Annu Rev Biochem. 1998;67:71. doi: 10.1146/annurev.biochem.67.1.71. [DOI] [PubMed] [Google Scholar]
- 2.Stubbe J, van Der Donk WA. Chem Rev. 1998;98:705. doi: 10.1021/cr980059c. [DOI] [PubMed] [Google Scholar]
- 3.Hofer A, Crona M, Logan DT, Sjöberg BM. Crit Rev Biochem Mol Biol. 2012;47:50. doi: 10.3109/10409238.2011.630372. [DOI] [PMC free article] [PubMed] [Google Scholar]
- 4.Nordlund P, Sjoberg BM, Eklund H. Nature. 1990;345:593. doi: 10.1038/345593a0. [DOI] [PubMed] [Google Scholar]
- 5.Uhlin U, Eklund H. Nature. 1994;370:533. doi: 10.1038/370533a0. [DOI] [PubMed] [Google Scholar]
- 6.Bennati M, Robblee JH, Mugnaini V, Stubbe J, Freed JH, Borbat P. J Am Chem Soc. 2005;127:15014. doi: 10.1021/ja054991y. [DOI] [PubMed] [Google Scholar]
- 7.Climent I, Sjoberg BM, Huang CY. Biochemistry. 1992;31:4801. doi: 10.1021/bi00135a009. [DOI] [PubMed] [Google Scholar]
- 8.Ekberg M, Sahlin M, Eriksson M, Sjoberg BM. J Biol Chem. 1996;271:20655. doi: 10.1074/jbc.271.34.20655. [DOI] [PubMed] [Google Scholar]
- 9.Yee CS, Chang, Ge J, Nocera DG, Stubbe J. J Am Chem Soc. 2003;125:10506. doi: 10.1021/ja036242r. [DOI] [PubMed] [Google Scholar]
- 10.Yee CS, Seyedsayamdost MR, Chang MCY, Nocera DG, Stubbe J. Biochemistry. 2003;42:14541. doi: 10.1021/bi0352365. [DOI] [PubMed] [Google Scholar]
- 11.Seyedsayamdost MR, Xie J, Chan CT, Schultz PG, Stubbe J. J Am Chem Soc. 2007;129:15060. doi: 10.1021/ja076043y. [DOI] [PubMed] [Google Scholar]
- 12.Holder PG, Pizano AA, Anderson BL, Stubbe J, Nocera DG. J Am Chem Soc. 2011;134:1172. doi: 10.1021/ja209016j. [DOI] [PMC free article] [PubMed] [Google Scholar]
- 13.Stubbe J, Nocera DG, Yee CS, Chang MC. Chem Rev. 2003;103:2167. doi: 10.1021/cr020421u. [DOI] [PubMed] [Google Scholar]
- 14.Siegbahn PEM, Eriksson L, Himo F, Pavlov M. J Phys Chem B. 1998;102:10622. [Google Scholar]
- 15.DiLabio GA, Johnson ER. J Am Chem Soc. 2007;129:6199. doi: 10.1021/ja068090g. [DOI] [PubMed] [Google Scholar]
- 16.Reece SY, Hodgkiss JM, Stubbe J, Nocera DG. Philos Trans R Soc Lond B Biol Sci. 2006;361:1351. doi: 10.1098/rstb.2006.1874. [DOI] [PMC free article] [PubMed] [Google Scholar]
- 17.Kaila VRI, Hummer G. J Am Chem Soc. 2011;133:19040. doi: 10.1021/ja2082262. [DOI] [PubMed] [Google Scholar]
- 18.Seyedsayamdost MR, Yee CS, Reece SY, Nocera DG, Stubbe J. J Am Chem Soc. 2006;128:1562. doi: 10.1021/ja055927j. [DOI] [PubMed] [Google Scholar]
- 19.Minnihan EC, Seyedsayamdost MR, Uhlin U, Stubbe J. J Am Chem Soc. 2011;133:9430. doi: 10.1021/ja201640n. [DOI] [PMC free article] [PubMed] [Google Scholar]
- 20.Seyedsayamdost MR, Chan CT, Mugnaini V, Stubbe J, Bennati M. J Am Chem Soc. 2007;129:15748. doi: 10.1021/ja076459b. [DOI] [PubMed] [Google Scholar]
- 21.Seyedsayamdost MR, Argirevic T, Minnihan EC, Stubbe J, Bennati M. J Am Chem Soc. 2009;131:15729. doi: 10.1021/ja903879w. [DOI] [PMC free article] [PubMed] [Google Scholar]
- 22.Un S. Magn Reson Chem. 2005;43:S229. doi: 10.1002/mrc.1660. [DOI] [PubMed] [Google Scholar]
- 23.Bennati M, Farrar CT, Bryant JA, Inati SJ, Weis V, Gerfen GJ, Riggs-Gelasco P, Stubbe J, Griffin RG. J Magn Res. 1999;138:232. doi: 10.1006/jmre.1999.1727. [DOI] [PubMed] [Google Scholar]
- 24.Klein EL, Astashkin AV, Ganyushin D, Riplinger C, Johnson-Winters K, Neese F, Enemark JH. Inorg Chem. 2009;48:4743. doi: 10.1021/ic801787s. [DOI] [PMC free article] [PubMed] [Google Scholar]
- 25.Radoul M, Bykov D, Rinaldo S, Cutruzzolà F, Neese F, Goldfarb D. J Am Chem Soc. 2011;133:3043. doi: 10.1021/ja109688w. [DOI] [PubMed] [Google Scholar]
- 26.Radoul M, Sundararajan M, Potapov A, Riplinger C, Neese F, Goldfarb D. Phys Chem Chem Phys. 2010;12:7276. doi: 10.1039/c000652a. [DOI] [PubMed] [Google Scholar]
- 27.Sundararajan M, Riplinger C, Orio M, Wennmohs F, Neese F. Encyclopedia of Inorganic Chemistry. John Wiley & Sons, Ltd; 2009. [Google Scholar]
- 28.Dam PJv, Willems J, Schmidt PP, Pötsch S, Barra A, Hagen WR, Hoffman B, Anderson KK, Gräslund A. J Am Chem Soc. 1998;120:5080. [Google Scholar]
- 29.Bar G, Bennati M, Nguyen HH, Ge J, Stubbe JA, Griffin RG. J Am Chem Soc. 2001;123:3569. doi: 10.1021/ja003108n. [DOI] [PubMed] [Google Scholar]
- 30.Doan PE, Lees NS, Shanmugam M, Hoffman B. Appl Magn Reson. 2010;37:763. doi: 10.1007/s00723-009-0083-6. [DOI] [PMC free article] [PubMed] [Google Scholar]
- 31.Eriksson M, Uhlin U, Ramaswamy S, Ekberg M, Regnström K, Sjöberg BM, Eklund H. Structure. 1997;5:1077. doi: 10.1016/s0969-2126(97)00259-1. [DOI] [PubMed] [Google Scholar]
- 32.Yokoyama K, Uhlin U, Stubbe J. J Am Chem Soc. 2010;132:8385. doi: 10.1021/ja101097p. [DOI] [PMC free article] [PubMed] [Google Scholar]
- 33.Sinnecker S, Flores M, Lubitz W. Phys Chem Chem Phys. 2006;8:5659. doi: 10.1039/b612568a. [DOI] [PubMed] [Google Scholar]
- 34.Alfonta L, Zhang Z, Uryu S, Loo JA, Schultz PG. J Am Chem Soc. 2003;125:146662. doi: 10.1021/ja038242x. [DOI] [PubMed] [Google Scholar]
- 35.Liu CC, Schultz PG. Annu Rev Biochem. 2010;79:413. doi: 10.1146/annurev.biochem.052308.105824. [DOI] [PubMed] [Google Scholar]
- 36.Yokoyama K, Smith AA, Corzilius B, Griffin RG, Stubbe J. J Am Chem Soc. 2011;133:18420. doi: 10.1021/ja207455k. [DOI] [PMC free article] [PubMed] [Google Scholar]
- 37.Folkes LK, Trujillo M, Bartesaghi S, Radi R, Wardman P. Arch Biochem Biophys. 2011;506:242. doi: 10.1016/j.abb.2010.12.006. [DOI] [PubMed] [Google Scholar]
- 38.Mayer M, Hrovat DA, Thomas JL, Borden WT. J Am Chem Soc. 2002;124:11142. doi: 10.1021/ja012732c. [DOI] [PubMed] [Google Scholar]
- 39.Lawrence CC, Bennati M, Obias HV, Bar G, Griffin RG, Stubbe J. Proc Natl Acad Sci U S A. 1999;96:8979. doi: 10.1073/pnas.96.16.8979. [DOI] [PMC free article] [PubMed] [Google Scholar]
- 40.Bender CJ, Sahlin M, Babcock GT, Barry BA, Chandrashekar TK, Salowe SP, Stubbe J, Lindstrom B, Petersson L, Ehrenberg A, Sjoberg BM. J Am Chem Soc. 1989;111:8076. [Google Scholar]
- 41.Schweiger A, Jeschke G. Principles of Pulsed Electron Paramagnetic Resonance. Oxford University Press; 2001. [Google Scholar]
- 42.Backer J. J Comput Chem. 1986;7:385. [Google Scholar]
- 43.Neese F. Univ of Bonn, Germany. 2007 [Google Scholar]
- 44.Weigend F, Ahlrichs R. Phys Chem Chem Phys. 2005;7:3297. doi: 10.1039/b508541a. [DOI] [PubMed] [Google Scholar]
- 45.Schäfer A, Huber C, Ahlrichs R. J Chem Phys. 1994;100:5829. [Google Scholar]
- 46.Perdew JP. Phys Rev B. 1986;33:8822. doi: 10.1103/physrevb.33.8822. [DOI] [PubMed] [Google Scholar]
- 47.Perdew JP. Phys Rev B. 1986;34:7406. [PubMed] [Google Scholar]
- 48.Becke AD. Phys Rev A. 1988;38:3098. doi: 10.1103/physreva.38.3098. [DOI] [PubMed] [Google Scholar]
- 49.Lee C, Yang W, Parr RG. Phys Rev B. 1988;37:785. doi: 10.1103/physrevb.37.785. [DOI] [PubMed] [Google Scholar]
- 50.Becke AD. J Chem Phys. 1993;98:5648. [Google Scholar]
- 51.Neese F, Wennmohs F, Hansen A, Becker U. Chem Phys. 2009;356:98. [Google Scholar]
- 52.Klamt A, Schürmann G. J Chem Soc Perk T. 1993;2:799. [Google Scholar]
- 53.Siegbahn PEM, Blomberg MRA, Pavlov M. Chem Phys Lett. 1998;292:421. [Google Scholar]
- 54.Barone V. Recent advances in density functional methods. 1996;Part I [Google Scholar]
- 55.Kutzelnigg W, Fleischer U, Schindler M. NMR Basic Principles and Progress. 1990;23 [Google Scholar]
- 56.Weigend F. Phys Chem Chem Phys. 2002;4:4285. [Google Scholar]
- 57.Grimme S. J Comput Chem. 2006;27:1787. doi: 10.1002/jcc.20495. [DOI] [PubMed] [Google Scholar]
Associated Data
This section collects any data citations, data availability statements, or supplementary materials included in this article.