Abstract
The beneficial and harmful effects of human exposure to solar ultraviolet radiation (UV-R) are topics that arouse great interest not only among physicians and scientists, but also the general public and the media. Currently, discussions on vitamin D synthesis (beneficial effect) are confronted with the high and growing number of new cases of non-melanoma skin cancer and other diseases of the skin and eyes (harmful effect) diagnosed each year in Brazil. However, the lack of scientific knowledge on the UV-R in Brazil and South America leads to adoption of protective measures based on studies conducted in Europe and USA, where the amounts of UV-R available at surface and the sun-exposure habits and characteristics of the population are significantly different from those observed in Brazil. In order to circumvent this problem, the Brazilian Society of Dermatology recently published the Brazilian Consensus of Photoprotection based on recent studies performed locally. The main goal of this article is to provide detailed educational information on the main properties and characteristics of UV-R and UV index in a simple language. It also provides: a) a summary of UV-R measurements recently performed in Brazil; b) a comparison with those performed in Europe; and, c) an evaluation to further clarify the assessment of potential harm and health effects owing to chronic exposures.
Keywords: Ozone, Prevention and mitigation, Protection, Skin diseases, Ultraviolet rays
INTRODUCTION
Exposure to solar ultraviolet radiation (UV-R) has psychological and physical benefits, mainly related to vitamin D synthesis and prevention of illnesses such as osteoporosis, diabetes type 1, some types of cancer and autoimmune diseases.1,2 On the other hand, excessive exposure to this type of radiation is responsible for several eye disorders like cataracts and pterygium, as well as skin disorders, among which sunburn, premature aging and non-melanoma skin cancers (NMSC). 3,4,5,6 The Brazilian National Cancer Institute (INCA) estimates that over 180,000 new NMSC cases were diagnosed in 2014, corresponding to an estimated risk of 100.8 new cases for each 100 thousand men and 82.2 for each 100 thousand women. It is the most prevalent cancer, representing over 32% of the total new cancer cases diagnosed in the country.7 In addition to the effects on human beings, UV-R is also related to the slower growth of crops and fruits, the diminished production of phytoplankton, the onset of cancers and genetic mutations in fish and amphibians and the wear and deterioration of paints and polymers, among others.8-11
In face of the antagonistic effects provided by sun exposure, one of the main controversies is related to the time required for the beneficial effects to occur without health damage. That is, for synthesis of a significant amount of vitamin D without damage to the skin and eyes. What usually happens in Brazil and in South America is that recommendations are based on UV-R studies and measurements taken in the northern hemisphere, mainly in the USA and Europe. These geographic and climatic conditions are very different from our tropical and subtropical reality. Therefore, news and arbitrary suggestions regarding sun exposure are increasingly common. For example, recommendations of sun exposure for a certain number of minutes so that a certain amount of vitamin D is produced, without any observations regarding the time of year, time of day, skin type, exposed body area or health conditions of the patient. Alternatively, the recommendation is to completely avoid sun exposure or to wear sunscreen even indoors to prevent skin cancer, again without any allusion to geographic, seasonal and human conditions.
Considering that the lack of basic information about UV-R (aspect, interaction with atmospheric components and levels found in Brazil) is one of the main causes for the dissemination of wrong or controversial information, this article has the objective of providing a relevant contribution on the topic by means of continuing medical education. Thus, this study is divided into the following sections: a) UV-R nature; b) UV-R interaction with gases, aerosols and clouds; c) UV-R variability regarding geographic, seasonal and temporal aspects; d) synthesis of UV-R and UV-R measurements performed in Brazil; and e) estimation of adequate times of sun exposure.
UV-R NATURE AND ULTRAVIOLET INDEX (UVI)
The energy emitted by the sun is transmitted in the form of electromagnetic waves. The UV-R, name given to the electromagnetic spectrum band between 100 and 400 nm wavelengths (1 nm = 1 nanometer = 10-9 m), corresponds to less than 10% of the total solar radiation incident on the top of atmosphere. This small spectral radiation band is subdivided, according to recommendation of the International Commission on Illumination (Commission Internationale de l'Éclairage - CIE), into: UVC, between 100 and 280 nm; UVB, between 280 and 315 nm; and UVA, between 315 and 400 nm (Sliney, 2007).12 The remaining over 90% of solar radiation practically correspond to the visible spectrum (400-780 nm) and near infrared spectrum (780-4000 nm).
UV-R undergoes intense attenuation when interacting with atmospheric components along the way to the Earth's surface. As we will see further on, this attenuation depends on the type of incident radiation, which is more intense for the shorter wavelengths. Despite the small radiation amount in in the UV spectral range, such fluxes are responsible for several important photobiological and photochemical effects.
Thus, in view of the need to bring information to the public on UV-R levels, in 1992 Canadian researchers prepared the Ultraviolet Index (UVI), which quickly began to be used as a health prevention means of information by a great number of countries.13 In 1994, the UVI was adopted by the World Health Organization (WHO) as the reference international standard to be used by meteorological services UVI has been the subject of continuous discussions to harmonize it as a form of communication and educational instrument for solar protection.14
The UV Index is a numerical rating scale related to the fluxes of biologically active UV-R that induce erythema formation on human skin, called erythemal irradiance. Each UVI unit represents 0.025 Wm2 of erythemal irradiance. The calculation of this irradiance is given by the product of UV-R spectral fluxes and a function that corresponds to these photobiological effects on human skin, integrated between 280 and 400 nm (therefore, UVA + UVB).15 It is basically the weighted sum of the effects that each UV-R wavelength has on human skin. This biological response may represent, beneficial or harmful, to health.
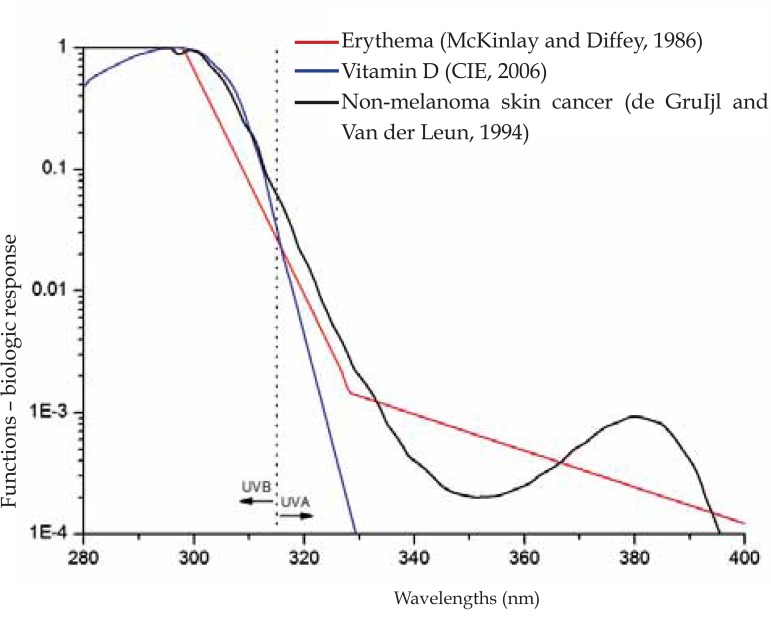
Figure 1 shows the representation of this function for erythema, for vitamin D synthesis and for non-melanoma skin cancer. 15,16,17 The erythemal function is used to represent UVR damage on the human skin because this response is similar as the NMSC curve. In this figure, it is important to note that the vertical axis is on a logarithmic scale, indicating that the UVB-R effects on human beings are much more significant than the UVA-R effects.
FIGURE 1.
Functions – biologic UV-R response for human beings. Erythema (red line), vitamin D synthesis16 (blue line) and nonmelanoma skin cancer17 (black line)
Source: Mc Kinlay AF, et al 1987.15
UVI is a non-dimensional scale, where the erythemal response is of easy interpretation and associated with possible health damage, as shown in chart 1.
CHART 1.
Scheme to divulge and make solar protection recommendations with simple messages
| UVI | Classification of health damage | Color code * | Precaution | Recommendations |
|---|---|---|---|---|
| < 2 | Low | Green(40-149-0) | Unnecessary | You may remain exposed outdoors |
| 3 - 5 | Medium | Yellow(247-228-0) | Recommended | Look for shade at times close to noon! |
| 6 - 7 | High | Orange(248-89-0) | Wear a shirt, sunscreen and hat! | |
| 8 - 10 | Very High | Red(216-0-29) | Indispensable | Avoid exposure close to noon! Make sure that you are in the shade! |
| > 11 | Extreme | Violet(107-73-200) | Shirt, sunscreen and hat required! |
WHO recommends using an official color code for uniform graphic representation of UVI.
In addition to simplicity, UVI aims at warning about the UV-R levels that are dangerous for the health of any individual, and not only for specific types of skin. Although individuals with lighter skins develop erythema faster than darker-skinned individuals, damage and photobiological reactions depend also on other secondary factors such as general health, the types of food consumed and other organic characteristics of each person. Therefore, indexes that take into account the phototype of the individual, like the maximum time of exposure, are strongly discouraged by WHO not only due to the subjectivity of the analysis but also for the uncertainties that forecasts of such time intervals may contain.
VARIABILITY OF UV-R IN FUNCTION OF ATMOSPHERIC, GEOGRAPHIC AND TEMPORAL PARAMETERS
The UV-R levels observed at surface depend on the variability of atmospheric components, such as gases, aerosols and clouds; geographic parameters, such as latitude, longitude, altitude and the surface ability to reflect UV-R; and finally, temporal parameters, such as the time of day and the date.
Atmospheric parameters
UV-R is responsible for a series of photochemical reactions that occur mainly in the higher atmosphere, acting as catalyst of several reactions and exerting marked influence on the heating mechanisms of these layers. Due to these interactions, the UV-R fluxes are considerably attenuated until they reach the surface. However, even in small quantities, UV-R is responsible for the diverse reported effects on living beings and inorganic materials.
As regards the gases present in the atmosphere, ozone is the main absorber of UV-R. Nevertheless, the most energetic part of this type of radiation, the UVC-R, also undergoes strong absorption by the oxygen present in the high stratosphere and does not reach the Earth's surface. Because it is a type of high frequency radiation, UVC-R is lethal to living beings and even commonly used, by means of artificial sources, to sterilize water and surgical equipment. On the other hand, UVB-R is strongly absorbed by the ozone present in the stratosphere, in the region called ozone layer, located at around 30 km in altitude, reaching the Earth's surface in very small quantities, but sufficient to trigger the known photobiological effects. Finally, UVA-R absorption by the gases present in the atmosphere is much weaker, and this type of radiation composes therefore the greater part of UV-R reaching the surface.
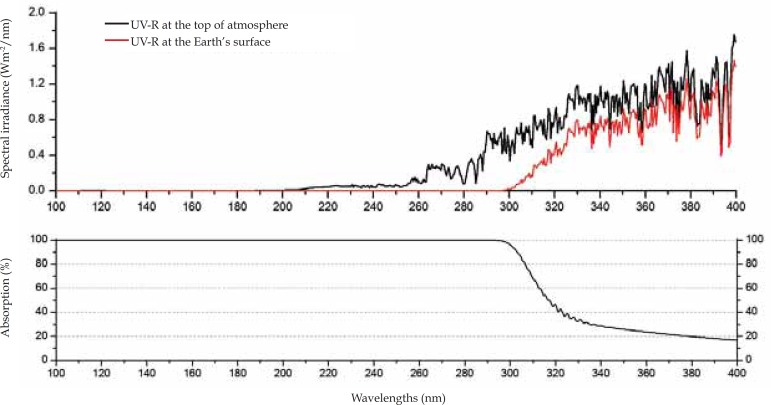
Figure 2 shows, in its upper part, the spectral irradiance both on the top of atmosphere and at the surface, that is, the amount of energy on each wavelength of the UV spectrum. In the lower part of the same figure is shown the relative radiation percentage absorbed mainly by oxygen and ozone.
FIGURE 2.
Spectral irradiance and UV-R absorption. Upper part – Simulation of spectral solar irradiance between 100 and 400 nm incident on the top of atmosphere (black line) and at the Earth’s surface (red line) for clear sky conditions (without clouds). Lower part – UV-R absorption in each wavelength, due to oxygen (in bands of wavelengths lower than 250 nm) and ozone
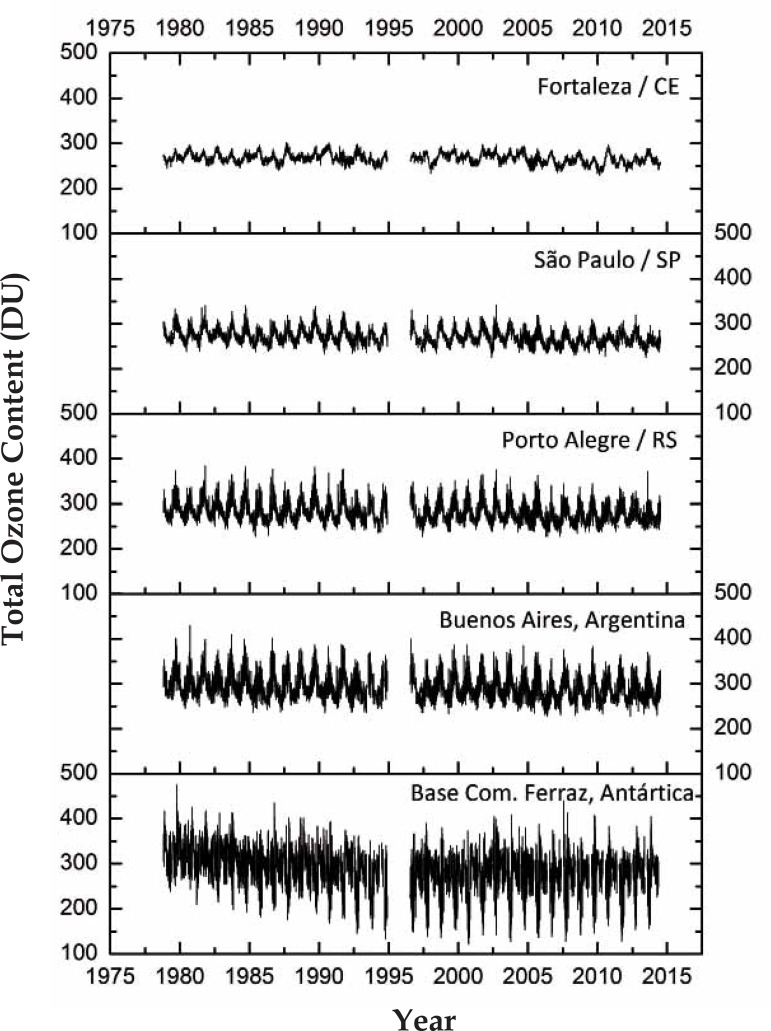
In relation to the ozone, it is very important to emphasize that the phenomenon of depletion of stratospheric ozone, commonly known as "ozone hole", does not exert significant effects on the quantity of this gas over Brazil. This phenomenon of anthropogenic origin happens due to release of chlorine (or bromide) derived from the chlorofluorocarbon (CFC) used mainly in cooling fluids and transported to the stratosphere by natural mechanisms of atmospheric circulation. The release of free chlorine, that occurs by exposure of CFC to UV-R, triggers the destruction of the ozone molecule through the reaction: Cl + O3 ClO + O2. The phenomenon takes place in typical conditions, such as the presence of solar radiation, very low temperatures and presence of atmospheric circulation that makes the concentration of significant quantities of CFC and ozone possible. Such conditions are typical of spring in polar regions, mainly in the Southern hemisphere. For this reason, the "hole" in the ozone layer reaches dimensions of tens of millions of square kilometers in these regions of high latitudes, near the poles. However, in low and medium latitudes, where the Brazilian territory is located, the phenomenon practically does not occur, as shown in the temporal ozone series collected by satellites since 1978 and presented in figure 3.
FIGURE 3.
Temporal series of total ozone content in the atmosphere over five locations in the Southern hemisphere. Fortaleza/CE – 3.7°S; 38.5°W; São Paulo/SP – 23.5°S; 46.6°W; Porto Alegre/RS – 30.0°S; 51.2°W; Buenos Aires/Argentina – 34.6°S; 58.4°W; and, Base Com. .Ferraz/Antarctica – 62.1°S; 58.4°W). Data supplied by sensors/ satellites: OMI/Aura (operating since July/2004); TOMS/Earth Probe (July/1996 – December/2005); TOMS/Meteor-3 (August/1991 – November/1994) and TOMS/ Nimbus-7 (January/1978 – May/1993) s lower than 250 nm) and ozone
Data obtained by backscattering UV satellite sensors - National Aeronautics and Space Administration (NASA).
In figure 3, seasonal and natural ozone variability may be observed in every location, with ozone values smaller in the autumn and larger in the spring, due to the processes of formation, destruction and transportation of this gas in the stratosphere. Nonetheless, only at the Comandante Ferraz base, located in Antarctica, the phenomenon of expressive ozone depletion is noticed at the beginning of spring each year.
A very common mistake is to associate the high levels of UV-R observed in Brazil to the phenomenon of ozone depletion. However, such levels are typical and natural in the greater part of the country, as in low latitudes, close to the Equator, there is naturally more solar radiation available at the surface. Secondly, although natural ozone production is typical of low latitudes, its concentrations are higher in higher latitudes. This phenomenon is due to the same transportation mechanisms already cited for the CFC. For this reason, the ozone content in the Earth's atmosphere has a practically latitudinal variation, which is smaller near the equatorial region and larger near the poles.
In addition to the phenomenon of absorption by ozone, UV-R also undergoes intense scattering by molecules and aerosols present in the atmosphere. In scattering, the energy incident in one direction is deviated (scattered) to other directions, without alteration of its wavelength, resulting in production of diffuse radiation. The intensity of UV-R scattering by molecules is inversely proportional to the fourth power of the incident radiation wavelength. For this reason, the UVB-R is scattered by molecules with more intensity than UVA-R.
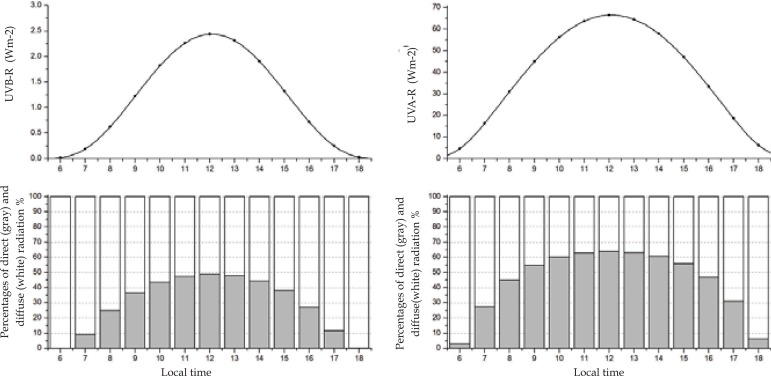
Figure 4 exemplifies the effect of diffuse radiation production in UVB and UVA radiations by means of computational simulation. The upper part of the figure shows the different intensities of UVB-R and UVA-R bands in a clear sky day in the summer. In this case, the simulation was performed for a location in the Southeast of the country, but similar values can be observed in any region at this time of the year. In the lower part of figure 4 are shown the percentages of direct and diffuse radiation for both bands.
FIGURE 4.
UVB and UVA irradiance and the relationship between them. Upper part – UVB irradiance, on the left, and UVA irradiance, on the right (in Wm-2), typical of a clear sky day in summer solstice. Lower part – Composition of the radiation beam. Percentage of beam derived from direct (gray) and diffuse (white) radiation
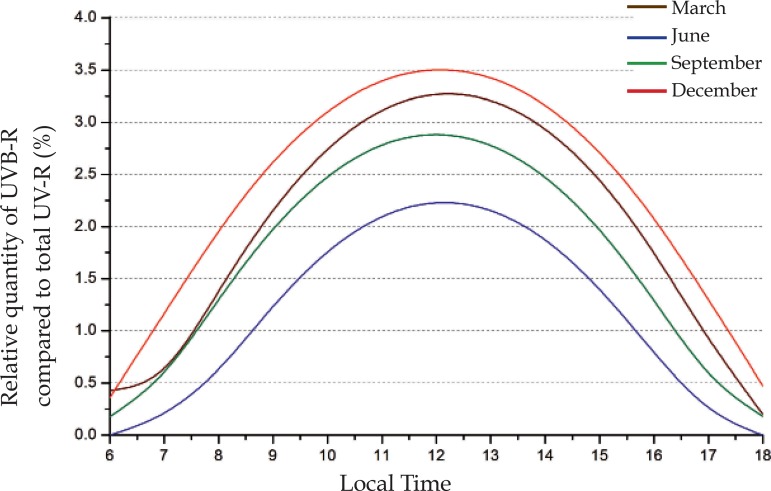
At the beginning and end of the day, UV-R at the surface is practically composed of diffuse radiation, derived from scattering that originates from distinct solar circle directions. On the other hand, at times close to noon, UV-R is mainly composed of direct radiation. In the case of UVB-R, due to the intense scattering, even at solar noon, most of the radiation reaching a target at the surface is diffuse. In addition, it is important to note the orders of magnitude involved in figure 4 charts, with some UVB-R units of energy per square meter reaching the surface, while for UVA-R the amount of energy is a few dozens. Thus, due to the spectral dependence of absorption and scattering phenomena, in a clear sky day (without clouds), less than 5% of total UV-R at surface is of the UVB type, while all the rest is UVA-R, as shown in figure 5. At the beginning and end of the day, practically all the UV-R at surface is composed of UVA-R.
FIGURE 5.
Variability of UVB-R in relation to total UV-R during the year. Relative quantity of UVB-R (%) in total UV-R reaching the Earth’s surface in summer (December) and winter (July) solstices, and autumn (March) and spring (September) equinoxes. Simulations were based on average total ozone contents between the years 2004 and 2012 for the city of São Paulo/SP, considering clear sky conditions (no clouds)
This relationship can be even smaller in polluted days, with clouds, or in winter months when global fluxes of solar radiation are smaller. These two mentioned atmospheric components, aerosols (here identified as natural or anthropic pollution) and clouds, are also very important in the assessment of UV-R at the surface.
The atmospheric aerosols are usually good UV-R scatters, diminishing the amount of radiation reaching the surface by scattering it to other space directions. In situations of very polluted environments and consequently presence of a great quantity of aerosols in the atmosphere, the UV-R attenuation tends to be significant, but not enough to have a protective effect. In situations of peaks of pollution in large cities, it is possible to note attenuation of around one UVI unit. 18 Large amounts of pollutants, as in biomass burning or forest fires, can induce more expressive attenuation in UV-R fluxes. Nevertheless, common situations of aerosol concentration in urban environments induce smaller attenuation in UV-R fluxes and cannot be interpreted as protection against this type of radiation.
In the case of clouds, they act most of the time as good attenuators, as they are also UV-R scatterers. For example, the presence of a homogeneous and stratified cloud cover may reduce UV-R levels by half when compared to a clear sky day; while very deep clouds, like storm cumulonimbus, may practically extinguish UV-R at the surface. However, in very particular situations, UV-R levels at surface may be intensified by clouds. This phenomenon occurs by light reflexion on the laterals of clouds type cumulus, those commonly observed in sunny summer days; or by the ice crystals in thick cirrus clouds, but these clouds are uncommon in Brazil.
In face of the dynamism and heterogeneity, besides the variable quantity and different compositions of clouds, it is not possible to predict in detail the type of cloud formation nor its characteristics. Therefore, there is no way to establish precise attenuation factors and consequently there is no way to propose safe exposure periods of time in relation to cloud conditions.
Geographic parameters
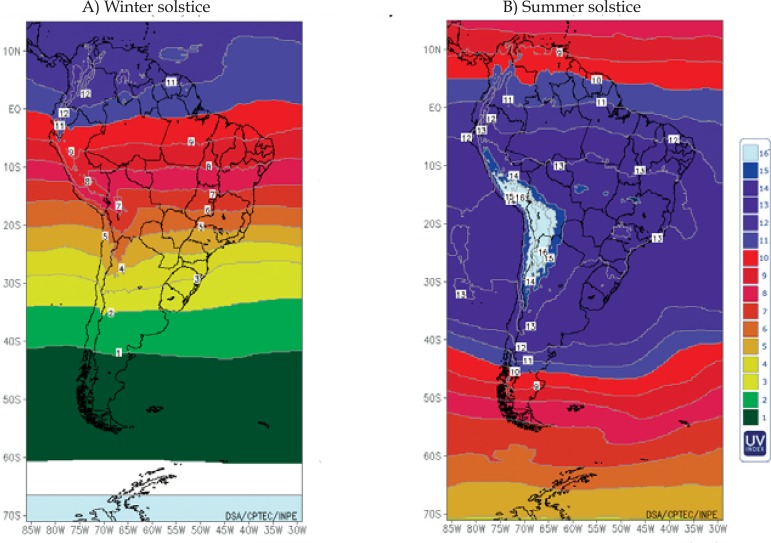
Latitude is the determining factor in the amount of solar radiation at the Earth's surface. The yearly availability of solar radiation is greater in locations near the Equator and decreases towards the poles. This variation is due to less inclination of sun rays in lower latitudes. However, as the Earth revolves with an inclination of approximately 23º in relation to the Sun, the latitudes around this angle receive the greater amount of summer solar radiation. For this reason, in summer the higher UVI values in Brazil are observed in the Southeast region, which is at approximately 23º latitude. Figure 6 illustrates this latitudinal variation for winter and summer solstices in South America.
FIGURE 6.
Numerical UVI simulation at solar noon, for clear sky conditions (no clouds)
Source: Division of Satellites and Environmental Systems - CPTEC/INPE (http://satelite.cptec.inpe.br)
Figure 6(a) refers to winter solstice in the Southern hemisphere, that is, the shortest day in the year and when the Sun is least elevated at solar noon. In this case, the extreme UVI values (> 11) are observed only in the north of the states of Amazonas and Pará, gradually diminishing as the latitude increases. It is important to note that even in the Southern hemisphere winter, the UVI may reach very high values (UVI between 8 and 11) in practically all the Brazilian North and Northeast, while medium and high UVI are common, in clear sky days, in the Southeast region of the country.
In figure 6(b), regarding summer solstice, therefore the longest day in the year, when the Sun passes closer to zenith, the UVI at solar noon reaches maximum values in an extensive range that covers all of the Southeast, Midwest and a great part of the South and Northeast regions of Brazil. In this area and at this time of year, the UVI in clear sky conditions is invariably extreme, for the fact that at solar noon the Sun passes practically directly overhead. In this case, solar radiation goes through a smaller optic pathway, undergoing less attenuation by atmospheric components. For this reason, in summer, the UVI reaches maximum values in that region, gradually diminishing both toward the Equator and toward the South pole. The south of South America, between 50º and 60º of latitude, for example, also has marked seasonality. However, in the summer, the maximum UVI values are between 7 and 8 for clear sky, while in the winter they are almost always below 2.
A quite common mistake is to attribute the occurrence of summers and winters to the distance variation from Earth to the Sun. However, the variation of the distance between the aphelion and the perihelion is around 3%, making solar radiation variations not very significant. Furthermore, if winters and summers were defined by the Earth going farther from the Sun, the seasons of the year would be the same in both hemispheres. Therefore, the differences in solar radiation intensity in the winter and in the summer are due to the Earth's angle of inclination in its revolution movement around the Sun. For this reason, summers in the Southern hemisphere coincide with winters in the Northern hemisphere, and vice versa.
Another relevant geographic parameter to determine UVI is the altitude of the surface. Studies show that above 1000 m altitude, UV-R levels increase between 5 and 10 % for each kilometer of increased height.19,20 This phenomenon is due to atmospheric rarefaction with higher altitude, decreasing the scattering effect in attenuation of UV-R. In the Bolivian Andes, at around 4000 m altitude, where are located important population agglomerations like La Paz and El Alto, for example, the UVI are the highest in the world. In figure 6 (b) this region is highlighted in light blue, showing UVI above 16, commonly reaching UVI values above 20! Recently a German research group detected, by means of measurements in that region, the world UVI record, never before registered in the planet: 43.2.21
Finally, the ability of the surface to reflect UV-R should also be considered. Surfaces like grass, sand and asphalt reflect between 1 and 5%, while surfaces painted white or finer sand can reflect up to 10% of the incident UV-R. On the other hand, snow has a high reflectance in the UV spectrum; in case of dry and fresh snow it may reflect more than 90% of the incident UV-R.22,23 For this reason solar protection, mainly wearing sunglasses, is highly recommended to those facing exposure in snowy regions.
Temporal parameters
The position of the Sun in a particular locality varies according to time of day and day of the year. Such parameters are directly related to the geographic factors, since the length of the day and characterization of seasons depend on the location studied. Figure 6 shows the seasonal variability of UV-R according to the location. While places near the line of the Equator present UVI very high and practically constant during the entire year, higher latitudes have marked seasonality with higher UVI in the summer and lower in the winter. As previously explained, this variability is due to the relative position between the Sun and the Earth.
The same explanation may be used to justify the UVI variation during the diurnal cycle of the Sun. Roughly speaking, this means that, in one day, the Sun follows a path where it rises on the horizon, reaches a point of maximum elevation at solar noon and gradually returns to the horizon. For this reason, close to sunrise or sunset, UV-R undergoes higher interaction with the molecules present in this trajectory across the atmosphere and practically does not reach the surface (or reaches it in very small amounts). On the other hand, the availability of solar radiation at solar noon is the maximum observed. Obviously clouds and other atmospheric components may exert effects that increase or diminish the quantity of radiation at the surface.
BREAKING PARADIGMS: A SUMMARY OF THE UV-R MEASUREMENTS PERFORMED IN BRAZIL
There is an intrinsic connection between the occurrence of different illnesses and weather and climate conditions; awareness of this relationship is essential not only for prevention, but also for mitigation of social and economic impacts. For this reason, in the last ten years, interest in interdisciplinary studies involving meteorological, epidemiological and human health aspects has grown significantly in Brazil. As regards skin cancer specifically, whose high and growing incidence rate is cause for great concern, measurements and studies on UV-R in Brazil provide a new perspective on the subject.
An experiment carried out in the city of São Paulo/SP, for example, collected UVI data every ten minutes for four years. 24 This extensive database has shown that approximately 60% of UVI measurements registered between 11:00 a.m. and 01:00 p.m. in the summer in the city of São Paulo were classified as posing very high or extreme risk of health damage, according to chart 1. These classifications were also observed in 45% of measurements taken in the autumn and in almost 30% of those taken in the spring. During this period UVI above 15 were observed in some episodes.
A more recent study evaluated UV-R measurements performed in Ilhéus/BA, Itajubá/MG and São Paulo/SP. The results show that the high levels of UV-R are common in the entire country. 25 The daily doses of erythemal irradiance are, on average, higher in the Brazilian northeast. Nevertheless, the maximum doses observed in the country are registered in the Southeast region during the summer. In 5% of these measurements the cumulative doses surpass 6000 Jm-2; that is, over 24 times the minimum erythema dose (MED) for a phototype II individual or more than 13 times for a phototype IV individual. 26 The same study shows that the cumulative summer doses have averages (± standard deviation) of 4860 ± 860, 4180 ± 1320 and 4520 ± 1210 Jm-2 in Ilhéus/BA, Itajubá/MG and São Paulo/SP, respectively. However, in clear sky summer days, it is common to observe daily doses of almost 7000 Jm-2 in São Paulo. In the winter, these doses are evidently smaller in these three locations, respectively: 2870 ± 740, 2550 ± 790 and 2250 ± 850 Jm-2. In any case, even when we consider winter values, these relatively high quantities are over twenty times the daily dose recommended by WHO. That is, UV-R episodes of great intensity are noted even in winter.
Relevant erythemal UV-R doses may be registered at times commonly considered as safe for exposure. For example, in some measurements performed during the summer, doses up to 660 Jm-2 were registered until 10:00 a.m. in city of São Paulo. Considering that MED for phototype II individuals is 250 Jm-2; in this situation an individual exposed before 10:00 a.m. could receive approximately 2.6 times the minimum amount of radiation to develop erythema. As for phototype IV, this dose would be 1.5 times higher than a MED of 450 Jm-2, pointing to health risks even for individuals with skin more resistant to damage triggered by UV-R. 25
Another significant episode was observed, between 9:00 p.m. and noon, at Praia de Ponta Negra, Natal/RN, on March 13, 2011. In this episode, almost at the end of summer, UVI greater than 10 were registered at 9 o'clock in the morning. In a period of 2.5 hours, 5250 Jm-2 of erythemal UV-R were accumulated. That is, almost 50 times the daily dose recommended by WHO. In this situation, at 9:00 a.m. a phototype IV individual would be exposed to the MED in little more than 15 minutes.
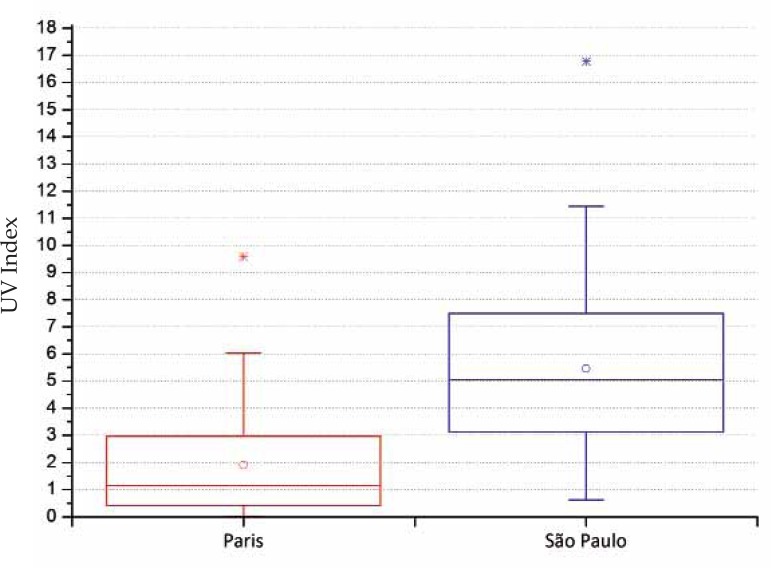
Finally, it is important to analyze such data in comparison with those collected in the Northern hemisphere. For example, figure 7 shows a comparison between temporal series of measurements performed in the cities of São Paulo, Brasil and Paris, France.24,25,27 These statistics of two large experiments, performed at different geographic positions (Paris, 48º north latitude and São Paulo, 23º south latitude), reveal the significant difference between the UVI of these locations. Despite the distinct measurement periods, it is important to emphasize that they are significant samples, with over 300,000 data measured in each one of these locations. During these periods, different atmospheric situations could be observed and no anomalies were detected in ozone concentrations, so that they can be considered reliable UVI samples for both locations.
FIGURE 7.
Boxplot of UVI reading databases. Readings taken around solar noon (one hour before and one hour after) in the cities of Paris (2011-2013)27 and São Paulo (2006- 2009),25. The circle indicates the average, the boxplots show the 5° and 95° percentile and the asterisk the maximum value found in the period
Source: de Paula Corrêa M, et al, 201024; de Paula Corrêa M, et al, 201325 and Jégou F, et al 201127
The first outstanding result in the box-plots distribution is that 75% of the readings taken in Paris are below the UVI = 3. In São Paulo exactly the contrary happens, as 75% of readings are above UVI = 3. Almost 25% of all readings taken in São Paulo show UVI higher than 8. This is quite an expressive number, taking into account that this statistical analysis considers all of the seasons in the year, including winter, as well as cloudy or rainy days. UVI values up to 11.5 are reasonably common (below P95), while the record UVI observed in the city was 16.8 in the summer of 2008. On the other hand, UVI values higher than 6 encompass less than 5% of the data collected in Paris; and, the larger UVI observed in that city is quite common in the spring or autumn in the city of São Paulo.
FINAL CONSIDERATIONS
This paper shows that the current recommendations regarding solar protection, based on research carried out mainly in the USA and Europe, are not adequate for the Brazilian reality. Most of the Brazilian territory is located in the tropical and subtropical regions of the Southern hemisphere, where solar radiation availability is quite elevated and ozone concentrations are naturally smaller. For these reasons, the UVI observed in Brazil, as a rule, reach the highest UVI scales recommended by WHO, that is, very high (UVI between 8 and 10) or extreme (UVI higher than 11) damage to human health. In the North and Northeast of the country such values may be observed even before 9 o'clock in the morning. In the South and Southeast regions, at solar noon, UVI values are characterized by marked seasonality, with extreme values in the summer and from medium to high in the winter. However, it is during summer in the Southeast region of the country that Brazilian records are observed, with UVI episodes higher than 15.
This new information regarding UVI distribution in Brazil is an important subsidy for reflection about mitigation of the skin cancer problem in the country. These very high UVI require that prevention, when considering solar protection, be part of daily care of each citizen. Efforts like the Brazilian Consensus on Photoprotection are fundamental for harmonization and enhancement of preventive campaigns. Together with such efforts, it is important that opinion leaders, including those in the medical profession, in their daily contact with the patients, be aware that good sense concerning exposure is an indispensable tool to avoid skin cancer. For that reason, awareness about UV-R characteristics and variability is fundamental for the health professional to impart clear and precise information. It is hoped that this article has met this goal.
Based on this fundamental knowledge it is concluded that there is no way to speak about an adequate time of day or time of year recommended for Sun exposure, as regional and meteorological variability is significant in the different seasons of the year and regions of the country. Therefore, to reinforce recommendations regarding the need to avoid prolonged exposure and to use different forms of protection, in practically any time of the year, are indispensable. In relation to forms of protection, it is relevant to include also alternatives to conventional sunscreens, which are expensive for most of the Brazilian population, like wearing protective clothing, hats and sunglasses. It is important that these warnings and awareness of possible health damage be extended to children and adolescents, especially because the studies that take into account climactic changes do not point to significant alterations in UV-R levels until the end of this century. 28 It is fundamental that the new generations adopt a new behavior, more careful and quite distinct from the current one.
Footnotes
Financial Support: France: GIS/Climat; Brazil: Fapemig, Fapesp and CNPq.
Conflict of Interest: None.
How to cite this article: Corrêa MP. Solar ultraviolet radiation: properties, characteristics and amounts observed in Brazil and South America. An Bras Dermatol. 2015;90(3):297-313.
Study carried out at the Instituto de Recursos Naturais - Universidade Federal de Itajubá (Unifei) – Itajubá (MG), Brazil.
Reference
- 1.Ponsonby AL, Lucas RM, van der Mei IA. UVR, Vitamin D and Three Autoimmune Diseases-Multiple Sclerosis, Type 1 Diabetes, Rheumatoid Arthritis. Photochem Photobiol. 2005;81:1267–1275. doi: 10.1562/2005-02-15-IR-441. [DOI] [PubMed] [Google Scholar]
- 2.Holick MF. Vitamin D: importance in the prevention of cancers, type 1 diabetes, heart disease, and osteoporosis. Am J Clin Nutr. 2004;79:362–371. doi: 10.1093/ajcn/79.3.362. [DOI] [PubMed] [Google Scholar]
- 3.Young AR. Acute effects of UVR on human eyes and skin. Prog Biophys Mol Biol. 2006;92:80–85. doi: 10.1016/j.pbiomolbio.2006.02.005. [DOI] [PubMed] [Google Scholar]
- 4.Chang NB, Feng R, Gao Z, Gao W. Skin cancer incidence is highly associated with ultraviolet-B radiation history. Int J Hyg Environ Health. 2010;213:359–368. doi: 10.1016/j.ijheh.2010.06.006. [DOI] [PubMed] [Google Scholar]
- 5.D'Orazio J, Jarret S, Amaro-Ortiz A, Scott T. UV Radiation and the Skin. Int J Mol Sci. 2013;14:12222–12248. doi: 10.3390/ijms140612222. [DOI] [PMC free article] [PubMed] [Google Scholar]
- 6.Madan V, Lear JT, Szeimies RM. Non-melanoma skin cancer. Lancet. 2010;375:673–685. doi: 10.1016/S0140-6736(09)61196-X. [DOI] [PubMed] [Google Scholar]
- 7.Inca.gov.br [Internet]. Instituto Nacional de Câncer José Alencar Gomes da Silva. Coordenação de Prevenção e Vigilância . Estimativa 2014: Incidência de Cancer no Brasil. Rio de Janeiro: INCA; 2014. [acesso 31 mar 2014]. pp. 124–124. Disponível em: http://www.inca.gov.br/estimativa/2014/ [Google Scholar]
- 8.Caldwell MM, Ballaré CL, Bornman JF, Flint SD, Björn LO, Teramura AH, et al. Terrestrial ecosystems, increased solar ultraviolet radiation and interactions with other climatic change factors. Photochem Photobiol Sci. 2003;2:29–38. doi: 10.1039/b211159b. [DOI] [PubMed] [Google Scholar]
- 9.Häder DP, Kumar HD, Smith RC, Worrest RC. Aquatic ecosystems: effects of solar ultraviolet radiation and interactions with other climatic change factors. Photochem Photobiol Sci. 2003;2:39–50. doi: 10.1039/b211160h. [DOI] [PubMed] [Google Scholar]
- 10.Tietge JE, Diamond SA, Ankley GT, DeFoe DL, Holcombe GW, Jensen KM, et al. Ambient solar UV radiation causes mortality in larvae of three species of rana under controlled exposure conditions. Photochem Photobiol. 2001;74:261–268. doi: 10.1562/0031-8655(2001)074<0261:asurcm>2.0.co;2. [DOI] [PubMed] [Google Scholar]
- 11.Andrady AL, Hamid HS, Torikai A. Effects of climate change and UV-B on materials. Photochem Photobiol Sci. 2003;2:68–72. doi: 10.1039/b211085g. [DOI] [PubMed] [Google Scholar]
- 12.Sliney DH, International Commission on Illumination Radiometric Quantities and Units Used in Photobiology and Photochemistry: Recommendations of the Commission Internationale de l'Eclairage (International Commission on Illumination) Photochem Photobiol. 2007;83:425–432. doi: 10.1562/2006-11-14-RA-1081. [DOI] [PubMed] [Google Scholar]
- 13.Kerr JB, McElroy CT, Tarasick DW, Wardle DI. Proceedings; The Canadian Ozone Watch and UV-B advisory programs. Quadrennial Ozone Symposium ; 1992 Jun 4-12; Virginia: National Aeronautics and Space Administration; 1994. pp. 794–797. [Google Scholar]
- 14.who.int/uv [Internet]. World Health Organization. World Meteorological Organization. United Nations Environment Programme International Commission on Non-Ionizing Radiation Protection Global solar UV index: a practical guide. [cited 2014 Oct 08]. Available from: http://www.who.int/uv/publications/en/UVIGuide.pdf.
- 15.Mc Kinlay AF, Diffey BL. A reference spectrum for ultraviolet induced erythema in human skin. CIE J. 1987;6:17–22. [Google Scholar]
- 16.International Commission on Illumination . Action spectrum for the production of previtamin D3 in human skin. 2006. CIE Technical Report 174. [Google Scholar]
- 17.de Gruijl FR, Van der Leun JC. Estimate of the wavelength dependency of ultraviolet carcinogenesis in humans and its relevance to the risk assessment of stratospheric ozone depletion. Health Phys. 1994;67:319–325. doi: 10.1097/00004032-199410000-00001. [DOI] [PubMed] [Google Scholar]
- 18.Corrêa MP, Planafattori A. Uma análise das variações do índice ultravioleta em relação às observações de conteúdo de ozônio e da espessura óptica dos aerossóis sobre a cidade de São Paulo. Rev Bras Meteor. 2006;21:24–32. [Google Scholar]
- 19.Zaratti F, Forno RN, Garcia J, Andrade M. Erythemally weighted UV-B variations at two high altitude locations. J Geo Res. 2003;108:4263–4268. [Google Scholar]
- 20.Rivas M, Rojas E, Cortez JN, Santander E. Efecto de la altura en la radiación solar ultravioleta en Arica norte de Chile. Rev Fac Ing UTA. 2002;10:59–62. [Google Scholar]
- 21.Cabrol NA, Feister U, Häder D-P, Piazena H, Grin EA, Klein A. Record solar UV irradiance in the tropical. Andes Front Environ Sci. 2014:2–19. [Google Scholar]
- 22.Corrêa MP, Ceballos JC. UVB surface albedo measurements using biometers. Rev Bras Geof. 2008;26:411–416. [Google Scholar]
- 23.Blumthaler M, Ambach W. Solar UVB-Albedo of various surfaces. Photochem Photobiol. 1988;48:85–88. doi: 10.1111/j.1751-1097.1988.tb02790.x. [DOI] [PubMed] [Google Scholar]
- 24.de Paula Corrêa M, Ceballos JC. Solar Ultraviolet Radiation Measurements in One of the Most Populous Cities of the World: Aspects Related to Skin Cancer Cases and Vitamin D Availability. Photochem Photobiol. 2010;86:438–444. doi: 10.1111/j.1751-1097.2009.00659.x. [DOI] [PubMed] [Google Scholar]
- 25.de Paula Corrêa M, Pires LC. Doses of erythemal ultraviolet radiation observed in Brazil. Int J Dermatol. 2013;52:966–973. doi: 10.1111/j.1365-4632.2012.05834.x. [DOI] [PubMed] [Google Scholar]
- 26.Fitzpatrick T. The validity and practically of sun reactive skin types I through VI. Arch Dermatol. 1988;124:869–871. doi: 10.1001/archderm.124.6.869. [DOI] [PubMed] [Google Scholar]
- 27.Jégou F, Godin-Beekman S, Corrêa MP, Brogniez C, Auriol F, Peuch VH, et al. Validity of satellite measurements used for the monitoring of UV radiation risk on health. Atmos Chem Phys. 2011;11:13377–13394. [Google Scholar]
- 28.Corrêa Mde P, Godin-Beekmann S, Haeffelin M, Bekki S, Saiag P, Badosa J, et al. Projected changes in clear-sky erythemal and vitamin D effective UV doses for Europe over the period 2006 to 2100. Photochem Photobiol Sci. 2013;12:1053–1064. doi: 10.1039/c3pp50024a. [DOI] [PubMed] [Google Scholar]


