

Abstract
Positron emission tomography (PET) has become an important modality in medical and molecular imaging. However, in most PET applications, the resolution is still mainly limited by the physical crystal sizes or the detector’s intrinsic spatial resolution. To achieve images with better spatial resolution in a central region of interest (ROI), we have previously proposed using collimation in PET scanner. The collimator is designed to partially mask detector crystals to detect lines of response (LORs) within fractional crystals. A sequence of collimator-encoded LORs is measured with different collimation configurations. This novel collimated scanner geometry makes the reconstruction problem challenging, as both detector and collimator effects need to be modeled to reconstruct high-resolution images from collimated LORs. In this paper, we present an LOR-interleaving (LORI) algorithm, which incorporates these effects and has the advantage of reusing existing reconstruction software, to reconstruct high-resolution images for PET with fractional-crystal collimation. We also develop a 3-D ray-tracing model incorporating both the collimator and crystal penetration for simulations and reconstructions of the collimated PET. By registering the collimator-encoded LORs with the collimator configurations, high-resolution LORs are restored based on the modeled transfer matrices using the nonnegative least-squares method and EM algorithm. The resolution-enhanced images are then reconstructed from the high-resolution LORs using the MLEM or OSEM algorithm. For validation, we applied the LORI method to a small-animal PET scanner, A-PET, with a specially designed collimator. We demonstrate through simulated reconstructions with a hot-rod phantom and MOBY phantom that the LORI reconstructions can substantially improve spatial resolution and quantification compared to the uncollimated reconstructions. The LORI algorithm is crucial to improve overall image quality of collimated PET, which can have significant implication in preclinical and clinical ROI imaging applications.
Keywords: LOR-interleaving, fractional-crystal collimation, image reconstruction, positron emission tomography (PET)
1. Introduction
Positron emission tomography (PET) has become an important modality in medical and molecular imaging. In the past few decades the performance of PET systems has been substantially improved in terms of spatial resolution and sensitivity. However, in most PET applications, the resolution of PET systems is still mainly limited by the physical sizes of the scintillator crystals or the intrinsic spatial resolution of the photon detectors (Stickel and Cherry 2005). For discrete crystals, the empiric formula proposed by Moses and Derenzo states that the imaging resolution is approximately equal to half of the crystal width. Other factors, such as positron range, noncolinearity, block effect, patient motion and reconstruction algorithm, also affect the spatial resolution (Moses and Derenzo 1993). In general, three types of methods can be used to improve the spatial resolution. The most direct method is to reduce the crystal size (i.e. increase the number of crystals per unit area) by scintillator manufacturing techniques (Cherry et al. 1997, Miyaoka et al. 2001, Yang et al. 2011). The reduction in crystal size can effectively improve the spatial resolution; however, it may not be cost effective with current manufacturing processes and it leads to increased inter-crystal scatter.
Super-resolution, the second method, is an image-processing based method to improve the spatial resolution. A high-resolution image can be generated by combining multiple sets of low-resolution images from different points of views. Super resolution techniques have been applied in PET with mechanical motion of the scanner or the object, e.g. scanner wobbling (Dagher and Thompson 1985), dichotomic motion (Cho et al. 1981), and object shifting or rotating (Kennedy et al. 2006, Suk et al. 2008, Chang et al. 2008). The rationale behind super resolution is that the oversampling of the object with proper translation or rotation provides new information which can be fused by super-resolution algorithms (Irani and Peleg 1993, Jeong et al. 2011, Wallach et al. 2012, Li et al. 2014). Resolution modeling is also an image-processing based method, and it can boost the midrange frequencies and improve spatial resolution by modeling the blurring process. However, resolution modeling can also cause edge artifacts (Snyder et al. 1987, Alessio et al. 2006, Zhang et al. 2010, Tong et al. 2011).
Adaptive imaging, the third method, is another effective method to improve spatial resolution using a high-resolution insert or collimation (Barrett et al. 2008, Zhou and Qi 2011a). The adaptive method needs an adjustable collimator or detector that can be changed during data-acquisition to adjust the trade-off between field of view (FOV), resolution and sensitivity. Tai et al. introduced a virtual-pinhole PET (VP-PET) approach by using a high-resolution ring or half-ring detector insert to improve the spatial resolution (Tai et al. 2008). A variant of VP-PET is the so-called “zoom-in” approach, which uses a single high-resolution depth-of-interaction (DOI) detector to reduce parallax errors (Qi et al. 2011). These two approaches can improve the spatial resolution near the high-resolution insert; however, they require modifications to the existing PET system and increase the cost substantially because of both the high-resolution insert and increased number of electronics channels.
We recently proposed a novel approach to improve the spatial resolution inside a central region of a PET system by adding a specially designed collimator (Metzler et al. 2013, Li and Metzler 2012, Li et al. 2012). The collimator runs the axial length of a PET scanner and has a translational symmetry axially. With the collimator, each detector crystal can be conceptually split into 2 sub-crystals by masking the first or second half of the crystal with a high-density attenuator, e.g. tungsten, as shown in figure 1. Each crystal pair can measure 22 times as many resolution-enhanced LORs with 4 possible collimation combinations. Our collimator is designed to measure all interleaved LOR combinations by just rotating the collimator. Our collimated PET method can improve both linear and angular sampling, and especially, it can improve the spatial resolution beyond the physical crystal size and detector intrinsic resolution. Obviously, there is a tradeoff among resolution, sensitivity and held of view (FOV). As a consequence of using the collimator, the sensitivity of the collimated PET is approximately 1/4 of that of the uncollimated PET. This may result in a longer scan time for some imaging scenarios that need more spatial information per photon (Metzler et al. 2013). The collimator can also limit the useful scanner FOV to a relatively small central cylindrical region.
Figure 1.

The 2-D cross-section of the proposed PET collimator geometry with 8 segments, bounded by dashed lines, to allow different collimator configurations. The collimator has two FOVs, the sampling FOV and the efficient FOV, whose diameters are Dsin(π/8) and Dsin (α/2), respectively. D is the scanner diameter, and α is the full-acceptance angle of the collimator septa.
Our collimated PET method, in general, belongs to the adaptive category since it can provide scout imaging and region-centric imaging with uncollimated and collimated scans, respectively. It also has all the virtues of the super-resolution method since the object is also over-sampled with collimator rotations. Also collimated PET has conceptual similarity to the movable filter plate used for a gamma camera by Jaszczak (Jaszczak 1973). They both provide additional collimation and improve resolving capability.
Since the collimator is not ideal, each measured LOR with collimation is a mixture of true high-resolution LORs with mixing coefficients determined by collimator attenuation. The high-resolution LOR information is modulated with the collimator attenuation profile and acquired in the form of collimator-encoded LORs. This non-ideal collimated scanner geometry makes the reconstruction problem challenging, as both detector and collimator effects need to be modeled to reconstruct high-resolution images from the collimated-encoded LORs. In this study, we present an LOR-interleaving (LORI) technique to fully utilize the LOR spatial information from the collimated LORs and reconstruct high-resolution images from a set of collimated sinograms.
2. Collimator description and reconstruction
2.1. Collimator geometry and LOR sampling
We designed trapezoidal tungsten collimator septa to mask half of each crystal transversely in a PET scanner to detect collimator-modified LORs within the unmasked portion of the crystals. The collimator septa are highly attenuating bars that run the axial length of the scanner which can cover either the first half or the second half of the crystals. Each crystal can be conceptually split into two sub-crystals, and each pair of crystals can measure 4 resolution-enhanced LORs with 4 ideal collimator configurations. In general, the collimator can be partitioned into M azimuthal segments. Septa within a segment expose the same portions of the crystals at the same time; septa can be configured either to expose the first half (0) or the second half (1) of the crystals. The complete LOR sub-sampling for each crystal pair with collimation requires that LORs between any two segments (not within a segment) need to be measured with 4 different configurations (00, 01, 10 and 11). We divide the PET collimator into M = 8 segments, A–H, as shown in figure 1. We configure the 8 segments as [0, 0, 0, 1, 1, 0, 1, 1]. We then acquire data with 8 collimator positions by rotating the collimator 8 successive times in 45° steps.
This sampling scheme has a sampling FOV with diameter D sin (π/8) due to the collimator segmentation, where D is the scanner diameter. LORs between each segment and the opposite 3 segments (within the sampling FOV) can be measured with all 4 configurations, e.g., segment pairs BE, BF and BG. LORs between any adjacent 2 segments (outside of the sampling FOV), e.g. AB and AC, may not be sampled completely. One can verify that all LORs with 8 rotations—except between adjacent segments which would fall outside the sampling FOV—are completely sampled with a redundancy factor of 2, see Table I in (Li et al. 2012). The septa have a full-acceptance angle of α, so they block the gamma rays with incident angles larger than α/2 from perpendicular. The acceptance angle determines an efficient FOV (eFOV) with diameter of D sin (α/2). So the diameter of the final FOV is
| (1) |
We simulated a collimator with relatively small efficient FOV of 15 mm diameter for a small-animal PET scanner, A-PET. The collimator was designed to have a relative sensitivity of 1/4 compared to the uncollimated case (Li et al. 2012). We used A-PET as a testbed for our PET collimator to demonstrate the feasibility and performance advantage of the collimator. A-PET contains 14,456 crystals (278 transverse × 52 axial) with sizes of 2 × 2 × 10 mm3 (crystal pitches: 2.34 mm transverse, 2.31 mm axial) (Surti et al. 2003, Surti et al. 2005).
2.2. ML reconstruction with collimated data
The measurements from a collimated-PET system comprise acquisitions with M different collimator configurations/rotations. The M measurements are modeled as statistically independent Poisson random vectors with the expectations ḡm ∈ ℝNd, m = 0, 1, … , M − 1, where Nd is the number of LORs for one collimator configuration. The unknown radiotracer activity is represented by a lexicographical vector f ∈ ℝNp, where Np is the total number of voxels. The expected measurements are related with unknown f through
| (2) |
where
 ∈ ℝNh×Np is the tomographic system matrix from object space to a high-resolution LOR space of dimension Nh,
 ∈ ℝNd×Nh is the collimator projection matrix from high-resolution LOR space to low-resolution LOR space modeling collimator photon penetration and LOR-mixing effects for configuration m, and rm ℝNd is the mean background counts such as random and scattered events.
The Poisson log-likelihood function for the independent measurements is
| (3) |
After maximizing (3) using the expectation-maximization algorithm (Dempster et al. 1977), the iterative reconstruction can be given by
| (4) |
where 1 ∈ ℝNd is a vector with all elements equal to 1. Hadamard component notation is used in (4) for convenience (Barrett et al. 1994). In general, reconstruction using (4) requires the system matrix of the collimator Cm, m = 0, 1, … , M − 1, which makes the reconstruction more computationally intensive. In this paper, we use the LORI method to compute the high-resolution sinogram y =
f first, and then perform the reconstruction from sinogram y to reconstruct image f using conventional MLEM or OSEM (Shepp and Vardi 1982, Hudson and Larkin 1994).
3. The LORI reconstruction algorithm
3.1. High-resolution LOR restoration
PET data are often binned into sinograms based on LOR parameters before performing the image reconstruction. Conventionally, evenly-spaced sinograms with uniform ray spacing are generated. The evenly-spaced sinograms are more suitable for analytic reconstruction and can be applied to iterative reconstruction as well; however, an arc correction based on interpolation is needed for a ring detector in PET which tends to cause information loss (Defrise and Kinahan 1998, Defrise et al. 2005). As an alternative, PET data can be sorted into LOR sinograms with nonuniform ray spacing (Kadrmas 2004). The LOR sinogram has a natural connection with the list-mode data set where the data are stored in an event-by-event list of the raw LOR attributes (Barrett et al. 1997). The LOR attributes comprise the ring crystal indices (da, db), axial crystal indices (za, zb) and additional information such as time and energy of each detected event. The detailed calculation of LOR sinogram parameters (R, Φ) from the ring crystal indices (da, db) is shown in Appendix A.
For each crystal pair with its formed LOR inside the sampling FOV, 4 combinations of collimated LORs are measured with 4 collimator configurations, as shown in figure 2. These 4 combinations can be measured by rotating the collimator 8 times in succession about its center in 45° steps. 4 types of sinograms can be sorted from the 8 collimated sinograms with a redundancy factor of 2. The 4 types of sinograms are determined by the collimator configurations of each crystal pair (da, db) , da < db. For the j-th LOR (determined by crystal pair (
) with
), the 4 types of LORs are corresponding to collimator configurations 00, 01, 10 and 11 for crystals da and db. We denote the 4 measurements as
, where T denotes the vector or matrix transpose. If the collimator is ideal (has infinite attenuation coefficient), the crystal pair measures 4 high-resolution LORs
with sub-crystal indices of 00, 01, 10 and 11. Due to the penetration of a real collimator, each measurement is actually a mixture of 4 high-resolution LORs. The mixing between the high-resolution LORs and the measurements is denoted by a 4 × 4 transfer matrix
 with the ζη-th element
representing the contribution coefficient of high-resolution LOR
to the measurement
. The restoration of the high-resolution LORs from the collimator-encoded LORs can be treated as a deterministic inverse problem with nonnegative constraints. Specifically, the high-resolution LORs can be restored by solving
with the ζη-th element
representing the contribution coefficient of high-resolution LOR
to the measurement
. The restoration of the high-resolution LORs from the collimator-encoded LORs can be treated as a deterministic inverse problem with nonnegative constraints. Specifically, the high-resolution LORs can be restored by solving
Figure 2.

For crystal pair j, 4 collimator-encoded LORs mj are measured with 4 collimator configurations, and each measurement is a mixture of 4 high-resolution LORs ℓj. High-resolution LORs are restored using the LOR-restoration method.
| (5) |
where the symbol ⪰ denotes vector inequality or component-wise inequality, and ℓj ⪰ 0 means
, η = 0, 1, 2, 3.
 (mj,
ℓj) is a distance measure between mj and
ℓj. When the distance is the Euclidean distance ||mj −
ℓj||, one can use the nonnegative least-squares (NNLS) algorithm to perform the minimization of (5) for each crystal pair (Lawson and Hanson 1974). When the distance is the Kullback-Leibler (KL) divergence, one can use the EM algorithm to restore the high-resolution sinograms (Dempster et al. 1977, Snyder 1992). The minimization of (5) is a very small optimization problem and is very easy to solve; however, tens of millions of such small problems need to be solved to restore all sinograms.
(mj,
ℓj) is a distance measure between mj and
ℓj. When the distance is the Euclidean distance ||mj −
ℓj||, one can use the nonnegative least-squares (NNLS) algorithm to perform the minimization of (5) for each crystal pair (Lawson and Hanson 1974). When the distance is the Kullback-Leibler (KL) divergence, one can use the EM algorithm to restore the high-resolution sinograms (Dempster et al. 1977, Snyder 1992). The minimization of (5) is a very small optimization problem and is very easy to solve; however, tens of millions of such small problems need to be solved to restore all sinograms.
The task of collimator optimization is to make the collimator transfer matrix
have a small condition number for each LOR inside the eFOV, which makes LOR-restoration a well-conditioned problem. An ideal collimator yields an identity collimator transfer matrix, which makes LOR-restoration trivial. For the LORs within the eFOV, the transfer matrix is close to an identity matrix and has a small condition number. In such case, the high-resolution LOR-restoration problem is well-posed, and the NNLS algorithm can always give a stable solution. The implementation of the NNLS algorithm in MATLAB (MathWorks, Natick, MA) is the function lsqnonneg. For the LORs outside the eFOV, the transfer matrix has a relatively large condition number. The restoration problem becomes mildly ill-posed, and the NNLS algorithm may not give a reasonable solution. In such case, the EM algorithm was used to restore the high-resolution LORs outside the eFOV.
One possible practical inconvenience of the restoration method is that the transfer matrix
needs to be generated for each crystal pair. We developed a 3-D ray-tracing model for the collimator. The ζη-th element of the collimator transfer matrix for j-th LOR can be calculated as
| (6) |
Here the angle brackets denote statistical averaging over multiple random realizations of high-resolution LOR with collimator configuration ζ. and are the intersection lengths that each end of a sub-ray (in ) travels through the collimator before reaching the respective detector crystal. We use multiple randomized LOR samples in the ray-tracing of each sub-crystal pair to calculate each element of the transfer matrix. The two endpoints of each LOR sample are distributed in 3-D inside the two sub-crystals. The LOR endpoint is distributed uniformly along the tangential and axial directions. Due to crystal penetration, the endpoint along the radial direction is modeled by a truncated exponential distribution
| (7) |
where μxtal is the crystal linear attenuation coefficient for the gamma rays, L is crystal thickness, and Π (·) is a rectangular function which is 1 for its argument within (−1/2, 1/2) and 0 otherwise (Li et al. 2009). Following (6) in (Metzler et al. 2005), the average depth of interaction can be given by
| (8) |
The random depth x can be generated from a uniform random variable u in (0, 1) by taking the inverse of the cumulative distribution function of (7) (Papoulis and Pillai 2002). Specifically, the random depth x can be written as
| (9) |
The calculation of the collimator transfer matrix
for each crystal pair can be very computationally intensive; however, the computation can be greatly reduced by considering the collimator’s geometric symmetry. The collimator transfer matrix for each ring combination are calculated using (6) and stored in the LOR sinogram format. The LORs are categorized into direct LORs and oblique LORs for ring combinations za = zb and za ≠ zb, respectively. Since the collimator is independent of z, by considering the axial symmetry of the collimator, the transfer matrix for oblique LORs can be calculated from the corresponding direct LORs (projection of the oblique LORs in the transaxial plane) with small crystal approximation. The intersection length for an oblique LOR can be derived by dividing the length of the corresponding direct LOR by the cosine of the angle between the LOR and the transaxial plane. For LORs within one ring combination, collimator rotational symmetry can be applied. The matrix
for LOR j is independent of angle Φ except the boundaries of the 8 segments. The rotational symmetry means that the transfer matrices for LORs j1 and j2 with the same ray index R (i.e., the same crystal index differences), except the boundaries, are identical.
3.2. LOR-interleaving
After the LOR-restoration, 4 types of sinograms comprising high-resolution LORs are restored. One can perform the iterative image reconstruction from the 4 sinograms. Here we use LOR-interleaving to obtain a super-sampled sinogram which can be fed to an existing image reconstruction program. The basic idea of LOR-interleaving is to upsample the 4 sinograms by a factor of 4 (2 in each of two dimensions), and then sum them together after properly shifting (Crochiere and Rabiner 1981). A block diagram of LOR-interleaving is shown in figure 3. The LOR-interleaving in sinogram space is by no means straightforward, but it is straightforward in crystal space. Thanks to the relations between LOR sinogram and list-mode format in Appendix A, we can convert the LOR sinogram parameters (R, Φ) to the crystal pair index (da, db). Since each crystal can be split into 2 sub-crystals with collimation, a modified PET geometry with twice as many crystals can be adopted for the collimated PET. We can re-encode the crystal index based on the modified geometry. A new crystal pair index can be determined by
Figure 3.

The diagram of LOR-interleaving to achieve super-sampled sinogram. The upsampling ↑ 2, 2 and shifts Z0,0, … , Z1,1 of the LORs here are analogous to multirate digital signal processing.
| (10) |
The function coll_sampling determines the collimator sampling of each crystal; it returns 0 when the corresponding septum exposes the first half of the crystal and 1 when exposing the second half. The super-sampled sinogram parameter (Rcoll, ΦcollJ can then be calculated from the newly generated crystal pair index using the method in Appendix A. Since each restored LOR can be mapped to a new LOR in the modified geometry, we can generate a super-sampled sinogram from the 4 restored sinograms by superimposing each LOR into the modified geometry. The super-sampled sinogram comprising the restored LORs can then be fed to an existing iterative reconstruction algorithm to reconstruct super-resolution images.
3.3. LORI algorithm
The data from collimated PET can be 8 sets of list-mode data or 8 sinograms acquired with 8 different collimator configurations/rotations. We developed the dedicated LORI algorithm for the collimated PET. The LORI algorithm needs 4 steps to reconstruct super-resolution images, namely (i) the 8 sinograms are sorted into 4 types of sinograms based on collimator configuration for each crystal pair to eliminate redundancy, (ii) the 4 types of high-resolution sinograms are restored using the LOR-restoration method, (iii) the super-sampled sinograms are generated using the LOR-interleaving method, (iv) the super-sampled sinograms are fed to an existing reconstruction software to reconstruct super-resolution images.
4. Simulation studies
4.1. Simulation setup
We developed a 3-D ray-tracing model including collimator penetration and crystal depth of interaction and conducted Monte Carlo simulations for a collimator designed for A-PET. Object attenuation, random and scattered events were not simulated. The simulated collimator geometry is matched with A-PET in the transverse dimension (278 2 × 2 × 10 mm3 crystals in a ring) (Surti et al. 2003, Surti et al. 2005). 8 rings instead of 52 (A-PET) were simulated to speed up our simulation since the collimator has a translational symmetry axially. For each crystal pair, 8000 randomized samples with two endpoints distributed in 3-D were simulated in generating the sinograms and the transfer matrices. The linear attenuation coefficients for the tungsten septa and the LYSO crystal were 2.4 cm−1 and 0.86 cm−1, respectively. We generated 8 LOR sinograms corresponding to the 8 successive collimator rotations using the 3-D ray-tracing model. The sinogram was binned into 125 rays × 139 angles × 64 ring combinations.
An analytic hot-rod phantom with uniform background of 25 mm diameter was used. The hot-rod phantom has 5 sectors of hot rods with diameters of 0.6, 0.8, 1.2, 1.6 and 2.0 mm, and the contrast ratio of the hot rods to the background is 5:1. The axial length of the background and the hot rods are 16 mm and 12 mm, respectively. To evaluate the PET collimator performance in a realistic imaging situation, a MOBY voxelized mouse phantom digitized with pixel size of 0.125 mm was also simulated (Segars et al. 2004). Only one time frame (without heart beat and breathing) was used for generating the phantom. The mouse phantom was properly translated to fit the heart chamber into the collimator’s eFOV. The transverse sections of the hot-rod phantom and MOBY phantom are shown in figure 8(a) and figure 12(a), respectively.
Figure 8.

Comparison of the reconstructed images of the hot-rod phantom for (b) the uncollimated case, (c) the collimated case without LOR restoration and (d) the collimated case with LOR restoration. The phantom is also shown in (a) for comparison. The two line segments in (a) are going through the centers of the hot spots with diameters 1.2 mm and 0.6 mm, respectively. Along them the profiles in figure 9 are created. The rounded triangle drawn in (a) indicates the background ROI where the background variability was calculated.
Figure 12.

Comparison of the reconstructions at approximated matched background variability inside the heart region of the MOBY phantom (a). (b) The uncollimated reconstruction with 1 mm grid step using 3-D blob OSEM. (c) The collimated reconstruction with 0.5 mm grid step using the LORI method. The central horizontal profiles through (b) and (c) are shown in (d).
4.2. Simulated collimator sampling
Since the 278 crystals can not be evenly divided into 8 segments, we divided the PET collimator into 8 segments which are mapped to 8 regions of crystals: 0–34, 35–69, 70–104, 105–138, 139–173, 174–208, 209–243, 244–277. The collimator is configured as [0, 0, 0, 1, 1, 0, 1, 1] for the 8 segments as described in Section 2.1. The collimator is rotated 8 successive times based on the 8 segments; specifically, the collimator is rotated 0, 35, 70, 105, 139, 174, 209 and 244 crystals for the 8 acquisitions. Each crystal pair with collimation can measure 4 types of collimator-encoded LORs described in figure 2, and the collimator sampling patterns for the 4 types of LORs are shown in figure 4. The sampling pattern provides the number of times measured for each collimator-encoded LOR with the 8 rotations. The majority of LORs within the sampling FOV are measured twice (redundancy factor 2), which indicates that complete LOR sub-sampling is achieved within the sampling FOV.
Figure 4.

Four collimator sampling patterns in the LOR sinogram format (125 rays × 139 angles) indicate how many times the 4 types of collimator-encoded LORs are measured with the 8 rotations. The collimator configurations for the 4 types of LORs are respectively 00, 01, 10 and 11, as shown in figure 2. The majority of LORs within the sampling FOV are measured twice. The darker and brighter lines represent the LORs that measured by the boundary crystals. Due to the unevenly divided collimator, the darker and brighter lines are measured once and three times, respectively.
4.3. Simulated LOR sinograms and restored sinograms
Figure 5 shows 8 typical collimated sinograms acquired from the 8 successive acquisitions with the hot-rod phantom. Only the central radial rays from 49 to 77 are shown by cropping zeros. Collimator sampling patterns of the 8 rotations are encoded in these 8 acquisitions. By decoding the collimator sampling, we sorted the 8 collimated sinograms into 4 types of measured sinograms corresponding to the 4 types of LORs shown in figure 2. For an ideal collimator without penetration, the 4 types of collimator-encoded sinograms are just the high-resolution LORs without crosstalk. We can obtain a super-sampled sinogram from these 4 high-resolution sinograms using the LOR-interleaving method.
Figure 5.
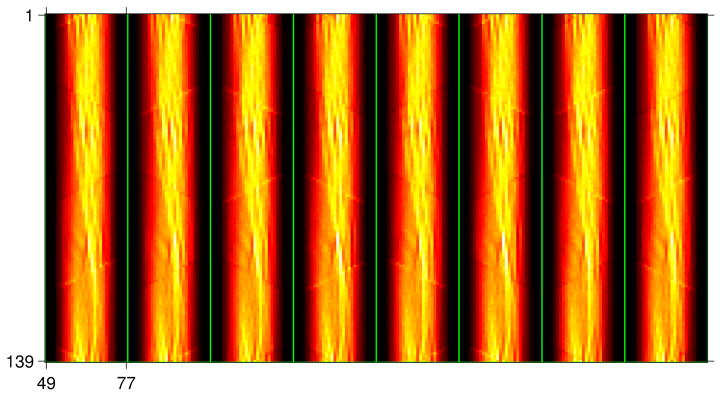
Typical collimator-encoded sinograms acquired from the 8 successive collimator rotations.
Figure 6(a) and 6(b) show typical measured sinograms and the corresponding super-sampled sinogram after collimator-attenuation correction, respectively. Because of collimator penetration, each crystal pair actually measures a mixture of 4 high-resolution LORs. To obtain attenuation-artifact-free images, high-resolution sinograms were restored from these 4 measured sinograms using the LOR-restoration method. Figure 6(c) and 6(d) show the 4 restored sinograms from the 4 measured sinograms and the corresponding super-sampled sinogram, respectively.
Figure 6.

Typical (a) measured and (c) restored sinograms corresponding to the 4 types of LORs and the interleaved sinograms after LOR-interleaving. The interleaved sinograms in (b) and (d) are respectively super-sampled from the measured and restored sinograms in (a) and (c).
Figure 7 shows a typical slice of the transfer matrix from 4 types of collimator-encoded LORs to 4 high-resolution LORs. The transfer matrix is shown in the 4 × 4 LOR sinograms (125 rays × 139 angles) which correspond to the 4 × 4 elements of the transfer matrix for all crystal pairs within a ring combination. We applied the 8-fold collimator rotational symmetry in generating the transfer matrix for variance reduction. The brighter and darker lines in the transfer matrix are the responses of boundary crystals.
Figure 7.

A typical slice of the transfer matrix from 4 collimator-encoded LORs to 4 high-resolution LORs crystal pairs within a ring combination.
4.4. Image reconstruction
4.4.1. LORI reconstruction
We have performed image reconstructions for A-PET with collimation using the LORI algorithm and the 3-D blob-based OSEM algorithm. The Kaiser-Bessel basis function with shape parameter 8.63 and the body-centered cubic (BCC) grid were used in the reconstructions (Matej and Lewitt 1995). The grid step sizes and blob radius are respectively 1.0 mm and 1.5 mm for the uncollimated case, 0.5 mm and 0.75 mm for the collimated case. A total of 160M expected events for the 8 acquisitions with different collimator rotations were generated for the collimated case. 640M expected events were generated for the uncollimated case since the collimator has reduced sensitivity by a factor of about 4. For the collimated case, we performed reconstructions both with and without LOR restoration. We ran up to 100 iterations with 8 subsets to ensure that convergence can be achieved for all three types of reconstructions: i) the uncollimated case ii) the collimated case without LOR restoration, and iii) the collimated case with LOR restoration. The reconstructed blob images are then converted into voxel images with non-cubic sizes of 0.25 × 0.25 × 1.0 mm3 for display.
4.4.2. Matrix-based reconstruction
As an alternative, images can be reconstructed directly from the list-mode data or sinograms using the matrix-based method (4), which can be very computationally intensive. We also implemented the matrix-based reconstruction for comparison with the LORI reconstruction. The whole system is modeled by a tomographic projection matrix
and 8 collimator projection matrices
, m = 0, 1, … , 7. The tomographic and collimator projection matrices are determined by ray-tracing of the PET collimator with 8000 3-D random distributed samples per LOR. The intersections between each sample and the voxels are calculated based on Siddon’s method (Siddon 1985). Since the matrix-based method is very computationally intensive, we reconstructed only one image slice from a central sinogram (ring combination) with 0.25 mm pixel size.
5. Reconstruction results
5.1. Reconstructions with hot-rod phantom
Figure 8 shows a comparison of the three types of reconstructions at a central axial slice for visual inspection. The uncollimated case has 4 times as many counts as the collimated case. The images in figure 8(b)–(d) have approximately matched background variability with respectively iteration numbers 9, 20 and 8. We selected the rounded triangular region drawn in figure 8(a) as the background region of interest (ROI). The three reconstructions were normalized based on the mean value in a background region. The background variability, as an index of background noise, was calculated from the standard deviation in the background ROI normalized by the background mean. The collimator in the simulation has an efficient FOV of about 15 mm (the background region is 25 mm). To obtain optimal reconstructed images, we used grid step sizes of 1 mm and 0.5 mm for the uncollimated and collimated reconstructions, respectively.
The horizontal profiles are shown in figure 9 for a quantitative comparison. If we consider profile peak to valley ratio as an index for spatial resolution, we can see the collimated reconstruction with LOR restoration has substantially improved spatial resolution. From figure 8 and 9, we can qualitatively conclude that collimation with LOR restoration can provide better image quality even with reduced counts.
Figure 9.

The profiles along the two line segments shown in figure 8(a) for the uncollimated reconstruction, collimated reconstruction without LOR restoration and collimated reconstruction with LOR restoration. The profile peaks are going through the centers of the 1.2 mm and 0.6 mm hot rods. The profile peaks on the right for the uncollimated case are artifactual, not occurring at the same locations as the peaks for the phantom.
The reduced total counts with collimator can increase the noise in the reconstructed images. To compare the noise performance of the three types of reconstructions, the background variability versus the iteration number is shown in figure 10. We can see from the figure that the three types of reconstructions have different noise propagation properties and different convergence speeds. In general, the uncollimated case has the best noise performance since it has quadruple counts of the collimated case. The collimated cases with and without LOR restoration have worse noise performance due to the reduced counts. LOR-restoration can further increase noise which depends on the eigenvalues of the transfer matrix as shown in Appendix B.
Figure 10.

Calculated background variability versus iteration number for the three types of reconstructions: the uncollimated reconstruction with 1 mm grid step, the collimated reconstructions with and without LOR restoration with 0.5 mm grid step.
For a more quantitative comparison, we used contrast recovery coefficient (CRC) versus background variability as image quality metric to compare the three types of reconstructions. The CRC is defined as
| (11) |
where Chot and Cbkgd are the average activities measured in the reconstructed images in the signal ROI and background ROI, and ahot/abkgd is the ratio of the true activities in the signal and background ROIs (Daube-Witherspoon et al. 2002). We calculated the local CRCs for the hot rods in the 5 sectors. We selected the hot rods in each sector within the eFOV of 15 mm diameter as the local signal ROIs, and the annuli regions surrounding the hot rods as local background ROIs. The calculated CRCs versus background variability for the three types of reconstructions are shown in figure 11. The CRCs in figure 11(a)–(d) were calculated from the 4 sectors of hot rods with diameters of 0.6, 0.8, 1.2 and 1.6 mm, respectively. From figure 11 we can see that the collimated case with LOR restoration has the best performance even with reduced counts by comparing the CRCs with fixed background variability. The CRC increases with the increase of the hot spot size. The performance in the collimated case without LOR restoration is also better than that in the uncollimated case but with increased noise near the periphery of the phantom. When we applied LOR restoration in the collimated case, not only were the non-ideal collimator effects corrected, but the spatial resolution and quantification of the reconstructed images were substantially improved.
Figure 11.

Calculated local CRCs versus background variability for the 3 types of reconstructions of the 4 different sizes of hot rods. Each marker represents 1 iteration.
5.2. Reconstructions with MOBY phantom
To evaluate the PET collimator performance in a realistic imaging situation, a MOBY voxelized mouse phantom was simulated (Segars et al. 2004). The phantom was digitized with pixel size of 0.125 mm as shown in figure 12(a). Poisson noise was added to the projection data with expected total counts of 10M and 40M for the collimated and uncollimated reconstructions, respectively. We used the LORI and 3-D blob OSEM for the reconstructions. We again ran up to 100 iteration with 8 subsets for both collimated and uncollimated cases, and the reconstructed voxel size was the same as for the hot-rod phantom (0.25 mm); To match noise level, we performed separate reconstructions with a uniform-heart phantom modified from the MOBY phantom. The uniform-heart phantom was generated by replacing the activity values inside the heart chamber of MOBY phantom with a constant activity value equal to the average activities of the heart chamber. The noise properties of the reconstructions from the two phantoms are expected to be similar, so we can approximately match noise/variability inside the heart region for visual comparison of the collimated and uncollimated reconstructions.
Figure 12 shows the reconstructions of a transverse slice of the MOBY phantom for qualitative visual comparison. The reconstructed images in figure 12(b) and 12(c) have approximately matched noise inside the heart region with respectively iteration numbers 74 and 5. The horizontal profiles through the heart center for the uncollimated and collimated reconstructions are shown in figure 12(d) for a quantitative comparison. From figure 12, we can see that the collimated reconstruction has improved spatial-resolution in a realistic imaging situation even with reduced total counts.
5.3. Comparison with the matrix-based reconstruction
To further compare the proposed LORI method with the matrix-based method, we also performed image reconstruction directly from the collimated projections using the method in (4). The tomographic projection using a strip-integral model and collimation effects are fully modeled by the matrices. Since the matrix-based method is very computationally intensive, we reconstructed one image slice from 8 collimated sinograms with expected 20M total counts. In this comparison, we used the voxel basis for both the matrix-based and LORI reconstructions with 0.25 mm pixel size. We ran up to 800 iterations and saved the reconstructed images every 8 iterations.
Figure 13 shows the comparison of the 2-D reconstructions of the hot-rod phantom. The reconstructed images have approximately matched background variability by selecting different number of iterations. The iteration numbers were 192 and 48 for the reconstructions using the matrix-based method and the LORI method in figure 13(a) and 13(b), respectively. We see from figure 13 the matrix-based method has visually comparable performance as the LORI method, but with a different noise structure. Figure 14 shows CRCs versus background variability for the 0.8 mm and 1.6 mm hot rods for a quantitative comparison. We can see from figure 14 that the CRC versus background variability performance of the LORI method is similar to that of the matrix-based method for the two types of hot rods. The LORI method tends to produce better CRC for the small rods while the matrix-based method is more robust against noise than the LORI method. High-resolution LORs can be effectively and efficiently restored after LOR restoration, which makes the LORI method converge much faster and more effective than the matrix-based method. The LORI method is a good alternative to the matrix-based method because 1) it has similar performance, 2) it is very efficient, 3) it can take advantage of existing reconstruction packages and 4) it provides good insight into collimated PET.
Figure 13.
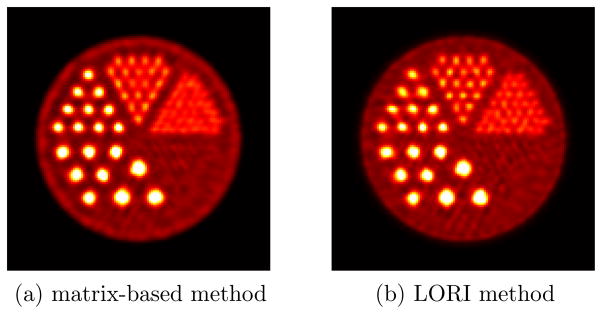
Comparison of the 2-D reconstructions of the hot-rod phantom using (a) the matrix-based method in (4) and (b) the LORI method.
Figure 14.

Comparison of CRCs versus background variability for the 2-D reconstructions of the 0.8 mm and 1.6 mm hot rods.
6. Discussion
We have developed a method to reconstruct images from collimated PET using the LORI and OSEM in sequence. The method was developed specifically for our collimated PET, and it can also be useful for other tomographic applications where LOR manipulations are needed. The LORI reconstruction, similar to the Fourier rebinning reconstruction (Defrise et al. 1997), preprocesses the raw data/sinogram and requires an MLEM or OSEM algorithm for joint image reconstruction. Random and scatter correction can be done either in the collimator-encoded LORs before LOR restoration, or in the joint iterative reconstruction of the high-resolution LORs. We used a 4 × 4 transfer matrix to model the mixing between the collimated LORs and the high-resolution LORs for each crystal pair. Object attenuation, positron range, acollinearity and DOI blurring effects are not modeled in the transfer matrix. Future incorporation of these effects could be implemented using the matrix-factorization-based method, e.g., (Zhou and Qi 2011b). The LOR-restoration is treated as an essentially deterministic inverse problem. The method is proved to be an efficient method to restore high-resolution LORs, and it can provide good insights into the collimated PET.
Nevertheless, noise may be a concern in the collimated PET reconstructions. We compared CRC versus background variability of reconstructed images from collimated and uncollimated data. The LOR-restoration itself can increase noise in the restored LOR sinograms. We also performed noise analysis for the LOR-restoration process in Appendix B and found that the noise gain is directly related with the spectrum of the kernel determined by a column of the collimator transfer matrix. The restored LOR sinograms are not exactly distributed as independent Poisson variables; however, their statistical properties (covariance matrix) can be calculated using (B.8) in Appendix B. Since the diagonally dominant transfer matrix has a small condition number, the LOR-restoration only marginally increases the noise. The LOR-restoration can modify the noise correlation, and it may not work well in the extremely low-count scenario. In such case, the matrix-based method with full statistics consideration is more robust against noise. The collimated reconstructions outside the eFOV have some degraded image quality due to the reduced counts. We can see the image in figure 8(c) has increased noise near the periphery after collimator attenuation correction. We can also see that the image in figure 8(d) have some structured-background artifacts. The artifacts are caused by insufficient LOR sampling. It should be stressed that there is a trade-off between spatial resolution and sampling artifacts—increasing grid step size reduces sampling artifacts caused by insufficient LOR sampling relatively to the grid step; however, it also reduces the spatial resolution improvement of the collimated reconstructions. The background artifact may be related to the rich-frequency contents of the hot-rod phantom and the high counts in the simulations to demonstrate the performance of the algorithm. The artifacts became less noticeable at high iterations in the reconstructions of the hot-rod phantom, and the artifacts were gone (or invisible) in the reconstructions of the MOBY phantom at low count level used for clinical or preclinical imaging.
Resolution modeling in tomographic reconstruction can also boost spatial resolution of the reconstruction images. The rationale of the resolution modeling is that some “hidden” information in the blurred images can be recovered by modeling the blurring process in a blurring system matrix. Frequency components of the resolution kernel of a PET detector beyond the cutoff where the spectrum of the kernel falls below the noise level can not be recovered by any method. The resolution improvement of resolution modeling is limited by the frequency response of the resolution kernel of the detector. The resolution modeling method needs to solve a highly ill-posed inverse problem to boost frequency response (or spatial resolution), which leads to Gibbs edge artifacts where a 18 % overshoot resides near the edge of the reconstructed images (Snyder et al. 1987, Alessio et al. 2006, Tong et al. 2011). Recent literature shows that the edge artifacts can have negative impacts on clinical quantitation (Blinder et al. 2012).
Our collimated PET method uses a specially designed collimator to physically mask detector crystals. The high-resolution LOR information is modulated with the collimator attenuation profile and acquired in the form of collimator-encoded LORs. Without collimation, there is no information on where within a single crystal a given annihilation gamma enters, and the spatial resolution is essentially determined by the crystal width. With collimation, annihilation gammas enter a given crystal less likely through the masked part than the unmasked part, and the gammas can be determined within a fractional width of the crystal. Instead of collecting large amount of events, collimated PET collects high-quality events with reduced counts, which is critical for improving the spatial resolution. Collimation itself provides better LOR spatial resolution, but does not increase linear or angular sampling without rotation. Rotating the collimator allows the full sets of LORs to be measured to satisfy the complete LOR sub-sampling. Precise fabrication and careful calibration with motorized rotation control of the collimator are required to give accurate positioning. The high-resolution images with improved spatial resolution can be efficiently and effectively reconstructed using the LORI method from the multiple collimated acquisitions. The computational cost using the LORI method can be significantly reduced without compromising image quality; furthermore, it provides good insights into collimated PET. Finally, the collimated PET method can mitigate the technical difficulties of manufacturing extremely small crystals with extremely high cost (Yang et al. 2011), and it may open a new dimension to improve spatial resolution in small-animal and human PET imaging applications.
7. Conclusion
Using fractional-crystal collimation in PET can modify LOR detection and provide information-enriched LORs. Complete LOR-sampling can be achieved by rotating the collimator. Using collimation can improve the spatial resolution of a PET system beyond the limits of crystal sizes and intrinsic detector resolution. The limitations of the collimator are the reduced sensitivity and the small FOV. To fully utilize the spatial information of the collimator-encoded LORs and incorporate collimator modeling, we have developed the LORI algorithm, which can effectively and efficiently reconstruct high-resolution images from collimated PET. We have implemented the algorithm for a collimator designed for A-PET and performed reconstructions of simulated data based on 3-D ray-tracing. We demonstrated that the LORI algorithm can provide similar quality compared to the matrix-based method, and it can obtain reconstructions with substantially improved spatial resolution and quantification compared to uncollimated PET. The quality improvement in the reconstructed images is due to the improved spatial resolution of the restored LORs, in addition to increased linear and angular sampling.
Acknowledgments
We would like to thank Mr. Matthew Werner of University of Pennsylvania and Dr. Gene Gualtieri of Drexel University for providing software and computing assistance. We would also like to thank the anonymous reviewers for their valuable comments and suggestions to improve the paper. This work was supported by the National Institute of Biomedical Imaging and Bioengineering of the National Institutes of Health under Grants Nos R21 EB-12158 and R21 EB-17416.
Appendix A. Calculation of (R, Φ) From (da, db)
The ring crystal indices da and db range from 0 to nXtal − 1 (nXtal = 278 for A-PET) as shown in figure A1. The average and difference indices of the two crystals are
| (A.1) |
We choose the LOR at crystals and nXtal − 1 as a reference LOR for even nXtal. This reference LOR goes through the center of the scanner and is therefore at R = RFOV (RFOV is the half of the maximum ray index, RFOV = 62 for A-PET). The average index of the reference LOR is and is defined at Φ = 0. So the angle Φ for LOR (da, db) is given by
| (A.2) |
where the floor operator, ⌊·⌋, gives the greatest integer less than or equal to its argument. The ray index R for LOR (da, db) can be given by
| (A.3) |
The ray indices of the LORs with the same angle index are adjusted to be old and even depending on whether or not the centermost crystals are exactly centered (i.e. the argument of ⌊·⌋ in (A.2) is an integer instead of a half integer). The list mode data format (da, db) can also be calculated for LOR sinogram format (R, Φ) without information loss.
Figure A1.

Calculation of (R, Φ) for list-mode data (da, db)
Appendix B. Structured Collimator Transfer Matrix and Noise Analysis
Due to the symmetry in the 4 measurements with 4 collimator configurations, the collimator transfer matrix
can be approximately modeled as a block circulant with circulant blocks (BCCB) matrix
| (B.1) |
where the value aj represents the attenuation coefficient for the high-resolution LOR with both ends unmasked by the collimator (it is very close to 1) as shown in figure 2, bj and cj are for the LORs with one end masked and the other end unmasked, and dj are for the LOR with both ends blocked. In general, we have 1 ≥ aj ≫ bj ≈ cj ≫ dj > 0, dj ≈ bjcj and
is a diagonally dominant matrix. The BCCB structure of the transfer matrix allows us to rewrite (B.1) into a 2-D circulant convolution form with a convolution kernel determined by one column of
| (B.2) |
According the convolution theorem, we can use the 2-D discrete Fourier transform (DFT) matrix
 to diagonalize the transfer matrix
(Hansen et al. 2006). The spectrum decomposition of
can be given by
to diagonalize the transfer matrix
(Hansen et al. 2006). The spectrum decomposition of
can be given by
| (B.3) |
The spectrum κ̂ can be obtained by taking the 2-D Fourier transform of the first column of
(or other column with proper phase shift)
| (B.4) |
where ei is the i-th 4 × 1 unit vector. The 2-D DFT matrix
can be written as a Kronecker product of two 1-D DFT matrices
| (B.5) |
The inverse of the DFT matrix can be obtained from its conjugate transpose, i.e.,
 =
=
 /4. So the inverse of collimator transfer matrix can be easily given by
| (B.6) |
From (B.3) and (B.5), we can easily compute the condition number of matrix
by
| (B.7) |
Since high-resolution LORs ℓj is determined essentially by the linear transformation of the measurements mj using the inverse transfer matrix
 , we can determine the covariance matrix of ℓj from that of mj (Li 2011). The covariance matrix of ℓj can be given by
| (B.8) |
where κ̂* is the complex conjugate of κ̂. The measurements mj have statistically independent Poisson noise, which means the covariance matrix is a diagonal matrix. For the uniform measurements, we can derive the ratio of the standard deviations of ℓj and mj as
| (B.9) |
which can serve as an index for the noise performance of the LOR-restoration.
References
- Alessio AM, Kinahan PE, Lewellen TK. Modeling and incorporation of system response functions in 3-D whole body PET. IEEE Trans Med Imag. 2006;25(7):828–837. doi: 10.1109/tmi.2006.873222. [DOI] [PubMed] [Google Scholar]
- Barrett HH, Furenlid LR, Freed M, Hesterman JY, Kupinski MA, Clarkson E, Whitaker MK. Adaptive SPECT. IEEE Trans Med Imag. 2008;27(6):775–788. doi: 10.1109/TMI.2007.913241. [DOI] [PMC free article] [PubMed] [Google Scholar]
- Barrett HH, White T, Parra LC. List-mode likelihood. J Opt Soc Am A. 1997;14(11):2914–2923. doi: 10.1364/josaa.14.002914. [DOI] [PMC free article] [PubMed] [Google Scholar]
- Barrett HH, Wilson DW, Tsui BMW. Noise properties of the EM algorithm: I. Theory. Phys Med Biol. 1994;39(5):833–846. doi: 10.1088/0031-9155/39/5/004. [DOI] [PubMed] [Google Scholar]
- Blinder SAL, Dinelle K, Sossi V. Scanning rats on the high resolution research tomograph (HRRT): A comparison study with a dedicated micro-PET. Med Phys. 2012;39(8):5073–5083. doi: 10.1118/1.4736802. [DOI] [PubMed] [Google Scholar]
- Chang G, Pan T, Clark JW, Jr, Mawlawi OR. Optimization of super-resolution processing using incomplete image sets in PET imaging. Med Phys. 2008;35(12):5748–5757. doi: 10.1118/1.3021117. [DOI] [PubMed] [Google Scholar]
- Cherry S, Shao Y, Silverman R, et al. MicroPET: A high resolution PET scanner for imaging small animals. IEEE Trans Nucl Sci. 1997;44(3 Part 2):1161–1166. [Google Scholar]
- Cho ZH, Hong KS, Ra JB, Lee SY. A new sampling scheme for the ring positron camera: Dichotomic ring sampling. IEEE Trans Nucl Sci. 1981;28(1):94–98. [Google Scholar]
- Crochiere RE, Rabiner LR. Interpolation and decimation of digital signals – a tutorial review. Proc IEEE. 1981;69(3):300–331. [Google Scholar]
- Dagher A, Thompson CJ. Real-time data rebinning in PET to obtain uniformly sampled projections. IEEE Trans Nucl Sci. 1985;32(1):811–817. [Google Scholar]
- Daube-Witherspoon ME, Karp JS, Casey ME, et al. PET performance measurements using the NEMA NU 2-2001 standard. J Nucl Med. 2002;43(10):1398–1409. [PubMed] [Google Scholar]
- Defrise M, Kinahan PE. Data acquisition and image reconstruction for 3D PET. In: Bendriem B, Townsend DW, editors. The Theory and Practice of 3D PET. Kluwer Academic; Dordrecht: 1998. pp. 11–54. [Google Scholar]
- Defrise M, Kinahan PE, Michel CJ. Image reconstruction algorithms. In: Bailey DL, et al., editors. PET Positron Emission Tomography: Basic Sciences. Springer; London: 2005. pp. 63–92. [Google Scholar]
- Defrise M, Kinahan PE, Townsend DW, Michel C, Sibomana M, Newport DF. Exact and approximate rebinning algorithms for 3-D PET data. IEEE Trans Med Imag. 1997;16(2):145–158. doi: 10.1109/42.563660. [DOI] [PubMed] [Google Scholar]
- Dempster AP, Laird NM, Rubin DB. Maximum likelihood from incomplete data via the EM algorithm. J Roy Stat Soc Ser B. 1977;39(1):1–38. [Google Scholar]
- Hansen PC, Nagy JG, O’Leary P. Deblurring Images: Matrices, Spectra, and Filtering. SIAM; Philadelphia, PA: 2006. [Google Scholar]
- Hudson HM, Larkin R. Accelerated image reconstruction using ordered subsets of projection data. IEEE Trans Med Imag. 1994;13(4):601–609. doi: 10.1109/42.363108. [DOI] [PubMed] [Google Scholar]
- Irani M, Peleg S. Motion analysis for image enhancement: resolution, occlusion, and transparency. J Vis Commun Image Rep. 1993;4(4):324–335. [Google Scholar]
- Jaszczak RJ. Increased resolving power from scintillation cameras using electronic signal processing and a movable filter plate. J Nucl Med. 1973;14(1):14–20. [PubMed] [Google Scholar]
- Jeong KY, Choi K, Nam WH, Ra JB. Sinogram-based super-resolution in PET. Phys Med Biol. 2011;56(15):4881–4894. doi: 10.1088/0031-9155/56/15/015. [DOI] [PubMed] [Google Scholar]
- Kadrmas DJ. LOR-OSEM: statistical PET reconstruction from raw line-of-response histograms. Phys Med Biol. 2004;49(20):4731–4744. doi: 10.1088/0031-9155/49/20/005. [DOI] [PMC free article] [PubMed] [Google Scholar]
- Kennedy JA, Israel O, Frenkel A, Bar-Shalom R, Azhari H. Super-resolution in PET imaging. IEEE Trans Med Imag. 2006;25(2):137–147. doi: 10.1109/TMI.2005.861705. [DOI] [PubMed] [Google Scholar]
- Lawson CL, Hanson RJ. Solving Least Squares Problems. Prentice-Hall; Englewood Cliffs, NJ: 1974. [Google Scholar]
- Li Y. Noise propagation for iterative penalized-likelihood image reconstruction based on Fisher information. Phys Med Biol. 2011;56(4):1083–1103. doi: 10.1088/0031-9155/56/4/013. [DOI] [PubMed] [Google Scholar]
- Li Y, Matej S, Karp JS, Metzler SD. System design considerations for collimation in a small-animal PET scanner. IEEE NSS/MIC. 2012:2838–2842. [Google Scholar]
- Li Y, Matej S, Metzler SD. Image reconstructions from super-sampled data sets with resolution modeling in PET imaging. Med Phys. 2014;41:121912. doi: 10.1118/1.4901552. [DOI] [PMC free article] [PubMed] [Google Scholar]
- Li Y, Metzler SD. Resolution enhanced PET using collimation. J Nucl Med. 2012;53:2396. [Google Scholar]
- Li Y, Oldendick J, Ordonez CE, Chang W. The geometric response function for convergent slit-slat collimators. Phys Med Biol. 2009;54(6):1469–1482. doi: 10.1088/0031-9155/54/6/006. [DOI] [PMC free article] [PubMed] [Google Scholar]
- Matej S, Lewitt RM. Efficient 3D grids for image reconstruction using spherically-symmetric volume elements. IEEE Trans Nucl Sci. 1995;42(4):1361–1370. doi: 10.1109/42.481442. [DOI] [PubMed] [Google Scholar]
- Metzler SD, Greer KL, Jaszczak RJ. Determination of mechanical and electronic shifts for pinhole spect using a single point source. IEEE Trans Med Imag. 2005;24(3):361–370. doi: 10.1109/tmi.2004.842456. [DOI] [PubMed] [Google Scholar]
- Metzler SD, Matej S, Karp JS. Resolution enhancement in PET reconstruction using collimation. IEEE Trans Nucl Sci. 2013;60(1):65–75. doi: 10.1109/TNS.2012.2214444. [DOI] [PMC free article] [PubMed] [Google Scholar]
- Miyaoka RS, Kohlmyer SG, Lewellen TK. Performance characteristics of micro crystal element (MiCE) detectors. IEEE Trans Nucl Sci. 2001;48(4 Part 2):1403–1407. [Google Scholar]
- Moses WW, Derenzo SE. Empirical observation of resolution degradation in positron emission tomographs utilizing block detectors. J Nucl Med. 1993;34(5 S):101P. [Google Scholar]
- Papoulis A, Pillai SU. Probability, Random Variables and Stochastic Processes. 4. McGraw-Hill; New York: 2002. [Google Scholar]
- Qi J, Yang Y, Zhou J, Wu Y, Cherry SR. Experimental assessment of resolution improvement of a zoom-in PET. Phys Med Biol. 2011;56(17):N165–N174. doi: 10.1088/0031-9155/56/17/N01. [DOI] [PubMed] [Google Scholar]
- Segars WP, Tsui BMW, Frey EC, Johnson GA, Berr SS. Development of a 4-D digital mouse phantom for molecular imaging research. Mol Imaging Biol. 2004;6(3):149–159. doi: 10.1016/j.mibio.2004.03.002. [DOI] [PubMed] [Google Scholar]
- Shepp LA, Vardi Y. Maximum likelihood reconstruction for emission tomography. IEEE Trans Med Imag. 1982;1(2):113–122. doi: 10.1109/TMI.1982.4307558. [DOI] [PubMed] [Google Scholar]
- Siddon RL. Fast calculation of the exact radiological path for a three-dimensional CT array. Med Phys. 1985;12(2):252–255. doi: 10.1118/1.595715. [DOI] [PubMed] [Google Scholar]
- Snyder DL. Deblurring subject to nonnegativity constraints. IEEE Trans Signal Process. 1992;40(5):1143–1150. [Google Scholar]
- Snyder DL, Miller MI, Thomas LJ, Jr, Politte DG. Noise and edge artifacts in maximum-likelihood reconstructions for emission tomography. IEEE Trans Med Imag. 1987;6(3):228–238. doi: 10.1109/TMI.1987.4307831. [DOI] [PubMed] [Google Scholar]
- Stickel JR, Cherry SR. High-resolution PET detector design: modelling components of intrinsic spatial resolution. Phys Med Biol. 2005;50(2):179–195. doi: 10.1088/0031-9155/50/2/001. [DOI] [PubMed] [Google Scholar]
- Suk JY, Thompson CJ, Labuda A, Goertzen AL. Improvement of the spatial resolution of the MicroPET R4 scanner by wobbling the bed. Med Phys. 2008;35(4):1223–1231. doi: 10.1118/1.2868760. [DOI] [PubMed] [Google Scholar]
- Surti S, Karp JS, Perkins AE, Freifeldera RGM. Design evaluation of A-PET: A high sensitivity animal PET camera. IEEE Trans Nucl Sci. 2003;50(5):1357–1363. [Google Scholar]
- Surti S, Karp JS, Perkinsand AE, Cardi CA, Daube-Witherspoon ME, Kuhn A, Muehllehner G. Imaging performance of A-PET: A small animal PET camera. IEEE Trans Nucl Sci. 2005;24(7):844–852. doi: 10.1109/tmi.2005.844078. [DOI] [PubMed] [Google Scholar]
- Tai YC, Wu H, Pal D, OÕSullivan JA. Virtual-pinhole PET. J Nucl Med. 2008;49(3):471–479. doi: 10.2967/jnumed.107.043034. [DOI] [PMC free article] [PubMed] [Google Scholar]
- Tong S, Alessio AM, Thielemans K, Stearns C, Ross S, Kinahan PE. Properties and mitigation of edge artifacts in PSF-based pet reconstruction. IEEE Trans Nucl Sci. 2011;58(5):2264–2275. [Google Scholar]
- Wallach D, Lamare F, Kontaxakis G, Visvikis D. Super-resolution in respiratory synchronized positron emission tomography. IEEE Trans Med Imag. 2012;31(2):438–448. doi: 10.1109/TMI.2011.2171358. [DOI] [PubMed] [Google Scholar]
- Yang Y, St James S, Wu Y, Du H, Qi J, Farrell R, Dokhale PA, Shah KS, Vaigneur K, Cherry SR. Tapered LSO arrays for small animal PET. Phys Med Biol. 2011;56(1):139–153. doi: 10.1088/0031-9155/56/1/009. [DOI] [PMC free article] [PubMed] [Google Scholar]
- Zhang L, Staelens S, Van Holen R, Verhaeghe J, Vandenberghe S. Characterization of the ringing artifacts in rotator-based reconstruction with Monte Carlo-based resolution compensation for PET. Med Phys. 2010;37(9):4648–4660. doi: 10.1118/1.3478275. [DOI] [PubMed] [Google Scholar]
- Zhou J, Qi J. Adaptive imaging for lesion detection using a zoom-in PET system. IEEE Trans Med Imag. 2011a;30(1):119–130. doi: 10.1109/TMI.2010.2064173. [DOI] [PMC free article] [PubMed] [Google Scholar]
- Zhou J, Qi J. Fast and efficient fully 3D PET image reconstruction using sparse system matrix factorization with GPU acceleration. Phys Med Biol. 2011b;56(20):6739–6757. doi: 10.1088/0031-9155/56/20/015. [DOI] [PMC free article] [PubMed] [Google Scholar]