

Abstract
Disruption of serotonin synthesis in neurons and the periphery by knockout (KO) of mouse genes for tryptophan hydroxylases (peripheral Tph1 and neuronal Tph2) has been claimed to decrease (Tph2 KO) and increase (Tph1 KO) bone mass. In this report, adult male and female Tph2 KO mice were observed to have elevated spine trabecular bone. Female Tph2 KO mice have reduced midshaft femur cortical bone thickness. Bone mass was normal in male and female Tph1 KO mice examined as part of a Tph1/Tph2 double knockout (DKO) mouse cohort.
Introduction
Tryptophan hydroxylase (TPH) catalyzes the rate-limiting step in serotonin synthesis from tryptophan. There are two TPH enzymes, with TPH1 and TPH2 expressed in the periphery and neurons, respectively. Serotonin does not cross the blood–brain barrier, and thus serotonin actions are independently regulated in the brain and periphery. Brain serotonin influences mood, and selective serotonin reuptake inhibitors are used to treat depression. Platelets avidly accumulate serotonin, maintaining low free circulating serotonin levels. 5-hydroxyindoleacetic acid (5-HIAA) is the major metabolite of serotonin metabolism, and urinary 5-HIAA excretion is an index of the release of peripheral and neuronal serotonin. Historical developments involving serotonin discovery and actions have been reviewed.1
Knockout (KO) of Tph1 in mice during 20032,3 led to the discovery that Tph1 and Tph2 are separate genes,4 and several groups have studied Tph2 KO mice since 2008. Intestinal enterochromaffin cells are the primary depot of peripheral serotonin. Although gastrointestinal motility is minimally affected in Tph1 KO mice studied under standard laboratory conditions,5 detailed examination of colonic motility shows that serotonin secreted by enterochromaffin cells robustly stimulates mucosal colonic migrating motor complexes and fecal pellet propulsion while only minimally affecting stretch-induced peristalsis.6 Intestinal enteric neurons express TPH2, and Tph2 KO mice have enhanced gastric emptying, decreased intestinal motility and reduced numbers of enteric neurons.7 The multiple phenotypes observed in Tph1 and Tph2 KO mice have been elegantly reviewed.8,9,10
Decreased trabecular bone mass in spine and femur has been reported in growing Tph2 KO mice.11 This laboratory12 previously reported that disruption of Tph1 in mice resulted in high trabecular bone mass at 4 to 12 weeks of age by removing the normal suppression of bone formation promoted by gut-derived circulating serotonin. A second group13 observed high trabecular bone mass in Tph1 KO mice at 6 weeks of age, but not at 16 weeks of age, resulting from reduced bone resorption through an osteoclast autonomous mechanism. High bone mass in Tph1 KO mice was not confirmed by two other laboratories, including Lexicon.14,15 Interestingly, double knockout (DKO) of Tph1 and Tph2 was reported to result in low bone mass, suggesting that neuronal Tph2 might have a more critical role than peripheral Tph1 in skeletal metabolism.11
Using dual energy X-ray absorptiometry (DEXA) and microcomputed tomography (microCT) high-throughput screening, Lexicon examined 3762 viable gene KO mouse lines and found no obvious skeletal phenotypes in Tph1 and Tph2 KO mice.16 Given continued interest in serotonin and bone,17 we examined bone mass in additional cohorts of adult Tph1 KO, Tph2 KO and Tph1/Tph2 DKO mice.
Results
Male (18–21 weeks) and female (83 weeks) Tph2 KO mice fed a high-fat diet were examined in the first study, which involved bone measurements by both DEXA and microCT. The second study used quantitative magnetic resonance (QMR) body composition and microCT analyses of bones from male (33 weeks) and female (69 weeks) Tph1 KO, Tph2 KO and Tph1/Tph2 DKO mice. Brain serotonin content was greatly reduced in Tph2 KO and Tph1/Tph2 DKO mice. Whole blood and jejunal serotonin contents were greatly reduced in Tph1 KO and Tph1/Tph2 DKO mice (Figure 1). Twenty-four-hour urinary excretion (Figure 2) of 5-HIAA (measured during 4 consecutive days) was reduced 24% in Tph2 KO mice. For Tph1 KO mice (exon 3 disrupted), urinary 5-HIAA excretion was reduced 83%. Urine volumes and creatinine excretions were identical in WT and KO mice in both studies (data not shown). This greater reduction in urinary 5-HIAA excretion in Tph1 compared with Tph2 KO mice reflects the greater contribution of TPH1 to body serotonin turnover. Body weight (obtained during high-throughput screening) was reduced during growth in Tph2 KO mice (Figure 3).
Figure 1.

Brain, whole blood and jejunal serotonin contents in Tph1 KO, Tph2 KO and Tph1/Tph2 DKO mice. Male mice were examined at 33 weeks of age.
Figure 2.
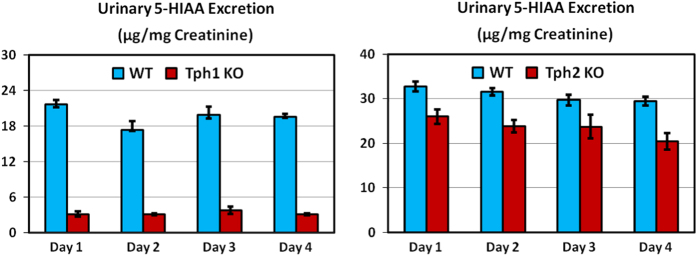
Urinary 5-HIAA excretion for Tph1 and Tph2 KO mice. Male Tph1 KO mice studied at 14 months of age (left) and female Tph2 KO mice at 6–7 months of age (right). Tph1 KO mouse data were published previously.24 Data are means±s.e.m. for six mice per group. For Tph1 KO mice, P<0.001 for Days 1, 2, 3 and 4. For Tph2 KO mice, P<0.01 for days 1, 2 and 4.
Figure 3.
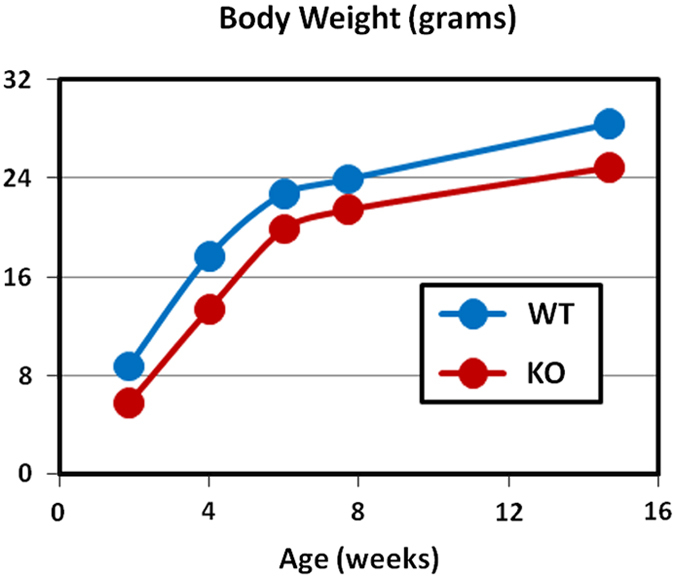
Body weight during growth in Tph2 KO mice. Data obtained during high-throughput screening.16 Equal numbers of male and female mice were examined for each genotype at each age, with Ns=4 for WT and Ns=8 for KO mice. P<0.001 at 2 weeks and P=0.02 at 4 weeks of age.
Tph1 and Tph2 KO mice had reduced body fat (Tables 1 and 2), and studies examining this lean phenotype in Tph2 KO mice will be reported separately. Femur length was decreased by 3–4% in male Tph2 KO and Tph1/Tph2 DKO mice in the DKO study (Table 3), but it was normal in all other Tph2 KO cohorts. Midshaft femur total area was normal in all Tph2 KO mice but slightly decreased (3% in male mice and 5% in female mice) in Tph1/Tph2 DKO mice. Female Tph2 KO mice had reduced midshaft femur cortical thickness in both the Tph2 KO (Table 4) and DKO studies (Figure 4), as did female Tph1/Tph2 DKO mice. Femur cortical thickness was normal in male Tph2 KO mice.
Table 1. DEXA data for male and female Tph2 KO mice.
| Parameter | Male mice WT=12, KO=13 | Statistics | Female mice WT=15, KO=13 | Statistics |
|---|---|---|---|---|
| Body BMD (mg cm−2) | WT: 57.1±0.9 | Δ=Zero | WT: 54.9±0.9 | Δ=−1% |
| KO: 57.1±0.7 | P=0.94 | KO: 54.6±0.9 | P=0.82 | |
| Spine BMD (mg cm−2) | WT: 60.6±1.7 | Δ=11% | WT:46.0±3.2 | Δ=22% |
| KO: 67.4±1.7 | P=0.01 | KO: 56.0±3.6 | P=0.05 | |
| Femur BMD (mg cm−2) | WT: 88.3±1.6 | Δ=2% | WT: 85.9±2.1 | Δ=NC |
| KO: 89.5±1.5 | P=0.55 | KO: 85.8±1.8 | P=0.97 | |
| Body weight (grams) | WT: 32.8±1.3 | Δ=−2% | WT: 35.2±1.6 | Δ=−8% |
| KO: 31.0±0.9 | P=0.24 | KO: 32.3±2.2 | P=0.29 | |
| Lean body mass (grams) | WT: 24.0±0.7 | Δ=10% | WT: 19.6±0.5 | Δ=3% |
| KO: 26.2±0.6 | P=0.02 | KO: 20.3±0.7 | P=0.46 | |
| Body fat (percent) | WT: 28.0±1.4 | Δ=−43% | WT: 39.4±1.7 | Δ=−23% |
| KO: 16.1±1.1 | P<0.001 | KO: 30.2±3.1 | P=0.01 |
Abbreviations: BMD, bone mineral density; DEXA, dual energy X-ray absorptiometry; KO, knockout; NC, no change; WT, wild type.
Male and female mice were examined at 18 and 83 weeks of age, respectively.
Table 2. QMR body composition data for Tph1 KO, Tph2 KO and Tph1/Tph2 DKO Mice.
| Parameter | Body weight (grams) | Lean body mass (grams) | Body fat (%) |
|---|---|---|---|
| Male WT (N=10) | 42.6±2.5 | 31.1±1.4 | 26.1±2.1 |
| Male Tph1 KO (N=14) | 39.9±0.9 | 31.5±0.8 | 20.1±1.9 |
| Male Tph2 KO (N=8) | 35.5±0.8 | 29.9±1.1 | 14.8±2.9 |
| Male Tph1/Tph2 DKO (N=11) | 32.2±0.8 | 29.9±0.7 | 9.2±0.5 |
| Statistics | P=0.13 for Tph1 P<0.001 for Tph2 interaction P=0.86 | P=0.89 for Tph1 P=0.07 for Tph2 interaction P=0.59 | P=0.005 for Tph1 P<0.001 for Tph2 interaction P=0.92 |
| Female WT (N=15) | 38.2±2.0 | 24.0±0.6 | 35.6±2.3 |
| Female Tph1 KO (N=9) | 40.8±2.9 | 26.1±0.9 | 34.7±2.8 |
| Female Tph2 KO (N=14) | 39.0±2.9 | 25.0±0.8 | 32.9±3.1 |
| Female Tph1/Tph2 DKO (N=6) | 31.6±1.9 | 24.9±1.2 | 20.6±3.4 |
| Statistics | P=0.13 for Tph1 P<0.001 for Tph2 interaction P=0.86 | P=0.26 for Tph1 P=0.91 for Tph2 interaction P=0.24 | P=0.04 for Tph1 P=0.01 for Tph2 interaction P=0.04 |
Abbreviations: DKO, double knockout; KO, knockout; QMR, quantitative magnetic resonance; WT, wild type.
Male and female mice were examined at 33 and 65 weeks of age, respectively.
Table 3. MicroCT bone data for Tph1 KO, Tph2 KO and Tph1/Tph2 DKO mice.
| Parameter | LV5 Tb number (1/N) | Femur length (mm) | Femur total area (mm2) |
|---|---|---|---|
| Male WT (N=10) | 4.50±0.28 | 16.5±0.1 | 2.22±0.09 |
| Male Tph1 KO (N=14) | 4.46±0.19 | 16.7±0.1 | 2.27±0.07 |
| Male Tph2 KO (N=8) | 5.62±0.43 | 16.0±0.1 | 2.23±0.07 |
| Male Tph1/Tph2 DKO (N=11) | 4.59±0.28 | 16.0±0.2 | 2.04±0.05 |
| Statistics | P=0.07 for Tph1 P=0.03 for Tph2 interaction P=0.09 | P=0.68 for Tph1 P<0.001 for Tph2 interaction P=0.44 | P=0.33 for Tph1 P=0.12 for Tph2 interaction P=0.10 |
| Female WT (N=15) | 3.10±0.13 | 16.6±0.1 | 3.10±0.13 |
| Female Tph1 KO (N=9) | 2.87±0.13 | 16.8±0.2 | 2.87±0.13 |
| Female Tph2 KO (N=14) | 3.06±0.21 | 16.6±0.1 | 3.06±0.21 |
| Female Tph1/Tph2 DKO (N=6) | 2.54±0.23 | 16.6±0.3 | 2.54±0.23 |
| Statistics | P=0.06 for Tph1 P=0.35 for Tph2 interaction P=0.46 | P=0.66 for Tph1 P=0.44 for Tph2 interaction P=0.42 | P=0.08 for Tph1 P=0.67 for Tph2 interaction P=0.52 |
Abbreviations: DKO, double knockout; KO, knockout; MicroCT, microcomputed tomography; WT, wild type.
Male and female mice were examined at 33 and 65 weeks of age, respectively.
Table 4. MicroCT bone data for male and female Tph2 KO mice.
| Parameter | Male mice WT=12, KO=13 | Statistics | Female mice WT=11, KO=11 | Statistics |
|---|---|---|---|---|
| LV5 Tb BV/TV (%) | WT: 20.2±0.9 | Δ=19% | WT: 12.8±0.9 | Δ=1% |
| KO: 24.0±0.5 | P=0.004 | KO: 13.0±1.2 | P=0.90 | |
| LV5 Tb number (1/N) | WT: 4.84±0.19 | Δ=17% | WT: 2.75±0.16 | Δ=8% |
| KO: 5.67±0.18 | P=0.001 | KO: 2.97±0.30 | P=0.54 | |
| LV5 Tb thickness (μm) | WT: 44.5±0.7 | Δ=NC | WT: 46.1±2.7 | Δ=−8% |
| KO: 44.6±1.0 | P=0.99 | KO: 42.6±2.6 | P=0.31 | |
| DFM Tb BV/TV (%) | WT: 5.4±0.8 | Δ=35% | Not measured | |
| KO: 7.3±0.8 | P=0.11 | |||
| DFM Tb number (1/N) | WT: 3.19±0.28 | Δ=18% | Not measured | |
| KO: 3.77±0.19 | P=0.09 | |||
| DFM Tb thickness (μm) | WT: 44.7±1.3 | Δ=−1% | Not measured | |
| KO: 44.3±2.0 | P=0.89 | |||
| Femur length (mm) | WT: 16.3±0.1 | Δ=−2% | WT: 16.5±0.1 | Δ=1% |
| KO: 16.0±0.1 | P=0.03 | KO: 16.7±0.2 | P=0.47 | |
| Femur total area (mm2) | WT: 1.96±0.08 | Δ=NC | WT: 2.24±0.09 | Δ=−1% |
| KO: 1.97±0.06 | P=0.95 | KO: 2.21±0.05 | P=0.78 | |
| Femur Ct.Th (μm) | WT: 237±3 | Δ=3% | WT: 266±5 | Δ=−13% |
| KO: 245±6 | P=0.43 | KO: 232±7 | P<0.001 |
Abbreviations: BV/TV, bone volume/total volume; DFM, distal femur metaphysis; Ct.Th, cortical bone thickness; KO, knockout; MicroCT, microcomputed tomography; NC, no change; Tb, trabecular bone; WT, wild type.
Male and female mice were examined at 21 and 83 weeks of age, respectively.
Figure 4.

MicroCT bone data for Tph1 KO, Tph2 KO and Tph1/Tph2 DKO mice. Male (top) and female (bottom) mice were examined at 21 and 83 weeks of age, respectively.
In the Tph2 KO study, spine bone mineral density (BMD) was elevated in male and female KO mice, but body and femur BMD were normal (Table 1). MicroCT analyses (Table 4) showed normal LV5 trabecular bone parameters in female mice, but elevated trabecular bone volume/total volume (BV/TV) and trabecular number in male mice. Similar trends were observed for distal femur trabecular bone in male mice, but these differences did not reach statistical significance. In the DKO study, LV5 trabecular bone BV/TV was slightly increased (8% in male mice and 9% in female mice), but these elevations did not reach statistical significance (Figure 3). LV5 trabecular number was elevated 23% in male, but not female, Tph2 KO mice in the DKO study (Table 3). Trabecular thickness was consistently normal in Tph2 KO mice. No skeletal phenotypes were observed in male and female Tph1 KO mice examined as part of the DKO cohort (Figure 4, Tables 2 and 3).
Discussion
Contrary to published data showing reduced spine trabecular bone mass in Tph2 KO mice,11,13 our KO mice had moderately elevated vertebral body trabecular bone. Previous work did not examine cortical bone, and thus our observation of moderately reduced femoral cortical bone thickness in female, but not male, Tph2 KO mice is novel. Our observation of greatly reduced body fat in all four cohorts of Tph2 KO mice confirms previous findings.11
Previous studies11,13 examined Tph2 KO mice at 4 to 16 weeks of age, whereas Lexicon's mice were examined at 18 through 83 weeks of age. Tph2 KO mice have a transient growth retardation starting a few days after birth and lasting through 4 months of age18,19 and limited data from Lexicon's KO mouse screening analyses16 support this finding. Low trabecular bone mass in studies examining growing mice is possibly related to their small size. Body length and bone width were normal in one study,11 with neither study reporting body weight.
Besides aging effects in Tph2 KO mice, there is no obvious explanation for differences in bone phenotypes of Tph1 and Tph2 KO mice observed by other groups11,12,13 and Lexicon. Normal bone mass in male (33 weeks) and female (65 weeks) Tph1 KO mice reported here confirms previous findings in nine mouse cohorts independently examined by Lexicon and the Max Delbrück Center for Molecular Medicine.14 Novartis also observed normal bone mass in Tph1 KO mice (Michaela Kneissel, personal communication). We encourage additional laboratories to examine bones from Tph1 and Tph2 KO mice, with particular emphasis on effects of age for Tph2 KO mice. In contrast to differences in bone phenotypes of Tph1 KO mice, our Tph1 KO mice had reduced body fat with normal LBM, confirming leanness in a recent report.20
Lexicon has extensive experience examining skeletal phenotypes resulting from disrupting mouse genes16 and Lexicon's expertise in serotonin actions and metabolism resulted in successful clinical trials examining TPH1 inhibitors for irritable bowel21,22 and carcinoid syndromes.23 Medicinal chemistry and preclinical pharmacology data for these TPH inhibitors have been published.24,25,26,27
A limitation of this report is the lack of mechanistic studies designed to explain the observed trabecular and cortical bone phenotypes in Tph2 KO mice. High trabecular bone BV/TV resulting from elevated trabecular number rather than greater trabecular thickness is consistent with reduced bone resorption rather than increased bone formation. Low cortical bone thickness with a normal diameter results from elevated endocortical bone resorption.
From our extensive experience examining KO mice,16 we classify the elevated spine bone mass and reduced cortical bone thickness observed in Tph2 KO mice as moderate skeletal phenotypes. Such phenotypes can appear and disappear in various cohorts and skeletal sites and often show random sexual dimorphism when few cohorts are examined. Individual cohorts can show trends (without statistical significance) supporting phenotypes observed in other cohorts. The average sample size was 11 for the twelve mouse genotype groups reported here.
We have no explanation for the differences in bone phenotypes for Tph1 and Tph2 KO mice observed by Karsenty's laboratory and those reported here. The Karsenty group has produced several high-profile reports having substantial influence on skeletal biology research. In several cases, other groups have been unable to independently replicate these findings. These cases include studies involving brain serotonin metabolism,28,29,30 bone phenotypes in mice with disrupted leptin signaling,10,31,32,33,34 bone phenotypes in mice with KOs of β-adrenergic receptors35,36,37 and actions of osteocalcin on glucose metabolism and diabetes.38,39,40 Potential explanations for observations of distinct phenotypes in similar mouse models include, but are not limited to, environmental conditions, age, genetic backgrounds and diets. To help understand mechanisms behind these observed differences, Lexicon's Tph1 (TF4141) and Tph2 (TF2875) KO mice are available from Taconic Biosciences. We call upon all members of our scientific community to make available all mouse strains that have been used for their publications so that important observations can be independently verified.
Materials and methods
Methods used to generate Tph2 KO mice (excising exons 1 and 2) and determine 5-HIAA (urine) and serotonin (whole blood, brain and jejunum) levels have been reported previously.24,41 Lexicon's previously published Tph1 KO mice were generated by excising exon 3.24 For this report, a distinct Tph1 KO mouse line was generated by excising exons 4 through 7 (Figure 5). All mice were F2 hybrids of the C57BL/6J and 129SvEv parental strains. Wild-type control mice were littermates and cagemates of KO mice. Male and female mice in the Tph2 KO study and, starting at 43 weeks of age, female mice in the Tph1/Tph2 DKO study were fed purified high-fat diet with 45 percent of calories derived from fat (diet D12451 from Research Diets, New Brunswick, NJ, USA). Male mice and young female mice in the DKO study were fed standard rodent chow. BMD was determined with a PIXImus DEXA (InsideOutside Sales, Fitchburg, WI, USA). Body composition was measured by DEXA and QMR (Echo Medical Systems, Houston, TX, USA). Bone mass and architecture were determined using a Scanco μCT40 microCT (Wangen-Brüttisellen, Switzerland) using standard procedures. LV5 vertebral body trabecular bone parameters and midshaft femur cortical bone total area (diameter) and thickness were measured. Standard mouse metabolic cages were used to collect urine over 24-h intervals. All procedures involving mice were conducted following Lexicon Pharmaceuticals' Institutional Animal Care and Use Committee guidelines that are in compliance with state and federal laws and the standards described in the Guide for the Care and Use of Laboratory Animals (National Research Council, 2011). Statistical analyses involved Student's t-test (Tph2 KO study) and two-factor ANOVA (Tph1/Tph2 DKO study). Data are reported as means±s.e.m.
Figure 5.

Tph1 (exons 4 through 7) KO strategy.
Acknowledgments
Lexicon's KO mouse phenotyping campaign involved hundreds of scientists.
Footnotes
Lexicon Pharmaceuticals is currently examining a drug (telotristat etiprate) inhibiting TPH1 in a Phase III clinical trial for carcinoid syndrome. All authors were full-time employees of Lexicon Pharmaceuticals when the experiments were performed.
References
- Sjoerdsma AG. Starting with Serotonin: How a High-Rolling Father of Drug Discovery Repeatedly Beat the Odds Improbable Books: MD, USA, 2008; . [Google Scholar]
- Walther DJ, Peter JU, Bashammakh S, Hörtnagl H, Voits M, Fink H et al. Synthesis of serotonin by a second tryptophan hydroxylase isoform. Science 2003; 299: 76. [DOI] [PubMed] [Google Scholar]
- Côté F, Thévenot E, Fligny C, Fromes Y, Darmon M, Ripoche MA et al. Disruption of the nonneuronal tph1 gene demonstrates the importance of peripheral serotonin in cardiac function. Proc Natl Acad Sci USA 2003; 100: 13525–13530. [DOI] [PMC free article] [PubMed] [Google Scholar]
- Walther DJ, Bader M. A unique central tryptophan hydroxylase isoform. Biochem Pharmacol 2003; 66: 1673–1680. [DOI] [PubMed] [Google Scholar]
- Gershon MD. Serotonin is a sword and a shield of the bowel: serotonin plays offense and defense. Trans Am Clin Climatol Assoc 2012; 123: 268–280. [PMC free article] [PubMed] [Google Scholar]
- Heredia DJ, Gershon MD, Koh SD, Corrigan RD, Okamoto T, Smith TK. Important role of mucosal serotonin in colonic propulsion and peristaltic reflexes: in vitro analyses in mice lacking tryptophan hydroxylase 1. J Physiol 2013; 591: 5939–5957. [DOI] [PMC free article] [PubMed] [Google Scholar]
- Li Z, Chalazonitis A, Huang YY, Mann JJ, Margolis KG, Yang QM et al. Essential roles of enteric neuronal serotonin in gastrointestinal motility and the development/survival of enteric dopaminergic neurons. J Neurosci 2011; 31: 8998–9009. [DOI] [PMC free article] [PubMed] [Google Scholar]
- Trowbridge S, Narboux-Nême N, Gaspar P. Genetic models of serotonin (5-HT) depletion: what do they tell us about the developmental role of 5-HT? Anat Rec (Hoboken) 2011; 294: 1615–1623. [DOI] [PubMed] [Google Scholar]
- Amireault P, Sibon D, Côté F. Life without peripheral serotonin: insights from tryptophan hydroxylase 1 knockout mice reveal the existence of paracrine/autocrine serotonergic networks. ACS Chem Neurosci 2013; 4: 64–71. [DOI] [PMC free article] [PubMed] [Google Scholar]
- Mosienko V, Beis D, Pasqualetti M, Waider J, Matthes S, Qadri F et al. Life without brain serotonin: Reevaluation of serotonin function with mice deficient in brain serotonin synthesis. Behav Brain Res 2015; 277C: 78–88. [DOI] [PubMed] [Google Scholar]
- Yadav VK, Oury F, Suda N, Liu ZW, Gao XB, Confavreux C et al. A serotonin-dependent mechanism explains the leptin regulation of bone mass, appetite, and energy expenditure. Cell 2009; 138: 976–989. [DOI] [PMC free article] [PubMed] [Google Scholar]
- Yadav VK, Ryu JH, Suda N, Tanaka KF, Gingrich JA, Schütz G et al. Lrp5 controls bone formation by inhibiting serotonin synthesis in the duodenum. Cell 2008; 135: 825–837. [DOI] [PMC free article] [PubMed] [Google Scholar]
- Chabbi-Achengli Y, Coudert AE, Callebert J, Geoffroy V, Côté F, Collet C et al. Decreased osteoclastogenesis in serotonin-deficient mice. Proc Natl Acad Sci USA 2012; 109: 2567–2572. [DOI] [PMC free article] [PubMed] [Google Scholar]
- Cui Y, Niziolek PJ, MacDonald BT, Zylstra CR, Alenina N, Robinson DR et al. Lrp5 functions in bone to regulate bone mass. Nat Med 2011; 17: 684–691. [DOI] [PMC free article] [PubMed] [Google Scholar]
- Cui Y, Niziolek PJ, MacDonald BT, Alenina N, Matthes S, Jacobsen CM et al. Reply to Lrp5 regulation of bone mass and gut serotonin synthesis. Nat Med 2014; 20: 1229–1230. [DOI] [PMC free article] [PubMed] [Google Scholar]
- Brommage R, Liu J, Hansen GM, Kirkpatrick LL, Potter DG, Sands AT et al. High-throughput screening of mouse gene knockouts identifies established and novel skeletal phenotypes. Bone Res 2014; 2: 14034. [DOI] [PMC free article] [PubMed] [Google Scholar]
- de Vernejoul MC, Collet C, Chabbi-Achengli Y. Serotonin: good or bad for bone. Bonekey Rep 2012; 1: 120. [DOI] [PMC free article] [PubMed] [Google Scholar]
- Alenina N, Kikic D, Todiras M, Mosienko V, Qadri F, Plehm R et al. Growth retardation and altered autonomic control in mice lacking brain serotonin. Proc Natl Acad Sci USA 2009; 106: 10332–10337. [DOI] [PMC free article] [PubMed] [Google Scholar]
- Narboux-Nême N, Angenard G, Mosienko V, Klempin F, Pitychoutis PM, Deneris E et al. Postnatal growth defects in mice with constitutive depletion of central serotonin. ACS Chem Neurosci 2013; 4: 171–181. [DOI] [PMC free article] [PubMed] [Google Scholar]
- Crane JD, Palanivel R, Mottillo EP, Bujak AL, Wang H, Ford RJ et al. Inhibiting peripheral serotonin synthesis reduces obesity and metabolic dysfunction by promoting brown adipose tissue thermogenesis. Nat Med 2014; 21: 166–172. [DOI] [PMC free article] [PubMed] [Google Scholar]
- Camilleri M. LX-1031, a tryptophan 5-hydroxylase inhibitor, and its potential in chronic diarrhea associated with increased serotonin. Neurogastroenterol Motil 2011; 23: 193–200. [DOI] [PMC free article] [PubMed] [Google Scholar]
- Pavel M, Wiedenmann B, Caplin M, Hoersch D, Freiman J, Law L et al. Telotristat etiprate produces clinical and biochemical responses in patients with carcinoid syndrome: update of a Phase 2, multicenter, open-label, serial-ascending, European study. Pancreas 2013; 42: 368–387.23875193 [Google Scholar]
- Brown PM, Drossman DA, Wood AJ, Cline GA, Frazier KS, Jackson JI et al. The tryptophan hydroxylase inhibitor LX1031 shows clinical benefit in patients with nonconstipating irritable bowel syndrome. Gastroenterology 2011; 141: 507–516. [DOI] [PMC free article] [PubMed] [Google Scholar]
- Liu Q, Yang Q, Sun W, Vogel P, Heydorn W, Yu XQ et al. Discovery and characterization of novel tryptophan hydroxylase inhibitors that selectively inhibit serotonin synthesis in the gastrointestinal tract. J Pharmacol Exp Ther 2008; 325: 47–55. [DOI] [PubMed] [Google Scholar]
- Shi ZC, Devasagayaraj A, Gu K, Jin H, Marinelli B, Samala L et al. Modulation of peripheral serotonin levels by novel tryptophan hydroxylase inhibitors for the potential treatment of functional gastrointestinal disorders. J Med Chem 2008; 51: 3684–3687. [DOI] [PubMed] [Google Scholar]
- Jin H, Cianchetta G, Devasagayaraj A, Gu K, Marinelli B, Samala L et al. Substituted 3-(4-(1,3,5-triazin-2-yl)-phenyl)-2-aminopropanoic acids as novel tryptophan hydroxylase inhibitors. Bioorg Med Chem Lett 2009; 19: 5229–5232. [DOI] [PubMed] [Google Scholar]
- Cianchetta G, Stouch T, Yu W, Shi ZC, Tari LW, Swanson RV et al. Mechanism of inhibition of novel tryptophan hydroxylase inhibitors revealed by co-crystal structures and kinetic analysis. Curr Chem Genomics 2010; 4: 19–26. [DOI] [PMC free article] [PubMed] [Google Scholar]
- Yadav VK, Oury F, Tanaka KF, Thomas T, Wang Y, Cremers S et al. Leptin-dependent serotonin control of appetite: temporal specificity, transcriptional regulation, and therapeutic implications. J Exp Med 2011; 208: 41–52. [DOI] [PMC free article] [PubMed] [Google Scholar]
- Lam DD, Leinninger GM, Louis GW, Garfield AS, Marston OJ, Leshan RL et al. Leptin does not directly affect CNS serotonin neurons to influence appetite. Cell Metab 2011; 13: 584–591. [DOI] [PMC free article] [PubMed] [Google Scholar]
- Donovan MH, Tecott LH. Serotonin and the regulation of mammalian energy balance. Front Neurosci 2013; 7: 36. [DOI] [PMC free article] [PubMed] [Google Scholar]
- Ducy P, Amling M, Takeda S, Priemel M, Schilling AF, Beil FT et al. Leptin inhibits bone formation through a hypothalamic relay: a central control of bone mass. Cell 2000; 100: 197–207. [DOI] [PubMed] [Google Scholar]
- Hamrick MW, Pennington C, Newton D, Xie D, Isales C. Leptin deficiency produces contrasting phenotypes in bones of the limb and spine. Bone 2004; 34: 376–383. [DOI] [PubMed] [Google Scholar]
- Turner RT, Kalra SP, Wong CP, Philbrick KA, Lindenmaier LB, Boghossian S et al. Peripheral leptin regulates bone formation. J Bone Miner Res 2013; 28: 22–34. [DOI] [PMC free article] [PubMed] [Google Scholar]
- Motyl KJ, Rosen CJ. Understanding leptin-dependent regulation of skeletal homeostasis. Biochimie 2012; 94: 2089–2096. [DOI] [PMC free article] [PubMed] [Google Scholar]
- Takeda S, Elefteriou F, Levasseur R, Liu X, Zhao L, Parker KL et al. Leptin regulates bone formation via the sympathetic nervous system. Cell 2002; 111: 305–317. [DOI] [PubMed] [Google Scholar]
- Bonnet N, Pierroz DD, Ferrari SL. Adrenergic control of bone remodeling and its implications for the treatment of osteoporosis. J Musculoskelet Neuronal Interact 2008; 8: 94–104. [PubMed] [Google Scholar]
- Bouxsein ML, Devlin MJ, Glatt V, Dhillon H, Pierroz DD, Ferrari SL. Mice lacking beta-adrenergic receptors have increased bone mass but are not protected from deleterious skeletal effects of ovariectomy. Endocrinology 2009; 150: 144–152. [DOI] [PMC free article] [PubMed] [Google Scholar]
- Lee NK, Sowa H, Hinoi E, Ferron M, Ahn JD, Confavreux C et al. Endocrine regulation of energy metabolism by the skeleton. Cell 2007; 130: 456–469. [DOI] [PMC free article] [PubMed] [Google Scholar]
- Booth SL, Centi A, Smith SR, Gundberg C. The role of osteocalcin in human glucose metabolism: marker or mediator? Nat Rev Endocrinol 2013; 9: 43–55. [DOI] [PMC free article] [PubMed] [Google Scholar]
- Andrews NA. Skeletal regulation of glucose metabolism: challenges in translation from mouse to man. IBMS Bonekey 2013; 10: 353. [Google Scholar]
- Savelieva KV, Zhao S, Pogorelov VM, Rajan I, Yang Q, Cullinan E et al. Genetic disruption of both tryptophan hydroxylase genes dramatically reduces serotonin and affects behavior in models sensitive to antidepressants. PLoS One 2008; 3: e3301. [DOI] [PMC free article] [PubMed] [Google Scholar]