Abstract
Although MYCN amplification has been associated with aggressive neuroblastoma, the molecular mechanisms that differentiate low-risk, MYCN-non amplified neuroblastoma from high-risk, MYCN-amplified disease are largely unknown. Genomic and proteomic studies have been limited in discerning differences in signaling pathways that account for this heterogeneity. N-linked glycosylation is a common protein modification resulting from the attachment of sugars to protein residues and important in cell signaling and immune response. Aberrant N-linked glycosylation has been routinely linked to various cancers. In particular, glycomic markers have often proved useful in distinguishing cancers from precancerous conditions. Here, we perform a systematic comparison of N-linked glycomic variation between MYCN-non-amplified SY5Y and MYCN-amplified NLF cell lines with the aim of identifying changes in sugar abundance linked to high-risk neuroblastoma. Through a combination of liquid chromatography-mass spectrometry and bioinformatics analysis, we identified 16 glycans that show a statistically significant change in abundance between NLF and SY5Y samples. Closer examination revealed the preference for larger (in terms of total monosaccharide count) and more sialylated glycan structures in the MYCN-amplified samples in comparison to smaller, non-sialylated glycans that are more dominant in the MYCN-non-amplified samples. These results offer clues for deriving marker candidates for accurate neuroblastoma risk diagnosis.
Keywords: glycomics, neuroblastoma, mass spectrometry
INTRODUCTION
Neuroblastoma (NBL) is the most common extra-cranial solid tumor in children and is responsible for 10–15% of pediatric cancer-related deaths1. A key attribute of this disease is its clinical heterogeneity with widely variable responses to treatment in patients with histologically similar tumors. Current means of stratifying patients into risk categories include a combination of clinical markers such as age, tumor stage, and histology, as well as genetic markers such as loss of chromosome 1p and MYCN oncogene amplification2. As a member of MYC family of transcription factors, MYCN encodes the nuclear phosphoprotein N-myc3 whose over-expression has been related to tumorigenesis in neuroblastoma. However, discordance between MYCN amplification and other prognostic factors have been reported, thereby making optimal treatment difficult to predict. Most children with high-risk NBL ultimately die from their disease, and better therapeutics are needed. Molecular genomic and proteomic profiling have provided powerful insights into neuroblastoma biology, including identification of mutations and variations in genetic markers such as ALK and PHX2B4, greater incidence of loss of heterozygosity events in tumor cells5, detection of differences in protein phosphorylation within MYCN-amplified and non-amplified neuroblastoma6, and derivation of small sets of differentially regulated genes7 and proteins8 through comparison of different types of tumors. However, these findings have yet to be translated into clinical mechanisms or improvements in disease stratification.
Protein glycosylation is a post-translational modification wherein a glycan gets attached to specific amino acids. Glycans are sugar chains comprised of monosaccharides that form structures that show tremendous variety in branching, steoremeric configuration, and flexible glycosidic bonds. As one of the most common post-translational modifications of proteins, glycosylation is responsible for many protein attributes, such as tertiary structure formation, mediating intercellular communication, and immune response to pathogen infections9. N-linked glycosylation (or N-glycosylation) results from the attachment of a sugar chain to an asparagine residue within the motif Asn-Xaa-Ser/Thr (where Xaa can be any amino acid except proline). Another distinguishing characteristic of N-glycosylation is that all N-linked glycans share a common “pentamer” core structure consisting of two N-acteylglucosamine residues (GlcNAc) and three mannose (Man) residues. The attachment occurs prior to folding, implying that N-glycosylation affects the tertiary structure and stability of the glycoprotein. Quantitative changes in glycosylation have been associated with many human diseases, including hereditary disorders, cardiovascular disease, and cancer9–10. Additionally, glycomic changes have been associated with transition from non-lethal non-cancerous diseases to oncogenic equivalents11–12. High-throughput and highly-sensitive liquid-chromatography mass-spectrometry (LC-MS) platforms are routinely used to detect and monitor glycomic differences between healthy and diseased individuals13–14. Within neuroblastoma, monoclonal antibodies targeting GD2 digangliosides are routinely used as treatment in high-risk disease15. Additionally, alterations in both N- and O-linked glycosylated sites in molecules such as ICAM-2 and cell-surface mucins have been linked to NBL16 through associations with ALK phosphorylation17, a key signaling pathways in NBL. However, a comprehensive glycomic profiling of NBL cells has yet to be performed. In this study, we detected and compared profiles of N-linked glycans between MYCN-amplified NLF and MYCN-non-amplified SY5Y cell lines using a combination of enzymatic release using PNGaseF, permethyaltion, LC separation, and tandem mass spectrometry (MS/MS). The NLF cell line is derived from human abdomen from a 3 year-old male with neuroblastoma and contains amplified levels on MYCN and 1p deletion. The SY5Y cell line is sub-line whose parental cell line SK-N-SH, from the thorax of a four year old female diagnosed with neuroblastoma, and containing only a single copy of N-myc. More details are available in Thiele18.
Out of 47 glycans detected and quantified in our study, 16 glycans showed significant variation (p-value < 0.05) in abundance. Network analysis and statistical testing revealed increased abundance, particularly in larger, sialylated structures within MYCN-amplified NLF cells that are associated with aggressive neuroblastoma. Further profiling of these glycans could facilitate better stratification of patients with neuroblastoma and result in better therapeutic options.
MATERIALS & METHODS
Materials
NLF and SY5Y cell lines were obtained from Dr. Garrett Brodeur at the Children’s Hospital of Philadelphia. Borane-ammonia complex, sodium hydroxide beads, dimethyl sulfoxide (DMSO), iodomethane, and MS-grade formic acid were purchased from Sigma-Aldrich (St. Louis, MO). Acetonitrile was obtained from Fisher Scientific (Pittsburgh, PA), and HPLC grade water was obtained from Mallinckrodt Chemicals (Phillipsburg, NJ). N-Glycosidase peptide purified from Flavobacterium meningosepticum (PNGase F) was procured from New England Biolabs Inc. (Ipswich, MA).
Cell lysis
Cells were collected and resuspended in 100 µL of PBS buffer. To insure efficient cell lysis, collected cells were frozen and thawed for several cycles. Then, the cell lines were sonicated at ice bath for one hour and denatured at 80oC for another one hour.
Release of N-linked glycans
PNGase F was used for enzymatic release of N-glycans from glycoproteins. 2.4-µL aliquot of PNGase F (120 unit) was added to 100 µL of denatured samples and incubated in a 37°C water bath for 18 hours.
Dialysis and reduction
The released N-glycans were purified by dialysis through a cellulose ester (CE) membrane of molecular size cut-off of 500 Da to1000 Da. An in-house built dialysis device was utilized for removing excess salts. The dialyzed samples were collected and dried under vacuum. Then, 0.1 mg–0.2 mg of ammonium-borane complex was weighed and dissolved in water to a final concentration of 10 µg/µL. A 10-µL aliquot of fresh ammonium borane solution was added to N-glycans. The samples were incubated in a 65 °C water bath for 1h before adding 10 µL acetic acid (10%). Then, the reaction mixtures were dried under vacuum. 300 µL of methanol was added into each sample, which were then placed in a concentrator for drying. This step was repeated several times to remove all borane complexes.
Permethylation
The reduced samples were further permethylated to increase the ionization efficiency of the native glycans. The permethylation was conducted according to published guidelines19. Briefly, the reduced N-glycans were resuspended in 30 µL DMSO, 20 µL iodomethane, and 1.2 µL water. The reaction mixtures were applied to a sodium hydroxide bead-filled spin column, kept at room temperature for 25 min. Another 20 µL iodomethane was applied to the top of the column and incubated for another 20 min. After reaction, the samples were spun down, and 50 µL of acetonitrile was applied to the top of the column and centrifuged to elute the entire sample.
LC-MS/MS conditions
Permethylated N-glycans were resuspended in 20% acetonitrile with 0.1% formic acid and separated by nano-LC (Thermo Scientific, San Jose, CA) on a reverse phase Acclaim® PepMap capillary column (150 mm × 75 µm in diameter) packed with 100 Å C18 bounded phase (Thermo Scientific). Separation was attained using a two solvent system. Solvent A consisted of 2% acetonitrile and 98% water with 0.1% formic acid. Samples were loaded to Acclaim® PepMap100 C18 nanotrap column (20 mm×75 µm, Thermo Scientific) with 100% solvent A for online purification. The loaded samples were purified with solvent A for 10min with flow rate of 3 µL/min prior to the valve switch to separation column. The separation was started at 20% solvent B and increase to 38% solvent B at 11 min. Gradient conditions were accomplished with 38%–45% solvent B over 32min at a flow rate of 350 nL/min. LC separation was operated at 60oC using a nano-LC system that interfaced to a Velos LTQ Orbitrap hybrid mass spectrometer (Thermo Scientific, San Jose, CA). A representative LC-profile in Supplementary Figure 1 illustrates good chromatographic separation. The mass resolution for precursor ion scans was set at 15000 and ±1.5 Da mass tolerance window was used for precursor ion selection. The mass spectrometer was operated in an automated data-dependent acquisition mode in which the scan mode switched between MS full scan (m/z from 500–2000), CID MS/MS scan which was conducted on the four most abundant ions with a 0.250 Q-value, 20 ms activation time, and 35% normalized collision energy and HCD MS/MS scan was conducted on the four most abundant ions with 0.1 ms activation time, 45% normalized collision energy and a resolution of 7500. Dynamic exclusion (peak count 2; peak duration 30s; exclusion list size 50; exclusion duration 60s) was used to increase glycan MSMS coverage. Exclusion mass width of ±1.5 Da was utilized. Analysis was performed in replicates of three per group (i.e., SY5Y and NLF).
Glycan structural assignment
The Xcalibur Qual Browser (Thermo Fisher Scientific) was used to generate extracted-ion chromatograms from the full MS scans using glycan monoisotopic masses with a set mass tolerance of 10 ppm. Seven-point boxcar smoothing was enabled to improve the derived peak quality. Tandem mass spectra corresponding to glycan ions were manually annotated, and diagnostic fragment ions were utilized to confirm the glycan structures.
Glycan quantitation, plotting and statistical characterization
Abundance values of glycans in each of the three replicates within SY5Y and NLF samples were obtained from their eXtracted Ion Chromatograms (XIC). Peak areas of different charge states and ion adducts were summed and used as a measure for glycan quantitation. Scatter plots built using the R statistical framework were used to confirm reproducibility of the correlation of glycan abundance between the replicates within each group. SPSS IBM Statistics software was used to perform a t-test in order to detect glycans with significant variation (p-value < 0.05) between SY5Y and NLF. A heatmap describing glycomic abundance profiles was built using the heatmap.2 function in R (gplots package). Hierarchical clustering was performed using the hclust function in the R statistical package on normalized glycan abundances (z-score normalized within each sample), using correlation as the similarity measure and method set to complete linkage. The hclust function performs a hierarchical cluster analysis using dissimilarities between a set of data points. It first assigns each data point to a cluster and then merges clusters iteratively based on similarity until a single cluster is reached, upon which the algorithm is terminated.
Additionally, a glycan graph was built, where a pair of glycans were linked by a directed edge if the difference between their total monosaccharide counts increased by one in exactly one position, with the direction indicating increase in monosaccharide count. The glycan graph was built using JGraph and JApplet and visualized in Omnigraffle. Outline colors were used to indicate NLF versus SY5Y abundance variation. Finally, statistical testing for dependence of MYCN amplification on the total number of HexNAc and Hex monosaccharides, the number of sialic acid molecules, and the presence of fucosylation was conducted using linear-regression based on a generalized linear mixed model (glm function) in R. The response variable was set to 1 or 0 depending on whether the glycan was significantly increased in abundance in NLF as compared to SY5Y (p-value < 0.05). Covariate p-value estimates, based on the null hypothesis of the covariate being zero, were used to determine which of the dependent variables listed above had an effect on MYCN amplification.
RESULTS & DISCUSSION
Identification of glycans in SY5Y and NLF neuroblastoma cell lines
LC/ESI-MS data were processed using Xcalibur Qual Browser. The monoisotopic mass of each N-glycan structure was used to generate extracted-ion chromatograms. Mass tolerance was set to 10 ppm. There were 47 N-glycans derived from all three replicates within NLF and SY5Y cell lines that were detected by LC-MS according to their accurate mass. Glycan structures were annotated based on their accurate mass and tandem mass spectra. Thirty-eight glycans were confirmed through MS/MS while the remaining nine have an m/z match with mass accuracy less than 2 ppm. The N-glycans with no tandem MS data were also confirmed through their retention time. Examples of 21 manually annotated MS/MS spectra are listed in Supplemental Information. HCD of sodium precursor ions yield more fragment information for N-glycan structure elucidation.
Quantitative glycomic profiling between SY5Y and NLF cell lines
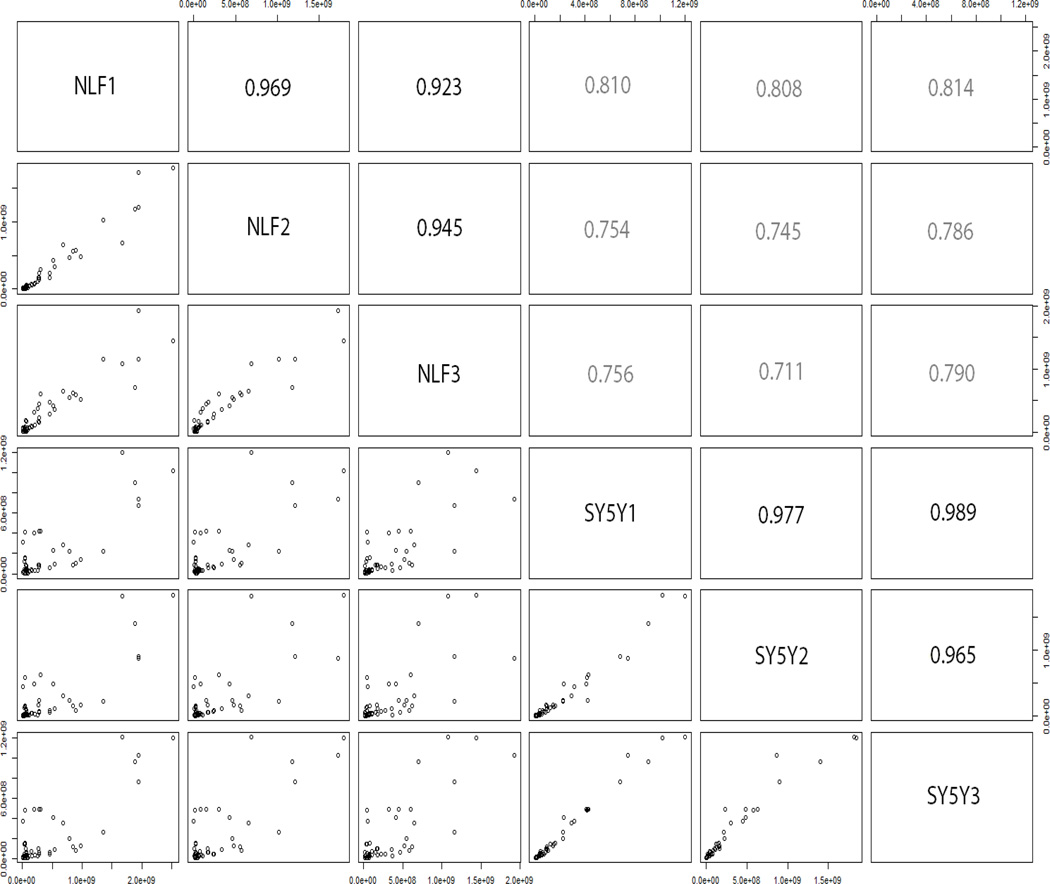
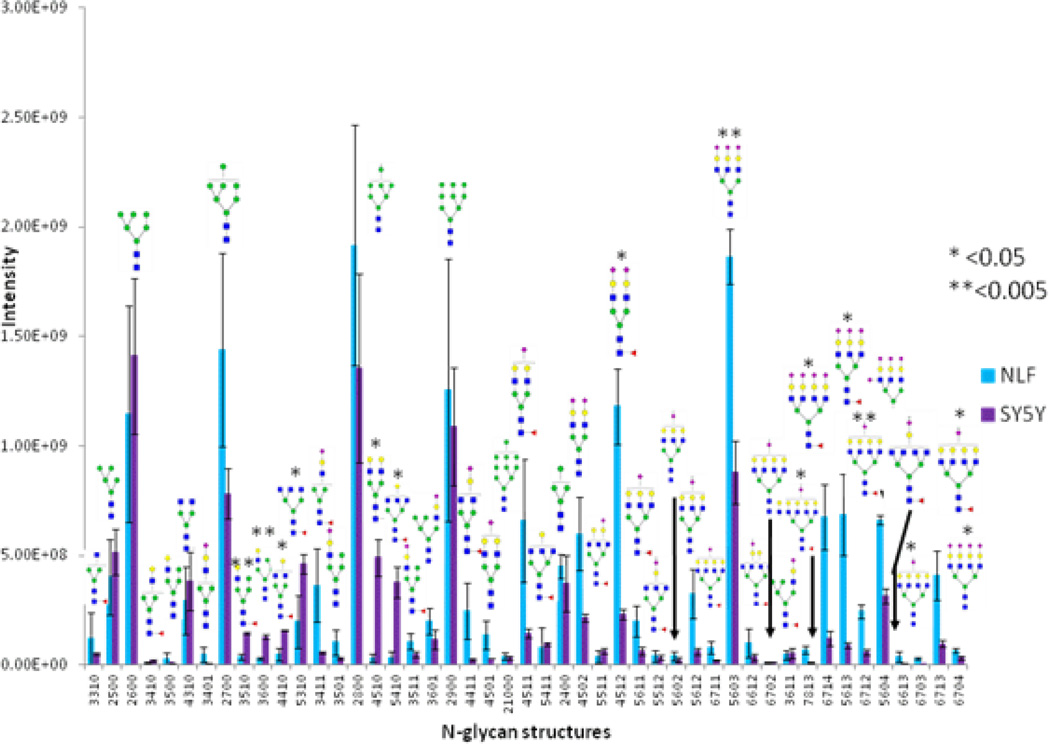
Glycans were quantified using XIC values, after summation of peak areas across all adducts and charge states. Figure 1 depicts a matrix of scatterplots when comparing abundance (measured as XIC) profiles of 47 glycans between samples. The upper-diagonal portion of the plot indicates correlation scores, indicative of variation within and across cell lines. A high correlation (>0.9, indicated by bolder text in Figure 1) was observed between samples within a cell line, thereby indicating high-reproducibility between technical replicates. A lower correlation (0.7–0.8, indicated by lighter text in Figure 1) was observed when comparing glycomic abundances across cell lines, indicative of differences in N-glycosylation between NLF and SY5Y cells. Quantitative results of 47 glycans are shown in Figure 2. In subsequent text, we represent glycans in their monosaccharide composition form in the following order: HexNAc (number of GlcNAc), Hex (sum of mannose and galactose), dHex (number of fucose), and NeuAc (number of sialic acid terminations). There were no structures with galactose residues that were derived. In Figure 2, glycans are represented on the x-axis in the HexNAcHexdHexNeuAc format, but cartoon graphs indicating glycan topology are also indicated. For example, the glycan HexNAc5Hex5dHex1NeuAc1 is represented on the x-axis of Figure 2 as 5511. We will use this notation to indicate glycan monosaccharide composition in all subsequent figures and tables. In SY5Y, the top 3 most abundant glycans detected were all high-mannose glycans, viz. HexNAc2Hex6, (Figure 2, #2600), HexNAc2Hex8 (Figure 2, #2800), and HexNAc2Hex9 (Figure 2, #2900). The high-mannose glycan HexNAc2Hex8 was the most abundant in NLF followed by the triantenary tri-sialylated glycan HexNAc5Hex6NeuAc3 (Figure 2, #5603) second and HexNAc2Hex7 (Figure 2, #2700).
Figure 1.
Comparison of detected glycan abundances (measured as XICs) within and across NLF and SY5Y cell lines. The lower-diagonal plots show scatter plots of glycan abundances within two groups, with the upper-diagonal part of the matrix depicting the correlation measure. For example, the correlation between NLF1 and SY5Y3 cell lines is depicted in the lower leftmost box, and the correlation coefficient is given in the upper rightmost box (0.815). The plot trends depict high correlation between technical replicates within cell lines (bolder text - indicative of good reproducibility) and low correlation across cell lines (lighter text-indicative of differences).
Figure 2.
Abundance profiles for detected glycans. X-axis shows glycan type and follows a HexNAc-Hex-dHex-NeuAc format. Y-axis depicts average glycomic abundances (from three replicates per group). Comparisons were made between abundance values between NLF and SY5Y cell line samples using the statistical t-test. Glycans denoted by * showed statistical significance in differential expression (p-value < 0.05). In particular, NLF (i.e., MYCN amplified) cell lines show a strong preference for larger and sialylated (NeuAc) structures when compared with SY5Y (i.e., MYCN non-amplified) cell lines.
When comparing glycan abundances between SY5Y and NLF, sixteen glycans were detected with significant variation (p-value of t-test < 0.05,indicated in Figure 2 with a *: #3510, #3600, #4410, #5310, #4510, #5410, #4512, #5603, #7813, #6714, #5613, #6712, #5604, #6703, #6713, and #6704). Cartoon representations and p-values for these are given in Table 1. Corresponding cartoon structures and p-values for all 47 glycans are given in Supplementary Table 1. The glycans that display the most significant increase in abundance in NLF when compared to SY5Y (rows marked with green arrows in Table 1) include HexNAc5Hex6NeuAc4 (p-value 3E-04), HexNAc5Hex6NeuAc3 (p-value 1E-03), and HexNAc6Hex7dHex1NeuAc2 (p-value 3E-03), all which were sialylated. In contrast, the top glycans that display the most significant increase in abundance in SY5Y as compared to NLF (rows marked with red arrows in Table 1) include HexNAc3Hex6 (with p-value 1E-03), HexNAc3Hex5dHex1 (p-value: 2E-03), and HexNAc5Hex4dHex1 (p-value 6E-03), all of which were non-sialylated.
Table 1.
List of 16 significant N-glycans derived from NFL and SY5Y, along with derived topologies, p-values from a t-test comparison between groups, and direction of change (green : NLF>SY5Y and red: NLF <SY5Y). The full list is found in Supplementary Table 1.
| Glycan | Representation | Composition | N-glycan Structure | p-value |
|---|---|---|---|---|
| 1 | 5604 | HexNAc5Hex6NeuAc4 | 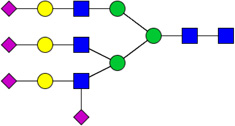 |
3E-04 
|
| 2 | 3600 | HexNAc3Hex6 |  |
1E-03 
|
| 3 | 5603 | HexNAc5Hex6NeuAc3 |  |
1E-03 
|
| 4 | 3510 | HexNAc3Hex5dHex1 |  |
2E-03 
|
| 5 | 6712 | HexNAc6Hex7dHex1NeuAc2 | 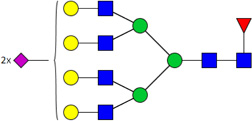 |
3E-03 
|
| 6 | 5410 | HexNAc5Hex4dHex1 |  |
6E-03 
|
| 7 | 6703 | HexNAc6Hex7NeuAc3 | 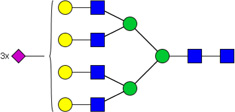 |
8E-03 
|
| 8 | 4510 | HexNAc4Hex5dHex1 |  |
9E-03 
|
| 9 | 4512 | HexNAc4Hex5dHex1NeuAc2 | 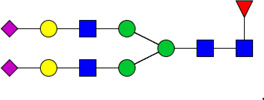 |
0.010 
|
| 10 | 6714 | HexNAc6Hex7dHex1NeuAc4 | 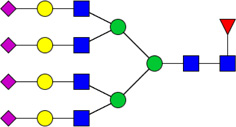 |
0.019 
|
| 11 | 4410 | HexNAc4Hex4dHex1 |  |
0.020 
|
| 12 | 7813 | HexNAc7Hex8dHex1NeuAc3 | 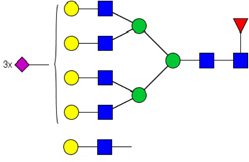 |
0.022 
|
| 13 | 6704 | HexNAc6Hex7NeuAc4 | 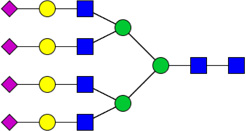 |
0.025 
|
| 14 | 5613 | HexNAc5Hex6dHex1NeuAc3 |  |
0.030 
|
| 15 | 6713 | HexNAc6Hex7dHex1NeuAc3 | 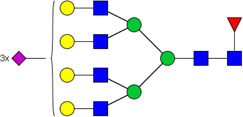 |
0.038 
|
| 16 | 5310 | HexNAc5Hex3dHex1 |  |
0.049 
|
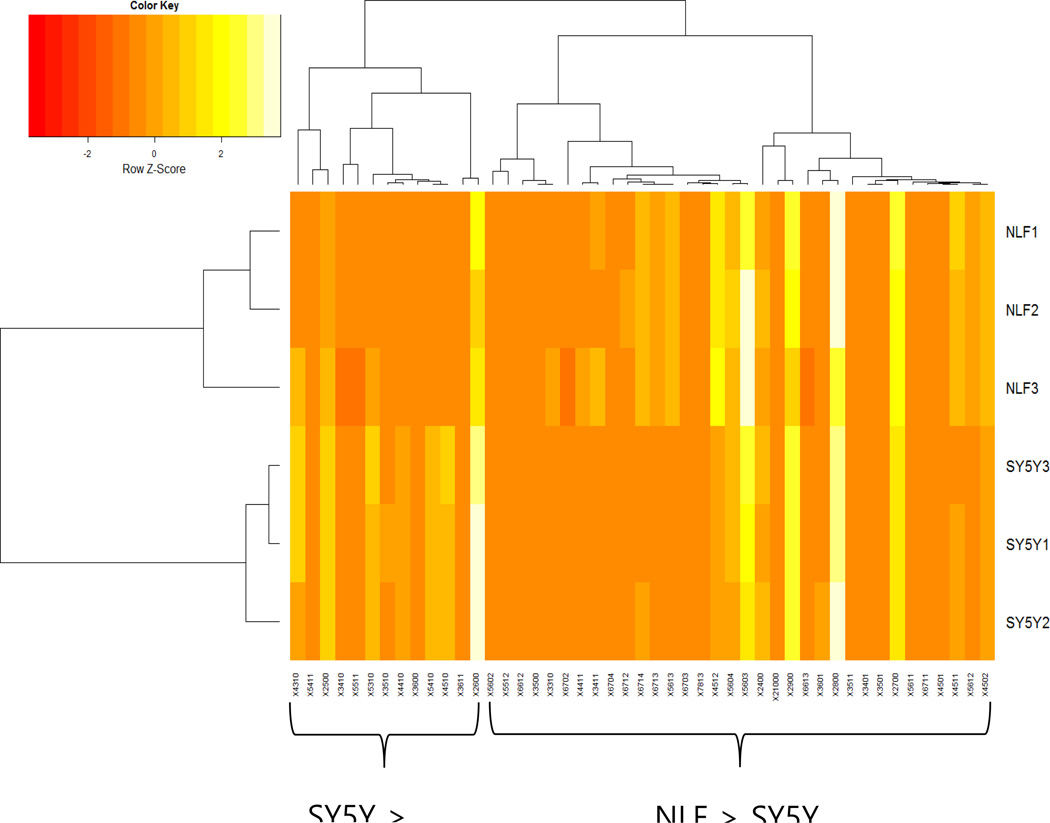
Figure 3 depicts hierarchical clustering performed on normalized glycomic abundances. The column labels correspond to the different species of glycan as described in Figure 2 and Table 1. A clear division is observed at the highest split node of the hierarchical tree, separating glycans more abundant in SY5Y from glycans more abundant in NLF. Because NLF and SY5Y cell lines are derived from tumors with highly divergent clinical behavior (e.g., MYCN-amplified vs. non-MYCN-amplified), these results merit further study towards developing methods to stratify patients.
Figure 3.
Hierarchical clustering of glycomic abundances. Each column is a glycan indicated as in a X-HexNAc-Hex-dHex-NeuAc format. There is a split between glycans that are more abundant in SY5Y versus glycans that are more abundant in NLF, highly differential glycosylation behavior with respect to MYCN amplification.
MYCN amplification relationship with monosaccharide count and sialylation
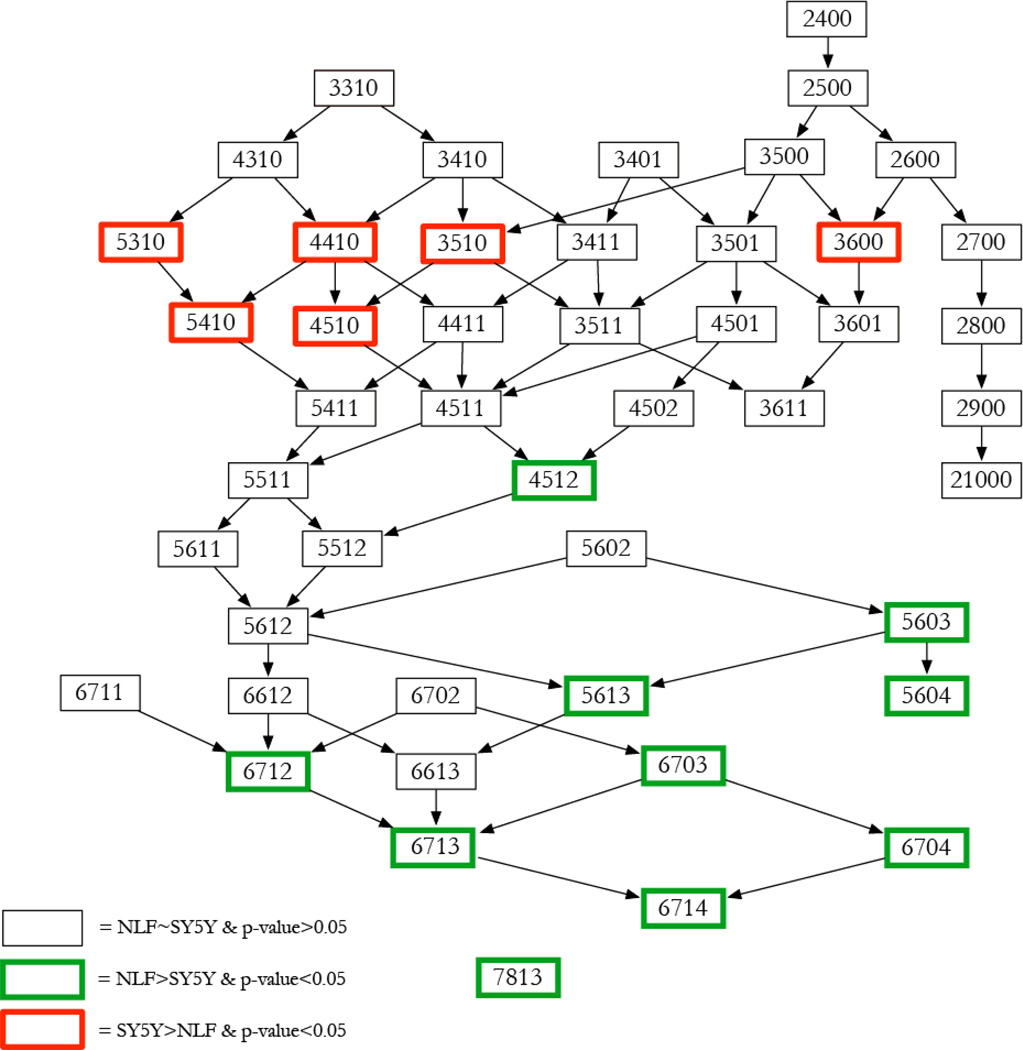
From Figure 2, it was observed that increased expression in larger glycans (i.e. glycans with larger number of monosaccharides), along with an increase in sialylation might be associated with MYCN amplification. To study this further, we created a ‘glycan graph’ similar to glycan network reported in literature20. Figure 4 depicts the graph that illustrates relationship between glycan topology and MYCN amplification. Each node represents a glycan and each directed edge signifies an increase in monosaccharide composition count by one in exactly one position among the monosaccharides. Glycans are layered according to total monosaccharide count, and thus each layer or tier of the graph is comprised of glycans with the same number of monosaccharides. The glycan graph is different from a glycan reaction network which indicates a stepwise addition and deletion of monosaccharides based on enzyme activity, i.e., a pair of glycans are linked if the conversion from one structure to the other can be made in a single-step glycosyltransferase or glycosidase reaction. For example, it is not possible to go from HexNAc2Hex5 (#2500) to the glycan HexNAc3Hex5 (#3500) in a single reaction, even though the only difference is one HexNAc. In reality, the entire procedure would be at least a 3-step reaction that involves a glycosidase removing a terminal Man, followed by two glycosyltransferase additions for Gal (galactose) and the GlcNAc residues. However, these two glycans can be connected using an edge in the glycan graph, since the difference in monosaccharide composition is exactly one. The glycan graph is a useful means to illustrate relationship between glycan topology and abundance variations.
Figure 4.
Glycan graph arranged according to total monosaccharide count. Each node is a glycan and two nodes are linked by a directed edge if the difference in monosaccharide count is +1 in only one position in the HexNAc-Hex-dHex-NeuAc format. The glycan HexNAc7Hex8dHex1Fuc3 was a single node without any edge connections. The node outline color indicates if the glycan was significantly more abundant in SY5Y (red) or NLF (green). From the graph, there is evidence that bigger glycans and glycans with more sialylated structures are more abundant in MYCN-amplified NLF cells.
The smallest detected glycan HexNAc2Hex4 (#2400) is situated in the top layer and the largest connected glycan HexNac6Hex7dHex1NeuAc4 (#6714, with one non-terminal NeuAc) is at the lowest layer of the graph. The node outline color represents significance and direction of variation between SY5Y and NLF cells (black: no change, red: > SY5Y, green: NLF). Through this process, all glycans were mapped into the glycan graph (Figure 4) except for the largest glycan, HexNAc7Hex8dHex1NeuAc3, which was a singleton without any connections. Interestingly, glycans that show a significant increase in expression in SY5Y are located at the top of the glycan graph, while glycans that show a significant increase in expression in NLF are located towards the bottom. The association between glycan size and cancer has been reported in literature21–22, but this study suggests the association between increased expression in larger glycans and MYCN amplification in neuroblastoma.
The first glycan within our glycan graph that shows a statistically significant increase in NLF was HexNac4Hex5dHex1NeuAc2 (#4512). While not statistically significant, both parent nodes also depict glycans more abundant in NLF. Moving up the graph, we see that the path 4510-4511-4512 indicates a gradual transition from a statistically significant increase in abundance in SY5Y to an increase in abundance in NLF with increase in sialylation. Targeted studies aimed at these three glycans along with a study of sialyltransferase (in particular ST6GAL1 enzyme) could help elucidate the biological importance of this transition in glycan abundance.
The association of increased sialylation with MYCN amplified NLF cells seems to be an overall effect, as indicated by glycans with 3 and 4 sialic acid molecules situated towards the bottom of the glycan graph (Figure 4) as opposed to 1 or no sialic acid terminations. In an attempt to estimate the effects of glycan size, increased sialylation and fucosylation in NLF cells, we performed a linear regression using a generalized linear model (GLM). The binary response variable was set to 1 or 0 depending on whether the glycan showed a significant increase in abundance in NLF samples. The response was modeled as being dependent of HexNAc+Hex, number of NeuAc and presence of Dehex. The resulting p-values for parameter estimates depicted that among all the dependents, the number of sialic acids (p-value = 0.0194) was significant to MYCN amplification in neuroblastoma. A log-likelihood-based analysis of variance (ANOVA) comparison of the above model against a model considering only size and presence of fucose as covariates resulted in a p-value (measured as chi-squared with 1 degree of freedom) of 0.002 thereby confirming the association of increased sialic acid to MYCN amplification.
The relationship between increased sialylation and cancer has been well established21, 23. For example, aberrant sialylation has been liked to several effects in tumor cells, such as inhibition of apostosis and resistance to cancer24. Ras and c-Myc oncogenes have been shown to control transcription of sialyltransferases directly affecting tumor cell motility24–25. Another example of cancer-sialic acid relationship is that increased sialylation leads to increased expression of tumor-associated antigens including sialyl-Lewis x/a, gangliosides (GD2, GD3), and polysialic acid26. Increased sialylation has also been associated with tumor aggressiveness in breast cancer20. In light of these observations, avenues for targeting aberrant sialylation are currently being explored extensively in other cancers27. Within neuroblastoma, monitoring expression of gangliosides GD1b, GT1b, and GQ1b (which display increasing sialylated modification with respect to their “a” versions) has been suggested as a means of stratifying neuroblastoma patients19. Additionally, metabolically introducing synthetic Sia precusors has been observed to reduce cell surface polysialylation and overall sialylation activity in SH-SY5Y cells, which in turn leads to a significant reduction in cell migration28. The results presented in this paper strengthen the argument of studying glycosylation in neuroblastoma, particularly on associations between increased sialylation in N-linked glycans and disease aggressiveness. Further glycomic or glycosyltransferase analyses on tumor samples and cell lines are necessary to gain deeper insight into disease mechanisms of neuroblastoma.
CONCLUSION
In this study, we performed N-linked glycomic profile comparison between MYCN non-amplified SY5Y and MYCN-amplified NLF neuroblastoma cell lines. Through a combination of LC-ESI-MS and statistical analysis, a total of 47-glycans were profiled out of which sixteen depicted statistically significant differences between SY5Y and NLF. Further, preference for larger glycans and increased sialylation was detected in NLF samples. In particular, increased sialylation revealed a statistical association with MYCN amplification in neuroblastoma. The results of this study serve as a foundation for exploring aberrant glycosylation for risk-stratification as well as for therapeutic development in neuroblastoma.
Supplementary Material
Other Supplemental Information: Example MS/MS spectra of 21 glycans with derived topologies as indicated by annotated peaks.
List of of N-glycans derived from NFL and SY5Y, along with derived topologies and p-values from a t-test comparison between groups. Glycans that show significant change in abundance between SY5Y and NLF cell lines are indicated by *.
Example chromatographic profile for (a) NLF and (b) SY5Y. The chromatographic profile for the first replicate in each group was extracted and plotted to ensure good chromatographic resolution.
ACKNOWLEDGEMENTS
This work was supported by St. Baldrick's Foundation (S.V.), CPRIT RP130624 (Y.M) and NIH grants 1R01GM093322-04 and 1R01GM112490-01 (Y.M.).
REFERENCES
- 1.Maris JM, Hogarty MD, Bagatell R, Cohn SL. Neuroblastoma. The Lancet. 2007;369(9579):2106–2120. doi: 10.1016/S0140-6736(07)60983-0. [DOI] [PubMed] [Google Scholar]
- 2.Park JR, Bagatell R, London WB, Maris JM, Cohn SL, Mattay KM, Hogarty M on behalf of the, C. O. G. N. C. Children's Oncology Group's 2013 blueprint for research: Neuroblastoma. Pediatric Blood & Cancer. 2013;60(6):985–993. doi: 10.1002/pbc.24433. [DOI] [PubMed] [Google Scholar]
- 3.Mukherjee B, Morgenbesser SD, DePinho RA. Myc family oncoproteins function through a common pathway to transform normal celss in culture: cross-inteference by Max and trans-acting dominant mutants. Genes & Development. 1992;6(8):1480–1492. doi: 10.1101/gad.6.8.1480. [DOI] [PubMed] [Google Scholar]
- 4.Maris JM. Recent Advances in Neuroblastoma. New England Journal of Medicine. 2010;362(23):2202–2211. doi: 10.1056/NEJMra0804577. [DOI] [PMC free article] [PubMed] [Google Scholar]
- 5.Volchenboum SL, Li C, Li S, Attiyeh EF, Reynolds CP, Maris JM, Look AT, George RE. Comparison of Primary Neuroblastoma Tumors and Derivative Early-Passage Cell Lines Using Genome-Wide Single Nucleotide Polymorphism Array Analysis. Cancer Research. 2009;69(10):4143–4149. doi: 10.1158/0008-5472.CAN-08-3112. [DOI] [PMC free article] [PubMed] [Google Scholar]
- 6.DeNardo BD, Holloway MP, Ji Q, Nguyen KT, Cheng Y, Valentine MB, Salomon A, Altura RA. Quantitative Phosphoproteomic Analysis Identifies Activation of the RET and IGF-1R/IR Signaling Pathways in Neuroblastoma. PLoS ONE. 2013;8(12):e82513. doi: 10.1371/journal.pone.0082513. [DOI] [PMC free article] [PubMed] [Google Scholar]
- 7.Schulte JH, Schramm A, Klein-Hitpass L, Klenk M, Wessels H, Hauffa BP, Eils J, Eils R, Brodeur GM, Schweigerer L, Havers W, Eggert A. Microarray analysis reveals differential gene expression patterns and regulation of single target genes contributing to the opposing phenotype of TrkA- and TrkB-expressing neuroblastomas. Oncogene. 2004;24(1):165–177. doi: 10.1038/sj.onc.1208000. [DOI] [PubMed] [Google Scholar]
- 8.Sitek B, Apostolov O, Stühler K, Pfeiffer K, Meyer HE, Eggert A, Schramm A. Identification of Dynamic Proteome Changes Upon Ligand Activation of Trk-Receptors Using Two-dimensional Fluorescence Difference Gel Electrophoresis and Mass Spectrometry. Molecular & Cellular Proteomics. 2005;4(3):291–299. doi: 10.1074/mcp.M400188-MCP200. [DOI] [PubMed] [Google Scholar]
- 9.Varki A, Cummings RD, Esko JD, Freeze HH, Stanley P, Bertozzi CR, Hart GW, Etzler ME. Essentials of Glycobiology. Second ed. Cold Spring Harbor Laboratory Press; 2008. [PubMed] [Google Scholar]
- 10.An HJ, Kronewitter SR, Leoz MLAd, Lebrilla CB. Glycomics and disease markers. Current Opinion in Chemical Biology. 2009;13(5–6):601–607. doi: 10.1016/j.cbpa.2009.08.015. [DOI] [PMC free article] [PubMed] [Google Scholar]
- 11.Kim K, Ruhaak LR, Nguyen UT, Taylor SL, Dimapasoc L, Williams C, Stroble C, Ozcan S, Miyamoto S, Lebrilla CB, Leiserowitz GS. Evaluation of Glycomic Profiling as a Diagnostic Biomarker for Epithelial Ovarian Cancer. Cancer Epidemiology Biomarkers & Prevention. 2014;23(4):611–621. doi: 10.1158/1055-9965.EPI-13-1073. [DOI] [PMC free article] [PubMed] [Google Scholar]
- 12.Mitra I, Zhuang Z, Zhang Y, Yu C-Y, Hammoud ZT, Tang H, Mechref Y, Jacobson SC. N-Glycan Profiling by Microchip Electrophoresis to Differentiate Disease States Related to Esophageal Adenocarcinoma. Analytical Chemistry. 2012;84(8):3621–3627. doi: 10.1021/ac203431s. [DOI] [PMC free article] [PubMed] [Google Scholar]
- 13.Ruhaak LR, Miyamoto S, Lebrilla CB. Developments in the Identification of Glycan Biomarkers for the Detection of Cancer. Molecular & Cellular Proteomics. 2013;12(4):846–855. doi: 10.1074/mcp.R112.026799. [DOI] [PMC free article] [PubMed] [Google Scholar]
- 14.Mechref Y, Hu Y, Garcia A, Zhou S, Desantos-Garcia JL, Hussein A. Defining putative glycan cancer biomarkers by MS. Bioanalysis. 2012;4(20):2457–2469. doi: 10.4155/bio.12.246. [DOI] [PMC free article] [PubMed] [Google Scholar]
- 15.Parsons K, Bernhardt B, Strickland B. Targeted Immunotherapy for High-Risk Neuroblastoma—The Role of Monoclonal Antibodies. Annals of Pharmacotherapy. 2013;47(2):210–218. doi: 10.1345/aph.1R353. [DOI] [PubMed] [Google Scholar]
- 16.Berois N, Osinga E. Glycobiology of neuroblastoma:impact on tumor behavior, prognosis, and therapeutic stratergies. Frontiers in Oncology. 2014;4(114) doi: 10.3389/fonc.2014.00114. [DOI] [PMC free article] [PubMed] [Google Scholar]
- 17.Del Grosso F, De Mariano M, Passoni L, Luksch R, Tonini GP, Longo L. Inhibition of N-linked glycosylation impairs ALK phosphorylation and disrupts pro-survival signaling in neuroblastoma cell lines. BMC Cancer. 2011;11(525) doi: 10.1186/1471-2407-11-525. [DOI] [PMC free article] [PubMed] [Google Scholar]
- 18.Thiele CJ. Neuroblastoma Cell Lines. Journal of Human Cell Culture. 1998;1:21–53. [Google Scholar]
- 19.Hettmer S, Malott C, Woods W, Ladisch S, Kaucic K. Biological Stratification of Human Neuroblastoma by Complex “B” Pathway Ganglioside Expression. Cancer Research. 2003;63(21):7270–7276. [PubMed] [Google Scholar]
- 20.Julien S, Ivetic A, Grigoriadis A, QiZe D, Burford B, Sproviero D, Picco G, Gillett C, Papp SL, Schaffer L, Tutt A, Taylor-Papadimitriou J, Pinder SE, Burchell JM. Selectin Ligand Sialyl-Lewis x Antigen Drives Metastasis of Hormone-Dependent Breast Cancers. Cancer Research. 2011;71(24):7683–7693. doi: 10.1158/0008-5472.CAN-11-1139. [DOI] [PMC free article] [PubMed] [Google Scholar]
- 21.Dube DH, Bertozzi CR. Glycans in cancer and inflammation [mdash] potential for therapeutics and diagnostics. Nat Rev Drug Discov. 2005;4(6):477–488. doi: 10.1038/nrd1751. [DOI] [PubMed] [Google Scholar]
- 22.Kyselova Z, Mechref Y, Kang P, Goetz JA, Dobrolecki LE, Sledge GW, Schnaper L, Hickey RJ, Malkas LH, Novotny MV. Breast Cancer Diagnosis and Prognosis through Quantitative Measurements of Serum Glycan Profiles. Clinical Chemistry. 2008;54(7):1166–1175. doi: 10.1373/clinchem.2007.087148. [DOI] [PubMed] [Google Scholar]
- 23.Adamczyk B, Tharmalingam T, Rudd PM. Glycans as cancer biomarkers. Biochimica et Biophysica Acta (BBA) - General Subjects. 2012;1820(9):1347–1353. doi: 10.1016/j.bbagen.2011.12.001. [DOI] [PubMed] [Google Scholar]
- 24.Büll C, Stoel MA, den Brok MH, Adema GJ. Sialic Acids Sweeten a Tumor's Life. Cancer Research. 2014 doi: 10.1158/0008-5472.CAN-14-0728. [DOI] [PubMed] [Google Scholar]
- 25.Seales EC, Jurado GA, Singhal A, Bellis SL. Ras oncogene directs expression of a differentially sialylated, functionally altered [beta]1 integrin. Oncogene. 2003;22(46):7137–7145. doi: 10.1038/sj.onc.1206834. [DOI] [PubMed] [Google Scholar]
- 26.Astronomo RD, Burton DR. Carbohydrate vaccines: developing sweet solutions to sticky situations? Nat Rev Drug Discov. 2010;9(4):308–324. doi: 10.1038/nrd3012. [DOI] [PMC free article] [PubMed] [Google Scholar]
- 27.Büll C, Boltje TJ, Wassink M, de Graaf AMA, van Delft FL, den Brok MH, Adema GJ. Targeting Aberrant Sialylation in Cancer Cells Using a Fluorinated Sialic Acid Analog Impairs Adhesion, Migration, and In Vivo Tumor Growth. Molecular Cancer Therapeutics. 2013;12(10):1935–1946. doi: 10.1158/1535-7163.MCT-13-0279. [DOI] [PubMed] [Google Scholar]
- 28.Gnanapragassam VS, Bork K, Galuska CE, Galuska SP, Glanz D, Nagasundaram M, Bache M, Vordermark D, Kohla G, Kannicht C, Schauer R, Horstkorte R. Sialic Acid Metabolic Engineering: A Potential Strategy for the Neuroblastoma Therapy. PLoS ONE. 2014;9(8):e105403. doi: 10.1371/journal.pone.0105403. [DOI] [PMC free article] [PubMed] [Google Scholar]
Associated Data
This section collects any data citations, data availability statements, or supplementary materials included in this article.
Supplementary Materials
Other Supplemental Information: Example MS/MS spectra of 21 glycans with derived topologies as indicated by annotated peaks.
List of of N-glycans derived from NFL and SY5Y, along with derived topologies and p-values from a t-test comparison between groups. Glycans that show significant change in abundance between SY5Y and NLF cell lines are indicated by *.
Example chromatographic profile for (a) NLF and (b) SY5Y. The chromatographic profile for the first replicate in each group was extracted and plotted to ensure good chromatographic resolution.


