

Abstract
Introduction
Long non‐coding RNA (lncRNA) have proven to play key roles in cell physiology from nuclear organization and epigenetic remodeling to post‐transcriptional regulation. Last decade, gene expression based‐classifications have been developed in clear‐cell renal cell carcinoma (ccRCC) to identify distinct subtypes of disease and predict patient's outcome. However, there are no current lncRNA comprehensive characterizations in ccRCC.
Patients and methods
RNA‐sequencing profiles of 475 primary ccRCC samples from the Cancer Genome Atlas (TCGA) were used to assess expressed lncRNA and identify lncRNA‐based classification. In addition, integrative analysis was performed to correlate tumor subtypes with copy‐number alterations and somatic mutations.
Results
Using stringent criteria, we identified 1934 expressed lncRNA and assessed their chromatin marks. Unsupervised clustering unravels four lncRNA subclasses in ccRCC associated with distinct clinicopathological and genomic features of this disease. Cluster C2 (23.4%) defines the most aggressive tumours, with the highest Fuhrman grade and stage and the worst overall survival time. Furthermore, cluster C2 is enriched for 9p deletion and chromatin remodeler BAP1 somatic mutations. Interestingly, cluster C4 (7.8%) is related to a tumor subtype arising from the distal tubules of the nephron. Consistent with its distinct ontogeny, cluster C4 is devoid of classical alterations seen in ccRCC, bears frequent 1p deletion and 17q gain, and is enriched for MiTF/TFE translocations. In addition, reexaminations of copy‐number data from one side and tumor histology by pathologists from the other side reveal misclassified tumors within C4 cluster including chromophobe RCC and clear cell papillary RCC.
Conclusion
This study establishes a foundation for categorizing lncRNA subclasses, which may contribute to understand tumor ontogeny and help predicting patients' outcome in ccRCC.
Keywords: ccRCC, Expression profiling, Long non‐coding RNA, RNA‐Seq, Genomic aberrations, Histone markers
Highlights
lncRNAs expression profiles of 475 TCGA primary clear cell renal cell carcinomas.
lncRNAs profiles establish four subtypes of ccRCC having clinical relevance.
Interplay between lncRNAs and PRC2 was observed in cluster C2.
lncRNAs display the potential in identifying cells of different origin of RCC.
1. Introduction
Renal cell carcinoma (RCC) accounts for nearly 65,000 cancer cases per year in the United States, and is the eighth highest cause of cancer mortality (Siegel et al., 2013). RCC encompasses a large spectrum of tumors that are thought to arise from different cell types in the nephron (Shen et al., 2005). The underlying theory is that clear cell RCC (ccRCC) as well as papillary RCC are derived from the proximal tubules, whereas chromophobe RCC and renal oncocytomas are derived from the intercalated cells of the distal nephron (Shen et al., 2005; Kuehn et al., 2007; Oosterwijk et al., 2011). Several single biomarkers have been described to distinguish between cancer cells arising from the proximal versus the distal tubules (Kuehn et al., 2007; Baer et al., 2006; Thomson and Aronson, 1999); however, little is known about the genome‐wide differences between them. Although kidney‐specific cadherin (Ksp‐cad) is supposedly a specific membrane‐associated cell adhesion glycoprotein that is expressed by epithelial cells in the distal tubules and is associated with the origin of renal oncocytomas and the chromophobe RCC subtype, 17–30% of ccRCC samples have displayed Ksp‐cad staining (Shen et al., 2005; Kuehn et al., 2007), which raises questions about the putative cell of origin of RCC in these variations of the disease.
ccRCC represents the most frequent histological subtype of RCC (∼85%) and displays both intra‐tumoral and inter‐tumoral heterogeneity (Gerlinger et al., 2012). Although this heterogeneity has been recognized by pathologists for a long time, recent advances in genomics have helped to decipher distinct, clinically relevant molecular subgroups. At the transcriptomic level, ccRCCs are divided into four stable subsets, with different patterns of somatic mutations and distinct outcomes (Cancer Genome Atlas Research N, 2013). In addition, next‐generation sequencing has expanded our understanding of the spectrum of somatic mutations in ccRCC, which focused historically on the von Hippel–Lindau (VHL) gene. In particular, the discovery of frequent mutations in chromatin remodeling genes has shed light on a key role of epigenetic deregulation in ccRCC oncogenesis (Pena‐Llopis et al., 2012; Varela et al., 2011; Dalgliesh et al., 2010; van Haaften et al., 2009).
At the cytogenetic level, 91% of ccRCCs display 3p deletion. Interestingly, 3p comprises the four most frequently mutated genes in ccRCC: VHL, PBRM1, BAP1 and SETD2 (Cancer Genome Atlas Research N, 2013). Meanwhile, it remains undetermined whether the subgroup of ccRCC without 3p loss arises from a different cell, or corresponds to a genetic variant of ccRCC.
As compared to genetic alterations, dysregulation of epigenetic regulatory networks remains poorly understood in ccRCC. Epigenetic regulation can occur via DNA methylation and histone modification. In addition, several long non‐coding RNAs (lncRNAs), which represent a subset of RNA longer than 200 base‐pairs, have been recently found to modify chromatin and thus act as broad epigenetic regulators (Lee, 2012). This is the case for the lncRNA HOTAIR, which is overexpressed in breast cancer and promotes cancer metastasis through genome‐wide re‐targeting of the polycomb repressive complex 2 (PRC2) (Gupta et al., 2010). Importantly, lncRNAs display more tissue‐specific expression patterns than mRNA and therefore may be used to better identify the cell of origin (Derrien et al., 2012). Furthermore, more than 20% of lncRNAs are bound by the PRC2 and other chromatin modifiers (Khalil et al., 2009). However, to our knowledge, the role of lncRNAs in ccRCC remains poorly understood and is limited to a few samples that were analyzed by microarrays (Yu et al., 2012).
Thus, the aim of our study was threefold. First, we sought to comprehensively describe the portrait of overexpressed lncRNAs in a large cohort of fully annotated ccRCC samples. Second, we investigated whether the classification of lncRNAs into subclasses uncovers distinct ccRCC subtypes with clinical relevance from one side and whether it correlates with The Cancer Genome Atlas (TCGA) transcriptome classification on the other side. Third, we assessed correlations between lncRNAs and genetic aberrations. As a result, we established a lncRNA subtype classification of ccRCC that defines genetically distinct ccRCC subclasses and paves the way for a better understanding of the kidney cell of origin and tumor progression in ccRCC.
2. Results
2.1. Expressed long non‐coding RNA in clear cell renal cell carcinoma
We performed a genomic analysis of GENCODE lncRNAs using RNA‐Seq of 475 primary ccRCC samples fully annotated from the TCGA project (Supplementary Table S1). Using stringent criteria (RPKM ≥1 in at least 10% of ccRCC samples), we identified 1934 expressed lncRNAs that we believe represent the spectrum of functional lncRNA in renal cancer (Supplementary Table S2). Furthermore, as the majority of lncRNAs are cis‐acting (Derrien et al., 2012), we identified their neighboring genes (Supplementary Table S2). As expected, we discovered the expression of several lncRNAs known to be expressed in ccRCC, as is the case for H19 and GAS5 lncRNAs (Qiao et al., 2013). We also unraveled the expression of lncRNAs not previously associated with ccRCC. An example of this is MALAT1 lncRNA, which fuses to the TFEB gene in a rare type of RCC, namely t(6; 11) (Davis et al., 2003).
2.2. Transcriptional and epigenetic regulations of lncRNAs
The expression of 1057 (54.6%) lncRNAs showed a strong, positive correlation (r ≥ 0.33) with the mRNA expression of their neighboring genes, while only 13 (0.7%) lncRNAs showed a strong, negative correlation (Supplementary Table S2). Of the latter, 2 lncRNAs, AC006159.3 and AC006159.4, were located in the vicinity of the CAV1 gene, which was previously associated with poor outcome in ccRCC (Supplementary Figure S1) (Campbell et al., 2013). To analyze the epigenetic regulation of those lncRNAs, we sub‐classified them according to their chromatin status in normal kidney tissue, defined by relative levels of histone H3K4me3 (active mark), H3K36me3 (active mark) and H3K27me3 (repressive mark). Overall, 844 (43.6%) lncRNAs were marked by H3K4me3 in normal kidney tissue, suggesting that those lncRNAs may arise from promoter‐associated elements (Marques et al., 2013). Conversely, as few as 81 (4.2%) and 182 (9.4%) lncRNAs were marked by H3K36me3 and H3K27me3, respectively. Interestingly, 43% of lncRNAs, 49% of antisense lncRNAs and 47% of processed transcript lncRNAs were marked by H3K4me3 as compared to 13% and 8% of sense intronic and overlapping RNAs, respectively. Thus, we conclude that regulation of those lncRNAs may differ according to their subtypes.
To understand the functional relevance of expressed lncRNAs in ccRCC, we used GREAT, which assigns biological associations to those lncRNAs by analyzing the annotations of the nearby genes (McLean et al., 2010). As a result, we identified 2779 neighboring genes, many of which were related to the activation of hypoxia gene sets. Particularly interesting in this setting is the enrichment for the hypoxia‐inducible transcription factor (HIF‐1alpha) (P = 1.6 × 10⁻⁵, one‐sided Fisher's exact test) and oxygen homeostasis regulation of HIF‐1alpha (P = 1.1 × 10⁻⁵) networks. In addition, we identified enrichment of genes involved in telomerase regulation (P = 9.5 × 10⁻⁷), FoxO family signaling (P = 1.2 × 10⁻³) and the ATF‐2 transcription factor network (P = 3.8 × 10⁻⁴).
2.3. lncRNA subclasses categorize clear cell renal cell carcinomas
As lncRNA expression has been previously demonstrated to be more tissue‐specific than mRNA expression (Derrien et al., 2012; Mercer et al., 2008; Ramos et al., 2013), we performed lncRNA subtype classification of ccRCC. Unsupervised consensus clustering revealed four robust molecular subclasses (Figure 1 and Supplementary Table S3); those were further confirmed using principal component analysis (not shown). This lncRNA‐based classification was highly concordant with the 4 TCGA mRNA‐based subgroups (Pearson's Chi‐squared test, P < 2.2e‐16) (Supplementary Table S4). Interestingly, cluster C4 was the smallest cluster, composed of 37 (7.8%) tumors, whereas clusters C1, C2 and C3 were composed of 139 (29.3%), 111 (23.4%) and 188 (39.6%) tumors, respectively. Of note, cluster C4 was highly enriched for MiTF/TFE translocation renal cell carcinomas (TRCC) as it comprises 6 out of 8 cases included in the TCGA dataset, highly suggesting biological relevance for this cluster.
Figure 1.
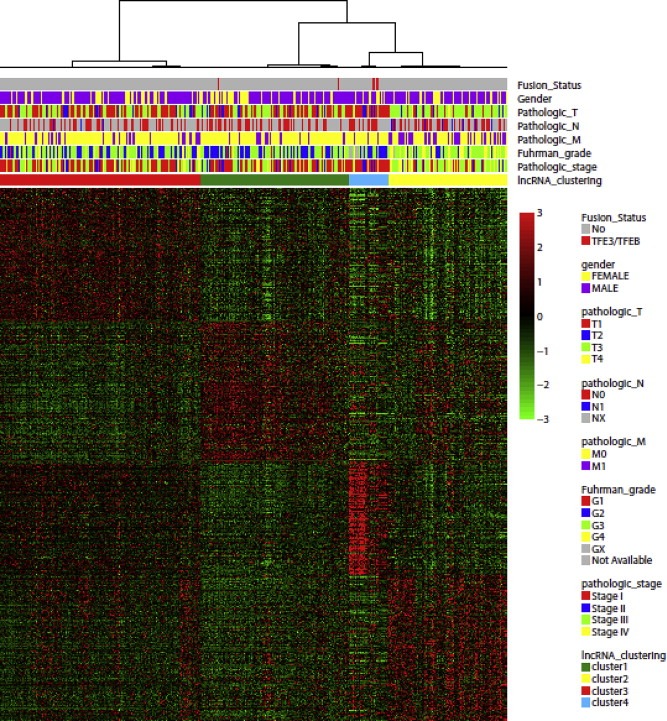
Unsupervised consensus clustering of long non‐coding RNA showing four subclasses of clear cell renal cell carcinoma associated with different clinicopathological features.
To identify pathways related to each subclass, we used GREAT to define cis‐acting lncRNA (neighboring) genes. Using a lncRNA fold‐change ≥2 and a false discovery rate (FDR) <0.05 as criteria, we were able to identify a set of overexpressed lncRNAs in each of the four lncRNA‐based clusters. Pathway analysis of the overexpressed lncRNAs in each lncRNA‐based cluster by GREAT did not predict enrichment for pathways in clusters C1 and C3; whereas it identified cluster C2 as being enriched for genes whose expression peaked periodically in the G2/M cell cycle phase, suggesting a high proliferation rate in this subclass (P = 9 × 10⁻⁵; FDR = 0.002). Interestingly, GREAT revealed that lncRNAs differentially expressed between cluster C4 and the remaining clusters were enriched for pathways belonging to the early distal tubules (P = 7.7 × 10⁻⁶; FDR = 0.008), which highly suggested a different cell of origin. The 12 candidate genes belonging to the distal tubule signature: ALDH1L1, CCND1, CLIC6, FOXI1, HNF1B, ID2, LHX1, POU3F3, RNF186, SALL1, SLC6A13 and SPP2. As expected, the expression of those genes differed greatly between cluster C4 and the other clusters. For instance, FOXI1 (FC = 1151.1, FDR = 5.6 × 10⁻³¹) and LHX1 (FC = 21.2, FDR = 1.81 × 10⁻⁶) were overexpressed in cluster C4 (Figure 2A,B). This was paralleled by the overexpression of their cis‐acting lncRNAs CTB−27N1.1 and RP11−445F12.1, respectively (Figure 2A,B). Conversely, RNF186 (FC = 0.37, FDR = 0.018) and SLC6A13 (FC = 0.275, FDR = 7.9 × 10⁻⁸) were underexpressed in cluster C4, consistent with downregulation of their cis‐acting lncRNAs RP11−91K11.2 and RP11−283I3.4, respectively (Figure 2C,D). Importantly, those genes are master regulators of the development of either the proximal or distal tubules. For instance, mice lacking the forkhead transcription factor FOXI1 develop distal renal tubular acidosis due to altered cellular composition of the distal nephron epithelium (Blomqvist et al., 2004). LHX1 is expressed early in the intermediate mesoderm and is required for specification of the renal progenitor cells (Cirio et al., 2011). The GABA transporter SLC6A13 has been shown to be overexpressed at the basolateral membranes of proximal tubules in the renal cortex, but not in the distal tubules, consistent with its downregulation in cluster C4 (Zhou et al., 2012).
Figure 2.
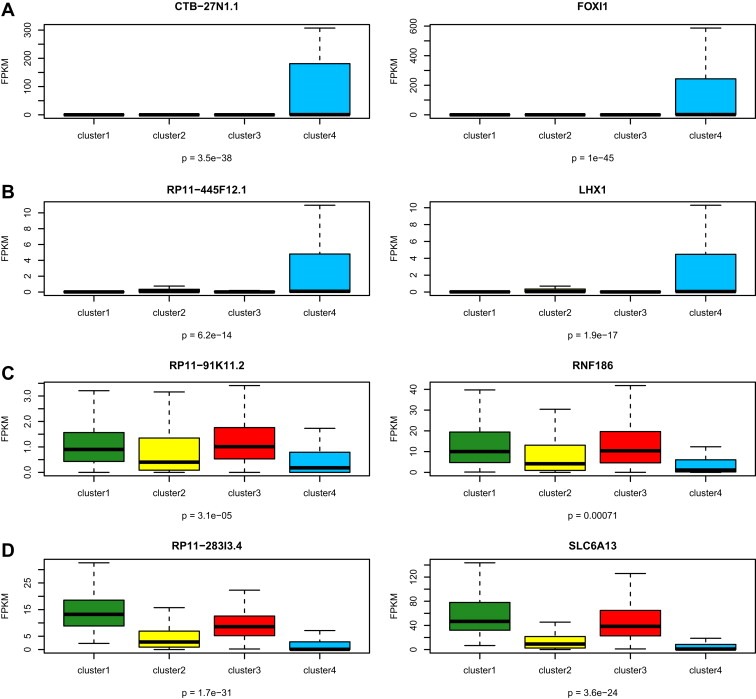
Box‐plots showing genes expressed differentially between cluster C4 and other clusters. A,B) Compared to the expression in the other clusters, overexpression of FOXI1 and LHX1 genes with the associated cis‐acting long non‐coding RNA in cluster C4. C,D) Compared to the expression in the other clusters, downregulated expression of RNF186 and SLC6A13 genes with the associated cis‐acting long non‐coding RNA in cluster C4. The p‐values in boxplot were calculated from one‐way ANOVA.
We then analyzed the expression of the usual markers for differentiating between tumors that arise in the distal tubules and those that arise in the proximal tubules: kidney‐specific cadherin (CDH16), E‐cadherin (CDH1), VIM and MME (also known as CD10) (Figure 4). As expected, we found a 3.1‐fold increase in the expression of CDH16 in cluster C4 as compared to other clusters (P = 5.5e‐11). Consistent with a distal cell of origin of ccRCC for the cluster C4 subtype, we also observed increased expression of CDH1 (FC = 3.8, FDR = 1.6 × 10⁻²³) from one side, and decreased expression of VIM (FC = 0.348, FDR = 7.6 × 10⁻⁶) and MME (FC = 0.41, FDR = 0.009) from the other side. Thus, we conclude that cells in cluster C4 may arise from the early distal tubules of the nephron.
Figure 4.
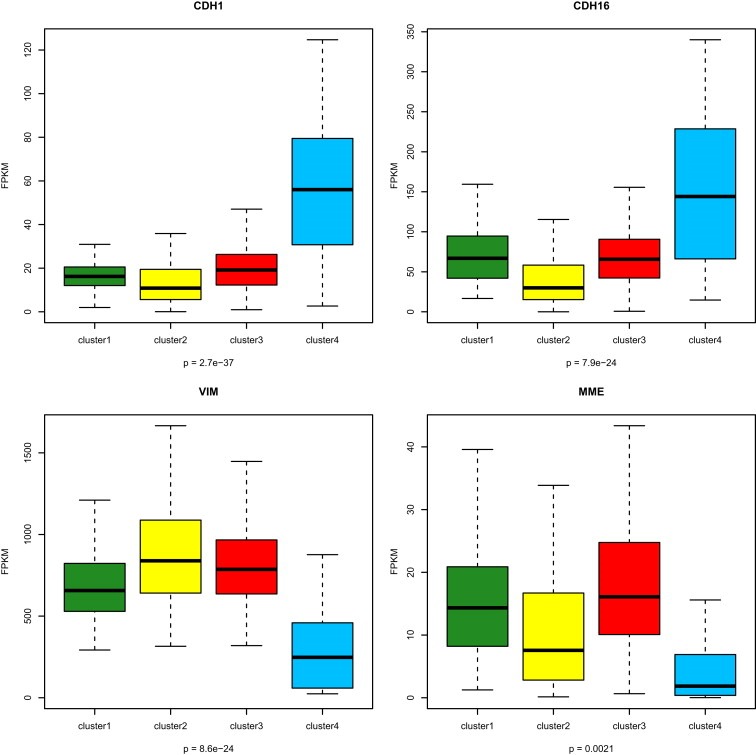
Box‐plots for expression of genes associated with renal lineage specificity and showing that cluster C4 is associated with CDH1 and CDH16 overexpression, and VIM and MME downregulated expression. The p‐values in boxplot were calculated from one‐way ANOVA.
2.4. Clinicopathological features of long non‐coding RNA subtype classification
We then considered whether clinicopathological features of ccRCC differed among the four lncRNA clusters. Interestingly, cluster C2 stood out as the most aggressive subgroup because it was composed of tumors with higher Fuhrman grades (P < 10−5), higher pathological size (P < 10e‐5), more frequent lymph node involvement (P < 0.001), higher metastasis rate (<0.0001) and higher TNM stage (P < 10−5) (Table 1). Furthermore, cluster C2 was associated with the worst overall survival time as compared to the other clusters (P = 2.1 × 10⁻¹⁰). This may be related to the enrichment of overexpressed lncRNAs related to the G2/M cell cycle phase pathway. Multivariate analysis showed that cluster C2 (P = 0.02) as well as pathological TNM stages III (P = 3.2e‐4) and IV (P = 5.3e‐11) were the factors independently associated with poor overall survival (OS). While patients with tumors of clusters C3 and C4 did not reach the median OS time, patients with tumors of clusters C1 and C2 had median OS of 3.33 and 7.64 years, respectively (Figure 3). This suggests the importance of lncRNAs in predicting patient outcome. Of note, lncRNA classification had more power for prediction than Fuhrman grade, as we did not find pathological grade to be independently associated with patient outcomes.
Table 1.
Correlation between long non‐coding RNA subclasses and clinicopathological features (one‐sided Fisher's exact test).
| Feature | Cluster 1 (n = 139) | Cluster 2 (n = 111) | Cluster 3 (n = 188) | Cluster 4 (n = 37) | P value |
|---|---|---|---|---|---|
| Median age (years) (Range) | 60 (34–90) | 62 (26–85) | 61 (29–90) | 59 (38–79) | 0.64 |
| Gender | |||||
| Male | 85 | 77 | 125 | 24 | 0.58 |
| Female | 54 | 34 | 63 | 13 | |
| Laterality | |||||
| Right | 69 | 54 | 109 | 21 | 0.31 |
| Left | 70 | 57 | 79 | 16 | |
| Histologic grade | |||||
| G1 | 4 | 0 | 4 | 0 | <10e‐5 |
| G2 | 71 | 21 | 88 | 21 | |
| G3 | 58 | 48 | 71 | 10 | |
| G4 | 6 | 41 | 25 | 1 | |
| Pathological TNM stage | |||||
| I | 82 | 22 | 101 | 27 | <10e‐5 |
| II | 12 | 10 | 19 | 6 | |
| III | 32 | 42 | 42 | 1 | |
| IV | 13 | 37 | 26 | 3 | |
| Primary tumor pathologic spread | |||||
| T1 | 82 | 24 | 104 | 27 | <0.0001 |
| T2 | 14 | 13 | 25 | 6 | |
| T3 | 42 | 66 | 58 | 3 | |
| T4 | 1 | 8 | 1 | 1 | |
| Lymph node status | |||||
| N0 | 67 | 58 | 80 | 21 | 0.001 |
| N1 | 0 | 11 | 6 | 0 | |
| Metastasis | |||||
| M0 | 125 | 75 | 163 | 34 | <0.0001 |
| M1 | 14 | 36 | 25 | 3 | |
Figure 3.
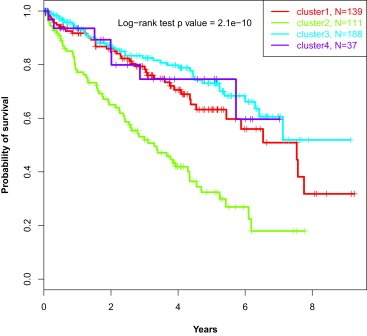
Kaplan–Meier curves showing that patients belonging to C2 cluster display the worst overall survival as compared to those belonging to other clusters.
2.5. Correlation between subclass categories and copy number alterations
We then considered whether lncRNA subclasses were associated with different cytogenetic alterations (Figure 5A). Interestingly, cluster C4 (n = 37; 7.8%) which bears a distinct ontogeny, stands out as having a distinct cluster compared to the others (Figure 5A). First, cluster C4 was almost devoid of the alterations frequently seen in ccRCC, such as 3p loss and 5q gain (Table 2). Second, consistent with the absence of 3p loss, and relative to other clusters, gene set enrichment analysis (GSEA) showed overexpressed genes located within the chr3p25 region, which contains the von Hippel–Lindau (VHL) tumor suppressor gene (P < 0.0001) (Figure 5B), as well as the downregulation of HIF1A and HIF2A targets (P < 0.0001) (Figure 5C). Third, cluster C4 was enriched for deletions of regions chr1p31.1 (47.1%) and chr1p36.23 (44.1%), which represent rare events in ccRCC (Figure 5A). Fourth, cluster C4 was enriched for 17q24.3 (20.6%) gain, which we recently demonstrated as a frequent alteration in MiTF/TFE translocation RCC (Malouf et al., 2013). Interestingly, Chr1p36.23 contains the following 3 lncRNAs, ERRFI1‐IT1, RP11‐431K24.3 and ENO1‐IT1, which were underexpressed, consistent with regional chromosomal deletion (Figure 6A). Conversely, we did not identify lncRNAs significantly overexpressed in region 17q24.3 or underexpressed in region chr1p31.1.
Figure 5.
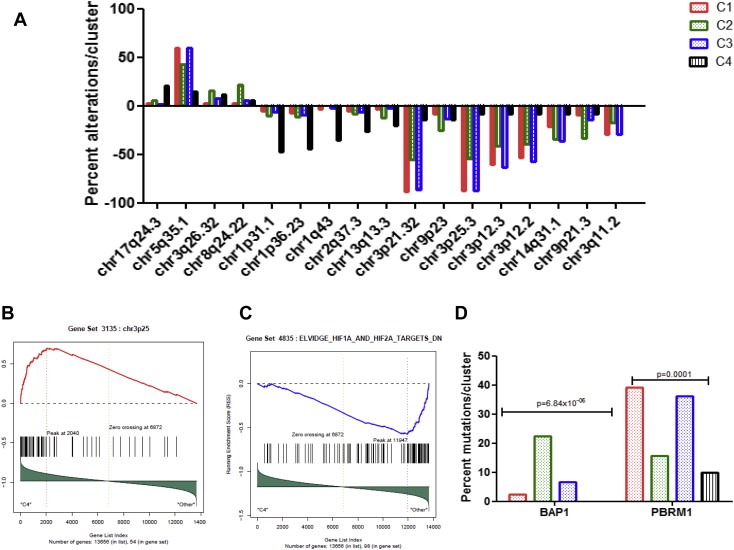
Comparisons among the 4 long non‐coding RNA clusters. A) Percent alterations of the genomic regions that are differentially altered between the 4 long non‐coding RNA clusters. B) Gene set enrichment analysis (GSEA) showing overexpression of genes belonging to 3p25 region in cluster C4 as compared to others. C) GSEA showing downregulation of genes belonging to HIF1A and HIF2A targets in cluster C4 as compared to others. D) Percent mutations of BAP1 and PBRM1 chromatin remodeling genes within the 4 long non‐coding RNA clusters.
Table 2.
Correlation between long non‐coding RNA subclasses and genomic aberrations (one‐sided Fisher's exact test).
| Aberration | Cluster 1 (n = 138) | Cluster 2 (n = 110) | Cluster 3 (n = 186) | Cluster 4 (n = 34) | P value |
|---|---|---|---|---|---|
| chr3p25.3_Loss | 121 (87.7%) | 60 (54.5%) | 163 (87.6%) | 3 (8.8%) | 3.98E‐26 |
| chr3p21.32_Loss | 122 (88.4%) | 61 (55.4%) | 161 (86.6%) | 5 (14.7%) | 8.78E‐23 |
| chr1q43_Loss | 5 (3.6%) | 0 | 5 (2.7%) | 12 (35.3%) | 4.60E‐10 |
| chr3p12.3_Loss | 83 (60.1%) | 46 (41.8%) | 117 (62.9%) | 3 (8.8%) | 8.16E‐10 |
| chr1p31.1_Loss | 7 (5.1%) | 11 (10.0%) | 12 (6.4%) | 16 (47.1%) | 1.33E‐08 |
| chr3p12.2_Loss | 74 (53.6%) | 43 (39.1%) | 107 (57.5) | 3 (8.8%) | 8.51E‐08 |
| chr5q35.1_Gain | 83 (60.1%) | 47 (42.7%) | 111 (59.7%) | 5 (14.7%) | 5.14E‐07 |
| chr8q24.22_Gain | 4 (2.9%) | 24 (21.8%) | 11 (5.9%) | 2 (5.9%) | 3.89E‐06 |
| chr1p36.23_Loss | 10 (7.2%) | 12 (10.9%) | 17 (9.1%) | 15 (44.1%) | 3.90E‐06 |
| chr9p21.3_Loss | 13 (9.4%) | 37 (33.6%) | 26 (14%) | 3 (8.8%) | 4.84E‐06 |
| chr13q13.3_Loss | 5 (3.6%) | 14 (12.7%) | 4 (2.1%) | 7 (20.6%) | 2.00E‐05 |
| chr3q11.2_Loss | 41 (29.7%) | 19 (17.3%) | 54 (29%) | 0 | 3.93E‐05 |
| chr17q24.3_Gain | 4 (2.9%) | 6 (5.4%) | 4 (2.1%) | 7 (20.6%) | 0.000579 |
| chr14q31.1_Loss | 30 (21.7%) | 38 (34.5%) | 67 (36%) | 3 (8.8%) | 0.000656 |
| chr9p23_Loss | 12 (8.7%) | 28 (25.4%) | 24 (12.9%) | 5 (14.7%) | 0.003035 |
| chr2q37.3_Loss | 7 (5.1%) | 9 (8.2%) | 12 (6.4%) | 9 (26.5%) | 0.00306 |
| chr3q26.32_Gain | 4 (2.9%) | 17 (15.4%) | 15 (8.1%) | 4 (11.8%) | 0.003111 |
Figure 6.
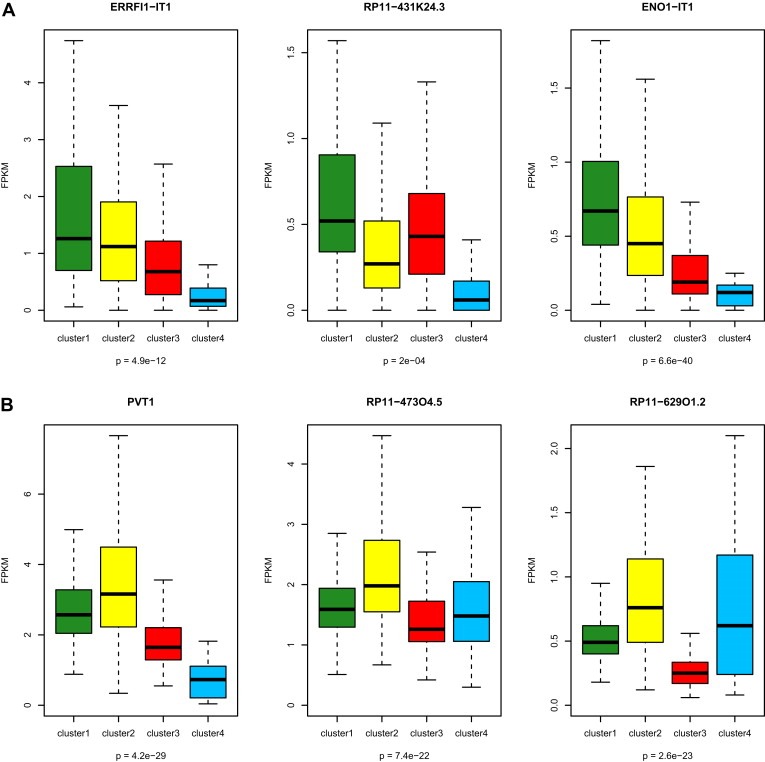
Box‐plots showing alterations associated with the 4 subclasses of long non‐coding RNA (lncRNA) in clear cell renal cell carcinoma. A) Three lncRNAs belonging to 1p36.23 and which are underexpressed in cluster C4 relative to the other clusters. B) Three lncRNAs belonging to 8q24.22 and which are overexpressed in cluster C2 relative to the other clusters. The p‐values in boxplot were calculated from one‐way ANOVA.
In contrast, cluster C2 was enriched for both 9p21.3/CDKN2A and 9p23 deletions, which were previously demonstrated to be independently associated with poor outcome in ccRCC (Klatte et al., 2009). This may explain tumor aggressiveness through interplay between lncRNAs and genetic aberrations. Furthermore, cluster C2 was also enriched for chr8q24.22 gain, which contains the 3 following overexpressed lncRNAs, PVT1, RP11‐47304.5 and RP11‐62901.2 (Figure 6B). Consistent with GREAT analysis, GSEA of mRNAs differentially expressed between cluster C2 and other clusters revealed an enrichment for the mitotic cell cycle checkpoint pathway (P = 0.02). Finally, EZH2, which is part of the PRC2 complex, was overexpressed in cluster C2 (FC = 1.7; FDR = 0.03), suggesting an interplay between lncRNAs and the Polycomb complex (Supplementary Figure S2).
2.6. Correlation between subclass categories and somatic mutations
We then considered whether lncRNA subclasses were differentially enriched for somatic mutations. For this assessment, we analyzed exome‐sequencing data for the 395 ccRCC samples that were available. Interestingly, we found only the two chromatin remodeling genes, BAP1 and PBRM1, to be highly significantly associated with lncRNA‐based clustering. The BAP1 mutation was present in 22.5% of the cases in cluster C2 as compared to 2.5%, 6.75% and 0% of the cases in clusters C1, C3 and C4, respectively (P = 6.8 × 10⁻⁶) (Figure 5D). Conversely, the PBRM1 mutation was highly enriched in clusters C1 (39.2%) and C3 (36.2%) as compared to clusters C2 (15.7%) and C4 (10%) (P = 0.0001) (Figure 5D).
2.7. Cluster C4 contains mixture of MITF/TFE translocation RCC, chromophobe RCC and clear cell papillary RCC
Consistent with a recent report showing that a subset of ccRCC belonging to the TCGA dataset might be misclassified (Zhao et al., 2013), we explored the hypothesis that C4 cluster might include misdiagnosed RCC which originate from distal tubules; to do so, we analyzed copy‐number data for the entire ccRCC cohort. Overall, 468 samples out of the 475 samples have copy number alterations available, including 34 out of 37 samples in C4 cluster. Using loss of one copy of the entire chromosome, for most or all of chromosomes 1, 2, 6, 10, 13, and 17 as a defining karyotype for chromophobe (chRCC) seen in 86% of TCGA dataset (not shown), we identified 11 chRCC cases. Of note, all of them were located in cluster C4 (Supplementary Table S3). Thus, we conclude that a subset of C4 cluster is composed of chRCC misdiagnosed as ccRCC, highlighting the power of lncRNA in defining distal nephron cell of origins. This is consistent with results using different approach to analyze ccRCC TCGA dataset through tumor‐specific alternative splicing (Zhao et al., 2013); in this latest study, a subset of 22 ccRCC samples were misdiagnosed and tumor histology reexamination by expert pathologists reassigned them to clear cell papillary RCC (ccpRCC) or chRCC. Of note, all those 22 samples belong to our C4 lncRNA‐based cluster (Supplementary Table S3). Puzzlingly, one sample with virtual karyotype of chRCC contained in addition a MITF/TFE translocation. We thus conclude that C4 cluster is composed of a mixture of TRCC, ccpRCC and chRCC which are likely to arise from distal cell of the nephrons.
3. Discussion
This study identified the portrait of functional long non‐coding RNA in ccRCC and establishes what the first genome‐wide classification of lncRNA is to our knowledge in a large cohort of a very well annotated ccRCC. This classification identified four molecular subclasses of clear cell renal cell cancer that have clinical relevance, establishing a foundation for future studies on ccRCC ontogeny and aggressiveness. Interestingly, the 4 clusters we obtained correlated well with TCGA transcriptome classification and strengthen the relevance of previous reported results by reproducing the clusters with a different approach.
Regarding RCC ontogeny, our analysis unraveled a distinct subgroup of ccRCC (cluster C4) that encompasses less than 10% of ccRCC. We found cluster C4 to be unique in many regards. First, cluster C4 was characterized by a gene expression signature of the distal tubules of the nephron; furthermore, it showed gene expression changes of key ontogeny genes used in the clinic to distinguish between tumors arising from the proximal versus the distal tubules. These genes include VIM, MME and CDH16. Second, cluster C4 was enriched for MiTF/TFE translocation, which corresponds to a rare subtype of RCC characterized by translocations of TFE3 and TFEB genes, and which displays a mixed morphology of clear cell and papillary RCC (Malouf et al., 2013). Third, cluster C4 has distinct copy number alterations, with frequent 1p31.1 and 1p36.23 deletions, as well as 17q24.3 gains, which are often associated with TRCC that arises in adults (Malouf et al., 2013). Fourth, reexaminations of copy‐number data as well as tumor histology by pathologists reveal misclassified tumors within C4 cluster including chRCC and ccpRCC. This indicates that TRCC and ccpRCC might arise from distal tubules challenging the current dogma about cell of origins of those rare kidney subtypes. We also demonstrated the downregulation of 3 lncRNAs belonging to 1p36.23 deletion; we thus speculate that those lncRNAs may represent key markers of cell ontogeny of tumors belonging to the C4 cluster. We thus conclude that cluster C4 which displays the hallmark signature of nephron distal cell of origin is formed from misclassification of known immunohistochemically identifiable RCC subtypes.
Regarding RCC aggressiveness, we identified that cluster C2 was often associated with tumors of higher pathological grade and TNM stage. Furthermore, cluster C2 remains independently associated with poor overall survival, even after adjusting for pathological grade and TNM stage. Of note, Fuhrman grade was not retained in our multivariate analysis, suggesting that lncRNA classification may be a better predictor of patient outcome than the pathological grade of the tumor. In addition, cluster C2 was often associated with 9p loss, which is a classical deletion independently associated with poor outcome in ccRCC (Klatte et al., 2009). In addition, cluster C2 was enriched for frequent mutations in the chromatin remodeling gene BAP1, in contrast with PBRM1 mutations, which were enriched in clusters C1 and C3. We conclude that BAP1 and PBRM1 regulate a different long non coding RNA programs consistent with a recent report demonstrating that mutations of those genes lead to different transcriptional profiles and that BAP1 loss were associated with higher tumor grade (Pena‐Llopis et al., 2012).
Finally, the histone‐lysine N‐methyltransferase EZH2 was overexpressed in cluster C2, which is consistent with activation of the polycomb repressive complex 2 (PRC2), and highly suggestive of interplay between lncRNAs and the polycomb complex, as demonstrated previously (Gupta et al., 2010).
Another important point is the enrichment of lncRNA located in the vicinity of key genes involved in hypoxia, leading to the activation of vascular endothelial growth factor (VEGF) pathways. Indeed, in the last decade, several VEGF inhibitors have been approved for the treatment of ccRCC (Rini et al., 2009). We speculate that disruption of the lncRNAs that drive the hypoxia pathway may represent a future method of treatment for ccRCC. However, the absence of 3p loss in cluster C4, which we found to be consistent with the downregulation of the HIF1A and HIF2A pathways, argue against the efficacy of VEGF‐targeted agents. In the absence of clinical data regarding the sequential treatments received by the patients, it is impossible to answer this question. Future prospective studies are therefore needed to determine personalized treatments for those patients.
The limitation of our study is the absence of a validation cohort allowing us to confirm the 4 subgroups classification of ccRCC. However, it is important to strengthen the fact that the 4 subgroups we identified were discovered through unsupervised clustering.
To our knowledge, this is the first genome‐wide study of the genetic architecture of lncRNA‐based classification in ccRCC. We established four subclasses of ccRCC through lncRNA‐based clustering; those clusters were highly concordant with TCGA classification from one side and associated with different genomic aberrations in the other side. In addition, we identified cluster C4 as a mixture of misdiagnosed ccRCC encompassing TRCC, chRCC and ccpRCC samples which are likely to arise from distal tubules. Furthermore, we demonstrate the interest of lncRNA which does highlight the potential for its use in identifying cells of different origin, acting as an adjunct to the use of copy‐number and splicing analysis to identify misdiagnosed samples. Finally, we expand on what is currently known from the use of next generation sequencing in RCC by describing lncRNA expression and associated expression changes in nearby genes. Our finding may provide a foundation for predicting patient prognosis and defining optimal treatments for patients with ccRCC.
4. Materials and methods
4.1. The Cancer Genome Atlas (TCGA) data
Clear cell renal cell carcinoma (KIRC) RNA‐Seq data (BAM files) and their related clinical data were obtained from Cancer Genomics Hub (CGHub, https://cghub.ucsc.edu/) and TCGA Data Portal (https://tcga‐data.nci.nih.gov/tcga/). The paired‐end FASTQ files for each sample were extracted from BAM files using bam2fastq (http://www.hudsonalpha.org/gsl/information/software/bam2fastq). Both copy number alterations and somatic mutations were downloaded from The Broad GDAC Firehose http://gdac.broadinstitute.org/.
4.2. ChIP‐Seq data
ChIP‐Seq peak data for histone marks H3K4me3, H3K36me3, and H3K27me3 in normal kidney cell line (HRE) was obtained from UCSC ENCODE Histone Modification Tracks (http://genome.ucsc.edu/cgi‐bin/hgTrackUi?hgsid=331813161&c=chr21&g=wgEncodeHistoneSuper). To examine the histone modification profiles of lncRNA genes, we analyzed the promoter regions of lncRNA genes for overlap with histone mark enrichment peaks. Specifically, the lncRNA was defined to be marked/associated with a specific histone mark if the peak from ChIP‐Seq data for a specific histone mark is located within ±5 kb from TSS (around promoter regions) for the lncRNA.
4.3. Mapping/alignment
The raw paired‐end (PE) reads in FASTQ format were then aligned to the human reference genome, GRCh37/hg19, using MOSAIK alignment software (Lee et al., 2014). MOSAIK works with PE reads from Illumina HiSeq 2000, and uses both a hashing scheme and the Smith–Waterman algorithm to produce gapped optimal alignments and to map exon junction‐spanning reads with a local alignment option for RNA‐seq. The resulting alignments were then saved as a standard BAM file.
We then counted the mapped reads in genomic features such as genes (mRNAs and lncRNAs) annotated in GENCODE15 to generate the raw counts for each gene using the HTSeq‐count script distributed with the HTSeq package. We chose the “union” mode of HTSeq to mask the overlapped regions between mRNA and lncRNA to overcome the issue of non‐strand‐specific RNA sequencing KIT (TruSeq) in TCGA data.
4.4. Count data normalization
Raw read count data were normalized across samples with DESeq_1.10.1 (Anders and Huber, 2010). Specifically, DESeq first estimated the effective library size, which is also called size factor, by dividing each column by the geometric means of the rows given a matrix or data frame of raw count data. Then, the median of these ratios (skipping the genes with a geometric mean of zero) was used as the size factor for the column. With the estimation of size factors, DESeq then divided each column of the count table by the size factor for that column. That brought the count values to a common scale, making them comparable across samples. Furthermore, we transformed the count data by the Variance‐Stabilizing Transformation function provided in the DESeq package. With this function, the standard deviation of each gene was roughly constant regardless of the gene expression magnitude.
4.5. FPKM calculation
In our analysis, FPKM was also calculated as the number of fragments per kilobase of non‐overlapped exon per million fragments mapped. Since the raw count data per gene were generated with the “union” mode in HTSeq, whereby the reads mapped to the overlapping regions between mRNA and lncRNA were not counted, the exon sequences corresponding to the overlap between mRNA and lncRNA were excluded when we calculated the gene length for both mRNA and lncRNA.
4.6. Low expression filtering
To reduce noise, we kept only mRNAs or lncRNAs with FPKM equal to or above 1 in at least 10% of samples for downstream analysis.
4.7. Detection of differential mRNA and lncRNA expressions
All statistical analyses were performed using the R and R‐Bioconductor statistical programming environment. We identified differentially expressed mRNAs and lncRNAs with DESeq, using the standard comparison mode between two experimental conditions. P values were adjusted for multiple testing with the embedded Benjamini–Hochberg procedure in DESeq.
4.8. Consensus clustering by lncRNAs
To assess the stability of the discovered clusters, we performed consensus clustering. Using the resampled data, we conducted 500 runs of hierarchical clustering. For each run, 80% of the samples and 80% of the lncRNAs were randomly chosen. The distance measurement was set as the Pearson correlation, and linkage function was set as “Ward”. Based on the 500 runs, a consensus was obtained by taking the average over the connectivity matrices of every perturbed dataset. Then we carried out hierarchical clustering with the consensus matrix as a similarity matrix, with “Euclidean” as the distance measurement and “Ward” as the linkage function. We also calculated the Bayesian information criterion to detect the number of clusters.
Disclosure of conflicts of interest
The authors disclose no conflict of interest.
Authors' contribution
Conception and design: G.G.M. and X.S.
Development of methodology: J.Z., Y.Y, Y.C., X.S.
Analysis and interpretation of data (e.g., statistical analysis, biostatistics, computational analysis): G.G.M., J.Z., Y.Y, Y.C., E.J.T., N.M.T., X.S.
Drafting of the manuscript: G.G.M., J.Z., Y.Y, E.C., M.R., O.S., Y.C., N.M.T., J.N.W., V.V., D.K, J.P.S. and X.S.
Study supervision: D.K, J.P.S. and X.S.
Supporting information
The following are the supplementary data related to this article:
Supplementary Table S1: Clinical annotations of the 475 clear‐cell renal cell carcinoma analyzed.
Supplementary Table S2: List of long non coding RNA expressed in clear‐cell renal cell carcinoma and the correlation of their expression with the neighboring genes expression.
Supplementary Table S3: Cluster assignment of the 475 clear cell renal cell carcinoma (RCC) samples including the annotation of cases classified by virtual karyotyping and/or pathological review as chromophobe RCC or clear cell papillary RCC.
Supplementary Table S4: The concordance between lncRNA‐based clusters and TCGA mRNA‐based clusters.
Supplementary Figure S1: Correlation plots between CAV1 gene and the two cis‐acting long non coding RNA AC006159.3 and AC006159.4.
Supplementary Figure S2: Box‐plot for EZH2 gene expression across long non coding RNA clusters.
Acknowledgments
This work was supported in part by National Center for Research Resources grant UL1TR000371 (X.S.), The University of Texas MD Anderson Cancer Center CCSG P30 CA016672 (X.S.), Leukemia SPORE P50 CA100632 (X.S.), the Michael & Susan Dell Foundation (X.S.), and Fondation AVEC (G.G.M.). The author(s) acknowledge the MDACC High Performance Research Computing Center for computational resources in this paper. None of the authors has conflicts.
1.
Supplementary data related to this article can be found at http://dx.doi.org/10.1016/j.molonc.2014.07.007.
Malouf Gabriel G., Zhang Jianping, Yuan Ying, Compérat Eva, Rouprêt Morgan, Cussenot Olivier, Chen Yunxin, Thompson Erika J., Tannir Nizar M., Weinstein John N., Valero Vicente, Khayat David, Spano Jean-Philippe, Su Xiaoping, (2015), Characterization of long non-coding RNA transcriptome in clear-cell renal cell carcinoma by next-generation deep sequencing, Molecular Oncology, 9, doi: 10.1016/j.molonc.2014.07.007.
Contributor Information
Gabriel G. Malouf, Email: gabriel.malouf@psl.aphp.fr
Xiaoping Su, Email: xsu1@mdanderson.org.
References
- Anders, S. , Huber, W. , 2010. Differential expression analysis for sequence count data. Genome Biol. 11, R106 [DOI] [PMC free article] [PubMed] [Google Scholar]
- Baer, P.C. , Bereiter-Hahn, J. , Schubert, R. , Geiger, H. , 2006. Differentiation status of human renal proximal and distal tubular epithelial cells in vitro: differential expression of characteristic markers. Cells Tissues Organs. 184, 16–22. [DOI] [PubMed] [Google Scholar]
- Blomqvist, S.R. , 2004. Distal renal tubular acidosis in mice that lack the forkhead transcription factor foxi1. J. Clin. Invest. 113, 1560–1570. [DOI] [PMC free article] [PubMed] [Google Scholar]
- Campbell, L. , 2013. Caveolin-1 in renal cell carcinoma promotes tumour cell invasion, and in co-operation with pERK predicts metastases in patients with clinically confined disease. J. Transl Med. 11, 255 [DOI] [PMC free article] [PubMed] [Google Scholar]
- Cancer Genome Atlas Research N, 2013. Comprehensive molecular characterization of clear cell renal cell carcinoma. Nature. 499, 43–49. [DOI] [PMC free article] [PubMed] [Google Scholar]
- Cirio, M.C. , 2011. Lhx1 is required for specification of the renal progenitor cell field. PLoS One. 6, e18858 [DOI] [PMC free article] [PubMed] [Google Scholar]
- Dalgliesh, G.L. , 2010. Systematic sequencing of renal carcinoma reveals inactivation of histone modifying genes. Nature. 463, 360–363. [DOI] [PMC free article] [PubMed] [Google Scholar]
- Davis, I.J. , 2003. Cloning of an Alpha-TFEB fusion in renal tumors harboring the t(6;11)(p21;q13) chromosome translocation. Proc. Natl. Acad. Sci. U S A. 100, 6051–6056. [DOI] [PMC free article] [PubMed] [Google Scholar]
- Derrien, T. , 2012. The GENCODE v7 catalog of human long noncoding RNAs: analysis of their gene structure, evolution, and expression. Genome Res. 22, 1775–1789. [DOI] [PMC free article] [PubMed] [Google Scholar]
- Gerlinger, M. , 2012. Intratumor heterogeneity and branched evolution revealed by multiregion sequencing. N. Engl. J. Med. 366, 883–892. [DOI] [PMC free article] [PubMed] [Google Scholar]
- Gupta, R.A. , 2010. Long non-coding RNA HOTAIR reprograms chromatin state to promote cancer metastasis. Nature. 464, 1071–1076. [DOI] [PMC free article] [PubMed] [Google Scholar]
- Khalil, A.M. , 2009. Many human large intergenic noncoding RNAs associate with chromatin-modifying complexes and affect gene expression. Proc. Natl. Acad. Sci. U S A. 106, 11667–11672. [DOI] [PMC free article] [PubMed] [Google Scholar]
- Klatte, T. , 2009. Cytogenetic profile predicts prognosis of patients with clear cell renal cell carcinoma. J. Clin. Oncol. 27, 746–753. [DOI] [PubMed] [Google Scholar]
- Kuehn, A. , 2007. Expression analysis of kidney-specific cadherin in a wide spectrum of traditional and newly recognized renal epithelial neoplasms: diagnostic and histogenetic implications. Am. J. Surg. Pathol. 31, 1528–1533. [DOI] [PubMed] [Google Scholar]
- Lee, J.T. , 2012. Epigenetic regulation by long noncoding RNAs. Science. 338, 1435–1439. [DOI] [PubMed] [Google Scholar]
- Lee, W.-P. , 2014. MOSAIK: a hash-based algorithm for accurate next-generation sequencing short-read mapping. PLoS One. 9, (3) e90581 [DOI] [PMC free article] [PubMed] [Google Scholar]
- Malouf, G.G. , 2013. Genomic heterogeneity of translocation renal cell carcinoma. Clin. Cancer Res. 19, 4673–4684. [DOI] [PMC free article] [PubMed] [Google Scholar]
- Marques, A.C. , 2013. Chromatin signatures at transcriptional start sites separate two equally populated yet distinct classes of intergenic long noncoding RNAs. Genome Biol. 14, R131 [DOI] [PMC free article] [PubMed] [Google Scholar]
- McLean, C.Y. , 2010. GREAT improves functional interpretation of cis-regulatory regions. Nat. Biotechnol. 28, 495–501. [DOI] [PMC free article] [PubMed] [Google Scholar]
- Mercer, T.R. , Dinger, M.E. , Sunkin, S.M. , Mehler, M.F. , Mattick, J.S. , 2008. Specific expression of long noncoding RNAs in the mouse brain. Proc. Natl. Acad. Sci. U S A. 105, 716–721. [DOI] [PMC free article] [PubMed] [Google Scholar]
- Oosterwijk, E. , 2011. Basic research in kidney cancer. Eur. Urol. 60, 622–633. [DOI] [PMC free article] [PubMed] [Google Scholar]
- Pena-Llopis, S. , 2012. BAP1 loss defines a new class of renal cell carcinoma. Nat. Genet. 44, 751–759. [DOI] [PMC free article] [PubMed] [Google Scholar]
- Qiao, H.P. , Gao, W.S. , Huo, J.X. , Yang, Z.S. , 2013. Long non-coding RNA GAS5 functions as a tumor suppressor in renal cell carcinoma. Asian Pac. J. Cancer Prev. 14, 1077–1082. [DOI] [PubMed] [Google Scholar]
- Ramos, A.D. , 2013. Integration of genome-wide approaches identifies lncRNAs of adult neural stem cells and their progeny in vivo. Cell Stem Cell. 12, 616–628. [DOI] [PMC free article] [PubMed] [Google Scholar]
- Rini, B.I. , Campbell, S.C. , Escudier, B. , 2009. Renal cell carcinoma. Lancet. 373, 1119–1132. [DOI] [PubMed] [Google Scholar]
- Shen, S.S. , Krishna, B. , Chirala, R. , Amato, R.J. , Truong, L.D. , 2005. Kidney-specific cadherin, a specific marker for the distal portion of the nephron and related renal neoplasms. Mod. Pathol. 18, 933–940. [DOI] [PubMed] [Google Scholar]
- Siegel, R. , Naishadham, D. , Jemal, A. , 2013. Cancer statistics, 2013. CA Cancer J. Clin. 63, 11–30. [DOI] [PubMed] [Google Scholar]
- Thomson, R.B. , Aronson, P.S. , 1999. Immunolocalization of Ksp-cadherin in the adult and developing rabbit kidney. Am. J. Physiol. 277, F146–F156. [DOI] [PubMed] [Google Scholar]
- van Haaften, G. , 2009. Somatic mutations of the histone H3K27 demethylase gene UTX in human cancer. Nat. Genet. 41, 521–523. [DOI] [PMC free article] [PubMed] [Google Scholar]
- Varela, I. , 2011. Exome sequencing identifies frequent mutation of the SWI/SNF complex gene PBRM1 in renal carcinoma. Nature. 469, 539–542. [DOI] [PMC free article] [PubMed] [Google Scholar]
- Yu, G. , 2012. LncRNAs expression signatures of renal clear cell carcinoma revealed by microarray. PLoS One. 7, e42377 [DOI] [PMC free article] [PubMed] [Google Scholar]
- Zhao, Q. , 2013. Tumor-specific isoform switch of the fibroblast growth factor receptor 2 underlies the mesenchymal and malignant phenotypes of clear cell renal cell carcinomas. Clin. Cancer Res. 19, 2460–2472. [DOI] [PMC free article] [PubMed] [Google Scholar]
- Zhou, Y. , 2012. Deletion of the gamma-aminobutyric acid transporter 2 (GAT2 and SLC6A13) gene in mice leads to changes in liver and brain taurine contents. J. Biol. Chem. 287, 35733–35746. [DOI] [PMC free article] [PubMed] [Google Scholar]
Associated Data
This section collects any data citations, data availability statements, or supplementary materials included in this article.
Supplementary Materials
The following are the supplementary data related to this article:
Supplementary Table S1: Clinical annotations of the 475 clear‐cell renal cell carcinoma analyzed.
Supplementary Table S2: List of long non coding RNA expressed in clear‐cell renal cell carcinoma and the correlation of their expression with the neighboring genes expression.
Supplementary Table S3: Cluster assignment of the 475 clear cell renal cell carcinoma (RCC) samples including the annotation of cases classified by virtual karyotyping and/or pathological review as chromophobe RCC or clear cell papillary RCC.
Supplementary Table S4: The concordance between lncRNA‐based clusters and TCGA mRNA‐based clusters.
Supplementary Figure S1: Correlation plots between CAV1 gene and the two cis‐acting long non coding RNA AC006159.3 and AC006159.4.
Supplementary Figure S2: Box‐plot for EZH2 gene expression across long non coding RNA clusters.