

Abstract
Small metal ions play critical roles in numerous biological processes. Of particular interest is how metalloenzymes are allosterically regulated by the binding of specific ions. Understanding how ion binding affects these biological processes requires atomic models that accurately treat the microscopic interactions with the protein ligands. Theoretical approaches at different levels of sophistication can contribute to a deeper understanding of these systems, although computational models must strike a balance between accuracy and efficiency in order to enable long molecular dynamics simulations. In this study, we present a systematic effort to optimize the parameters of a polarizable force field based on classical Drude oscillators to accurately represent the interactions between ions (K+, Na+, Ca2+, and Cl–) and coordinating amino-acid residues for a set of 30 biologically important proteins. By combining ab initio calculations and experimental thermodynamic data, we derive a polarizable force field that is consistent with a wide range of properties, including the geometries and interaction energies of gas-phase ion/protein-like model compound clusters, and the experimental solvation free-energies of the cations in liquids. The resulting models display significant improvements relative to the fixed-atomic-charge additive CHARMM C36 force field, particularly in their ability to reproduce the many-body electrostatic nonadditivity effects estimated from ab initio calculations. The analysis clarifies the fundamental limitations of the pairwise additivity assumption inherent in classical fixed-charge force fields, and shows its dramatic failures in the case of Ca2+ binding sites. These optimized polarizable models, amenable to computationally efficient large-scale MD simulations, set a firm foundation and offer a powerful avenue to study the roles of the ions in soluble and membrane transport proteins.
Introduction
Studies of complex biomolecular systems are increasingly relying on the information obtained by generating dynamical trajectories of large-scale detailed atomic models. To achieve computational efficiency, these molecular dynamics (MD) simulations rely on an approximate representation of the Born–Oppenheimer potential energy surface based on simple mathematical functions, the so-called molecular mechanical force fields. The vast majority of these force fields represent the electrostatic potential energy as pairwise additive Coulomb interactions between effective fixed atomic charges that are empirically adjusted to reflect the average polarization of molecular moieties in a realistic environment. Examples of nonpolarizable additive potential functions that have been widely used to study biological systems include the CHARMM, OPLS, GROMOS, and AMBER force fields.1−6
Despite the success of the classical additive force fields in modeling a wide range of critical chemical and physical events, the limitations associated with a fixed charge model are frequently observed. This became increasingly apparent, as additional efforts to optimize the parameters of the force fields failed to improve the accuracy of the models, especially for the binding energetics of multivalent ions in complex electrostatic environments.7,8 For example, by comparing with quantum mechanical (QM) calculations, Ji et al. pointed out the importance of many-body polarization effects on the pKa value of Asp26 of thioredoxin, which indicates the lack of nonadditivity in the classical additive force fields.9 Because induction is approximated in a mean-field fashion, the nonpolarizable additive models are incapable of describing situations where electrostatic polarization effects are important.10 To address this issue, substantial efforts have been made to introduce a more elaborate representation of electrostatic interactions in the molecular mechanical force fields as early as in the 1970s;11 although, the first complete polarizable force fields for biomolecular systems have emerged only in the past few years.12 These include the AMOEBA force field, in which the static and induced charge distribution within a molecule is explicitly represented with multipoles associated with the nuclei together with induced point dipoles determined through a self-consistent field (SCF) condition. Applications of AMOEBA include modeling of gas-phase clusters and simulations of condensed-phase systems from a few to tens of nanoseconds. The principal computational cost of this model lies in the SCF conditions, limiting the type of systems that can be simulated practically. Another polarizable force field that has emerged is the classical Drude oscillator model.10,13−18 Sometimes called the Shell model19,20 or the spring-on-charge model,21 the Drude model consists of adding an auxiliary charged particle attached to the nucleus via a harmonic spring that is treated as an additional dynamical degree of freedom (for more details, see refs (13, 14, 18, 22, and 23)). Despite its deceptive simplicity, the classical Drude oscillator model can effectively capture the charge redistribution in response to changes in local electric fields, allowing for a realistic representation of molecular interactions in a variety of condensed-phase systems including solvated proteins, nucleic acids, and membranes.16,18,24 Importantly, the Drude model allows for computationally efficient MD simulations by virtue of its particle-based functional form.25
In the present study, our efforts are specifically focused on the development of the Drude polarizable force field toward the general goal of accurately describing ion–protein interactions. The selective binding of small ions (Na+, K+, Ca2+, and Cl–) often plays a decisive role in the function of many enzymes.26,2728,29 Ions also play a critical role in the functions of numerous membrane-bound proteins such as transporters and channels, where preferential binding and ion-selective permeation serve to regulate ionic gradients and action potentials across cell membranes.30 Yet, despite their biological importance, it is well understood that ion–protein interactions are among the least accurately represented by current additive force fields. To ensure the accuracy and transferability of the final model, the parameters of the Drude polarizable force field for ion–protein interactions were optimized on the basis of experimental data as well as a series of ab initio calculations for a set of 30 representative metalloproteins for which high resolution crystal structures are available. The article is organized as follows: we begin by introducing the methodologies employed for developing the Drude polarizable force field, then report and conclude on its performance and quality, and finally discuss perspectives and outlooks for its usage and further development.
Methodologies
Parameterization and Optimization Strategies
The optimized ion parameters for the Drude polarizable force field are summarized in Table 1. A rigorous theoretical framework for modeling condensed matter must reproduce a representative set of target data, and provide accurate descriptions and prospective predictions of molecular mechanisms at both macroscopic and microscopic scales. Parameter optimizations for molecular mechanics often suffer from the lack of available experimental data at the molecular level and the large sampling gaps between detailed geometries and bulk properties.31 To tackle these issues, we implemented a strategy that combines experimental observables with ab initio calculations to yield models that have a consistent performance for various testing systems. At the microscopic level, where geometric properties such as ion–protein coordination are essential, ab initio optimized structures and interaction energies of ion-model compound clusters are used as benchmarks. The variables used to define the geometry of the clusters are shown in Figures 1, 2, 3, and 4. At this stage of gas-phase cluster optimization, potential parameter sets were selected with a multidimensional grid search in an iterative fashion. For example, for K+–NMA interactions, we started by considering a dimer structure, in which three objective functions xΔE2 = (ΔEQM – ΔEModel)2, xr = (rQM – rModel)2, and xθ2 = (θQM – θModel)2 are minimized simultaneously, where ΔE is the K+–NMA dimer interaction energy, r represents the distance between the cation and the NMA carbonyl oxygen atom, θ is the intermolecular angle (C=O–K+ in Table 3) formed by the carbonyl group and the cation. In the second, third, and fourth iterations, we searched for the parameter set that minimizes the objective function xr = Σi=1n (ri,QM – ri,Model)2, in which n indicates the number of NMA molecules in the cluster, and i represents the index of each NMA molecule. Given the geometric properties, at the macroscopic level, where thermodynamics properties are critical, observables such as numerical solvation free energies of ions in condensed-phase liquids (SFE) are strictly matched with experimental values. At this stage, we evaluated the objective function xSFE = (SFEQM – SFEModel)2 by using the candidate parameter sets obtained in the stage of gas-phase cluster optimization. The best parameter sets were then examined by applying them to compute the ion–protein interaction energies on 30 representative metalloproteins and compare with QM binding energies. The parameter sets with the smallest standard deviations from the QM data were selected as the final models. All numerical data and plots are provided in the Supporting Information (SI).
Table 1. Optimized Pair-Specific Parameters for Interactions of Ion-Model Compounds in the Drude Polarizable Force Field.
| NBFIX |
|||||
|---|---|---|---|---|---|
| solvent | pair | Emin(kcal/mol) | Rmin(Å) | NBTHOLE | |
| NMA | K+ | OD2C1A | –0.18 | 3.21 | 2.19 |
| K+ | LPDO1 | –0.07 | 3.02 | - | |
| Na+ | OD2C1A | –0.09 | 2.88 | 1.04 | |
| Na+ | LPDO1 | –0.06 | 2.77 | - | |
| Ca2+ | OD2C1A | –0.22 | 2.85 | 1.32 | |
| Ca2+ | LPDO1 | –0.37 | 2.50 | - | |
| Cl– | ND2A2 | –0.08 | 4.65 | 2.86 | |
| Cl– | HDP1A | –0.001 | 3.54 | - | |
| ETOH | K+ | OD31A | –0.15 | 3.34 | - |
| Na+ | OD31A | –0.06 | 3.07 | 1.82 | |
| Ca2+ | OD31A | –0.10 | 3.28 | 1.05 | |
| Cl– | OD31A | –0.1039 | 4.05 | - | |
| PA | K+ | OD2C2A | –0.07 | 3.52 | 0.22 |
| Na+ | OD2C2A | –0.04 | 1.98 | 0.43 | |
| Ca2+ | OD2C2A | –0.11 | 3.515 | - | |
Figure 1.
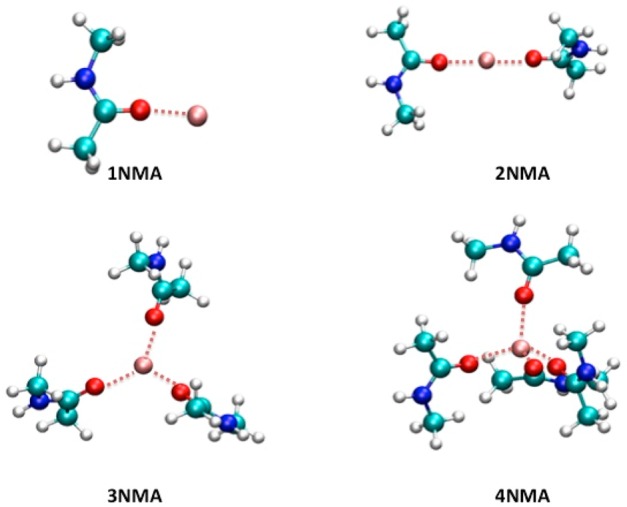
Schematic illustrations of ion-model compound clusters employed in the gas-phase cation–N-methylacetamide (NMA) cluster calculations. The dashed lines indicate the reference properties (listed in Table 3) employed in the target functions of the parameter optimization process. A cation is represented by a pink sphere.
Figure 2.
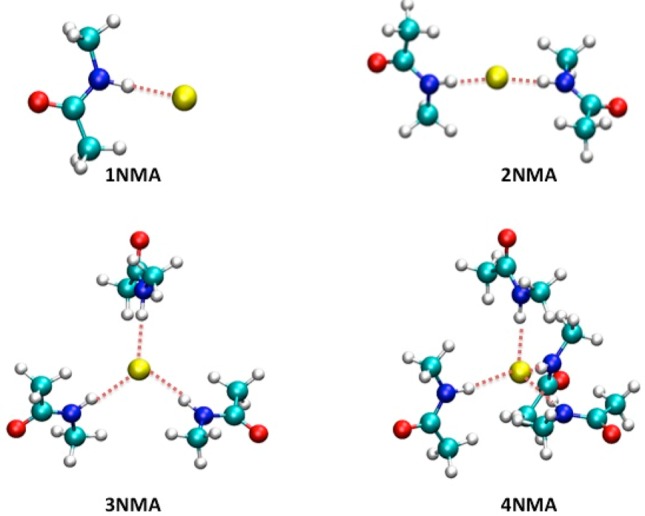
Schematic illustrations of ion-model compound clusters employed in the gas-phase Cl––NMA cluster calculations. The dashed lines indicate the reference ion-model compound distances (listed in Table 3) employed in the target functions of the parameter optimization process. The Cl– anion is represented by a yellow sphere.
Figure 3.
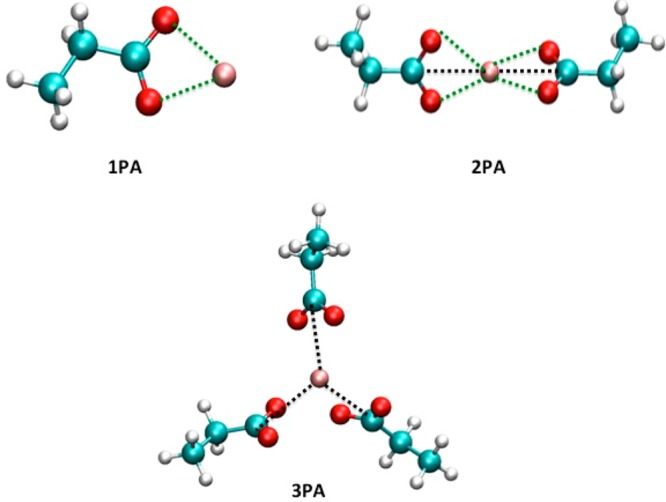
Schematic illustrations of ion-model compound clusters employed in the gas-phase calculations of the cation–propanoic acid (PA) clusters. The green and black dashed lines indicate the reference ion–PA distances (listed in Table 5) employed in the target functions of the parameter optimization process for the monovalent cation-PA clusters and the divalent cation–PA clusters, respectively. A cation is represented by a pink sphere.
Figure 4.
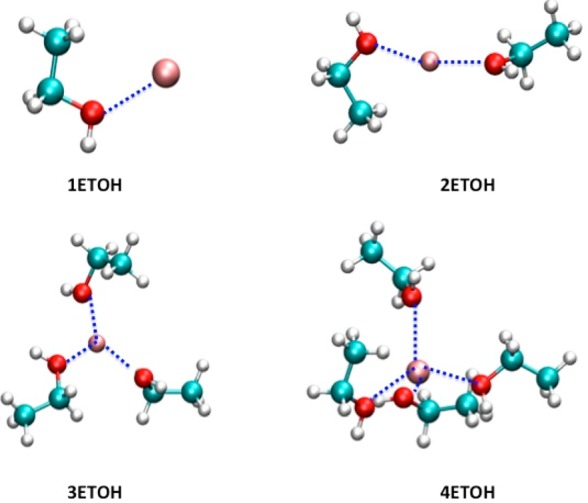
Schematic illustrations of ion-model compound clusters employed in the gas-phase calculations of the cation–ethanol (ETOH) clusters. The dashed lines indicate the reference ion-ETOH distances (listed in Table 4) employed in the target functions of the parameter optimization process. A cation is represented by a pink sphere.
Table 3. Interaction Energies (ΔE) and Optimized Geometries of the Gas-Phase Ion-N-methylacetamide (NMA) Clustera.
| 1NMA |
2NMA |
3NMA |
4NMA |
|||||||
|---|---|---|---|---|---|---|---|---|---|---|
| property | QM | Drude | Expt. | QM | Drude | QM | Drude | QM | Drude | |
| K+ | C=O–K+ angle | 171.8 | 168.5 | - | - | - | - | - | - | - |
| O1–K+(Å) | 2.48 | 2.43 | - | 2.53 | 2.49 | 2.58 | 2.53 | 2.64 | 2.52 | |
| O2–K+(Å) | - | - | - | 2.53 | 2.49 | 2.58 | 2.53 | 2.65 | 2.52 | |
| O3–K+(Å) | - | - | - | - | - | 2.58 | 2.53 | 2.65 | 2.57 | |
| O4–K+(Å) | - | - | - | - | - | - | - | 2.65 | 2.57 | |
| ΔE (kcal/mol) | –30.8 | –29.8 | –30.4 | (−59.5) | (−56.5) | (−91.5) | (−86.1) | (−118.2) | (−110.5) | |
| Na+ | C=O–Na+ angle | 168.8 | 176.1 | - | - | - | - | - | - | - |
| O1–Na+(Å) | 2.15 | 2.12 | - | 2.12 | 2.15 | 2.17 | 2.16 | 2.24 | 2.18 | |
| O2–Na+(Å) | - | - | - | 2.12 | 2.15 | 2.17 | 2.16 | 2.24 | 2.18 | |
| O3–Na+(Å) | - | - | - | - | - | 2.17 | 2.16 | 2.24 | 2.18 | |
| O4–Na+(Å) | - | - | - | - | - | - | - | 2.24 | 2.18 | |
| ΔE (kcal/mol) | –38.4 | –35.6 | –35.7 | (−84.0) | (−77.2) | (−115.8) | (−111.0) | (−139.5) | (−135.1) | |
| Ca2+ | O1–Ca2+–O2 angle | - | - | - | –179.6 | –165.7 | - | - | - | - |
| O1–Ca2+(Å) | - | - | - | 2.19 | 2.07 | 2.23 | 2.12 | 2.27 | 2.13 | |
| O2–Ca2+(Å) | - | - | - | 2.19 | 2.07 | 2.23 | 2.12 | 2.27 | 2.13 | |
| O4–Ca2+(Å) | - | - | - | - | - | 2.23 | 2.13 | 2.28 | 2.13 | |
| O4–Ca2+(Å) | - | - | - | - | - | - | - | 2.28 | 2.14 | |
| ΔE (kcal/mol) | - | - | - | –175.8 | –178.2 | (−257.6) | (−268.1) | (−313.8) | (−298.8) | |
| Cl– | Cl––H–N angle | 176.2 | 171.8 | - | - | - | - | - | - | |
| H1–Cl–(Å) | 2.09 | 2.25 | - | 2.18 | 2.26 | 2.25 | 2.30 | 2.34 | 2.36 | |
| H2–Cl–(Å) | - | - | - | 2.18 | 2.28 | 2.25 | 2.30 | 2.34 | 2.36 | |
| H3–Cl–(Å) | - | - | - | - | 2.25 | 2.33 | 2.34 | 2.37 | ||
| H4–Cl–(Å) | - | - | - | - | - | - | - | 2.34 | 2.39 | |
| ΔE (kcal/mol) | –22.7 | –22.1 | - | (−43.6) | (−41.4) | (−61.9) | (−60.0) | (−74.6) | (−71.4) | |
Schematic representations for the geometric variables used in this table are shown in Figures 1, 2, 3, and 4. The ab initio calculations are performed at the B3PW91/LANL2DZ level with the BSSE corrections, using the Gaussian 09 program suite.52 Experimental values of the binding enthalpies are taken from the study by Klassen et al.69 O1 to O4 indicated the oxygen atoms in the NMA molecule, arranged by their distances to the cation. The interaction energies in brackets are not employed as benchmarks in the parameterization process. All other properties in the table are employed as target values for parameterizing the Drude model.
In the Drude force field, an auxiliary particle carrying a negative charge qD is attached by a harmonic spring to a nucleus carrying an opposite charge. Any addition partial atomic charges needed to represent the static charge distribution of the molecule is simply superimposed to the charge of the nucleus, whose single-point charge becomes qi – qD. The force constant of the harmonic springs is typically KD = 1000 kcal/mol/Å2.32 The isotropic atomic polarizability α is qD (aKD)1/2. The value of α is determined by fitting the electrostatic field from ab initio calculations in the presence of small perturbing charges. The polarizabilities of the ions (Na+, K+, Ca2+, and Cl–) experimentally determined in aqueous solutions are used in this study. The interactions between the ions and proteins are classified into three categories: (1) interactions between cations and backbone carbonyl groups of asparagine (ASN), glutamine (GLN) acids, and model-compound N-methylacetamide (NMA) representing peptide linkage structures; (2) interactions between cations and hydroxyl groups of serine (SER) and threonine (THR) acids, and model-compound ethanol (ETOH); (3) interactions between cations and carboxylate groups of glutamic (GLU) and aspartic (ASP) acids, and model-compound propanoic acid (PA). The underlying Drude ion models were published in our previous study.22 To modulate the interactions between the ions and proteins, we introduced the following terms listed in Table 1:
-
(i)
Pair specific nonbonded Lennard-Jones (LJ) interaction parameters Emin and Rmin (referred to as NBFIX in the CHARMM force field), which override the default values determined by the Lorentz–Berthelot combination rule. We found that two pairs of NBFIX parameters are necessary when determining the interactions between cations and carbonyl groups of protein backbones. They are the parameters for the cations and carbonyl oxygen atoms, and for the cations and the LP particles (the Lone Pair particles in the force field files). Since Cl– mostly interacts with the amide groups of protein backbones, the force field contains only NBFIX parameters for Cl– and hydrogen atoms of amide groups, NBFIX and NBTHOLE (see below) parameters for Cl– and nitrogen atoms of amide groups.
-
(ii)
Pair-specific Thole charge shielding factors (referred to as NBTHOLE in the CHARMM force field), designed to control the strength of electrostatic induction for a pair of charges.16,17,22,23
Calculation of Solvation Free Energy
The absolute solvation free energies of K+, Na+, Ca2+, and Cl– in model-compound liquid NMA and liquid ETOH were calculated by the following equation:
| 1 |
The term ΔGelec arises from the electrostatic interactions. The terms ΔGrep and ΔGdisp represent the repulsive and dispersive components of van der Waals (VDW) interactions, respectively.33 Each of the three components was sampled in independent MD simulations in which a single ion is placed at the center of a cubic box containing 144 NMA or 125 ETOH molecules. The contributions from the electrostatic and VDW interactions were computed using the thermodynamic integration (TI) approach. We implemented a soft-core scheme for the calculation of ΔGrep to avoid an end-point singularity,33 together with the weighted histogram analysis method (WHAM).34,35 The term −kBT ln(1/Vm) is an entropic contribution accounting for compression from the ideal gas at 1 atm to an idealized bulk solution at 1.0 molar concentration. The last term qFϕ represents the contribution from the interface potential of a liquid relative to that of vacuum, where ϕ is the interface potential and q is an ionic charge, and F is the Faraday constant = 23.06 kcal/mol/V.36,37 To estimate this term, we constructed slab simulations of a cubic box containing NMA or ETOH liquid, which is continuous in the x and y dimensions. The z dimension is equal to three times the x–y dimension, so there are two neat-liquid/vacuum interfaces forming along the z-axis. From the slab simulations, the charge density of a liquid system is calculated as a function of the z-coordinate, and the interface potential ϕ is determined by numerically integrating the corresponding Poisson equation.37 For Na+, we evaluated its solvation free energy relative to K+ in the liquids.
The solvation free energies were calculated by the CHARMM program, version c38b1.38 The Drude force field describing the model-compounds is based on recent work on polarizable amino acids by Lopes et al.39 Periodic boundary conditions (PBC) were applied and the system pressure was maintained at 1 atm by using a modified Anderson–Hoover barostat.40,41 To active maximum computational efficiency, the system was propagated with a dual-thermostat Nosé–Hoover (NH) extended Lagrangian algorithm.13 To closely reproduce the self-consistent field (SCF) induced polarization condition, a first NH thermostat at 1 K is coupled to the relative distance of all pairs of reduced-mass oscillators comprising the (heavy) nucleus and its (light) Drude particle. To maintain the global temperature of the system, a second NH thermostat at 303.15 K is coupled to the centers-of-mass of all nucleus–Drude pairs.42,43 A time step of 1 fs was used, and all bonds involving hydrogen atoms were constrained using the SHAKE algorithm.44 Long-range electrostatic interactions were evaluated using the particle-mesh Ewald method, with a smooth real-space cutoff applied between 10 and 12 Å.45
Collection of Proteins
To optimize the force field parameters, 30 high-resolution crystal structures of enzymatic proteins from the Protein Data Bank (PDB) were chosen in which the binding of Na+, K+, and Ca2+ is functionally important.46 Such specific domains are referred to as ion-binding sites. Each enzymatic protein has a resolution between 1.1 and 2.7 Å. Crystallographic water molecules were kept and included in the solvation of the proteins. The surrounding bulk solution, with the TIP3P water model, with 0.15 M of the corresponding salt, was built with the CHARMM-GUI web-portal.47,48 The information on the simulation systems, including the PDB identification codes, system dimensions and numbers of atoms is given in Table 2.
Table 2. List of Enzymes Bound by Different Ionic Speciesa.
| ion | index | PDB | R (Å) | N | dimension (Å3) | name of the enzyme |
|---|---|---|---|---|---|---|
| K+ | 1 | 1J5Y | 2.1 | 26713 | 80 × 60 × 60 | transcription regulator |
| 2 | 1JF8 | 1.12 | 31811 | 70 × 70 × 70 | reductase | |
| 3 | 1NI4 | 1.95 | 38677 | 85 × 70 × 70 | pyruvate dehydrogenase | |
| 4 | 2BFD | 1.39 | 36669 | 80 × 70 × 70 | brached-chain α-ketoacid dehydrogenase | |
| 5 | 1P36 | 1.45 | 31623 | 80 × 65 × 65 | T4 lyozyme (mutant) | |
| 6 | 1LJL | 2.01 | 19985 | 60 × 60 × 60 | Aureus arsenate reductase | |
| 7 | 1TYY | 2.6 | 31967 | 75 × 70 × 65 | aminoimidazole riboside kinase | |
| 8 | 1DTW | 2.7 | 36618 | 80 × 70 × 70 | MutL | |
| 9 | 1V3Z | 1.72 | 20076 | 60 × 60 × 60 | acylphosphatase | |
| 10 | 4LS7 | 1.67 | 44356 | 85 × 80 × 70 | FabF | |
| Na+ | 11 | 193L | 1.33 | 23500 | 70 × 60 × 60 | lyzosyme |
| 12 | 1E43 | 1.7 | 33500 | 100 × 60 × 60 | amylase | |
| 13 | 1SFQ | 2.0 | 31949 | 70 × 70 × 70 | thrombin | |
| 14 | 1GEN | 2.15 | 26917 | 80 × 60 × 60 | gelatinase | |
| 15 | 3N0U | 1.5 | 31948 | 70 × 70 × 70 | glycosylase | |
| 16 | 1L5B | 2.0 | 31707 | 70 × 70 × 70 | cyanovirin | |
| 17 | 1QNJ | 1.10 | 23432 | 70 × 60 × 60 | pancreatis elastase | |
| 18 | 1QUS | 1.70 | 39236 | 100 × 65 × 65 | lyzosyme-like domain – hydrolase | |
| 19 | 1S36 | 1.96 | 27591 | 70 × 65 × 65 | photoprotein | |
| 20 | 1SK4 | 1.65 | 31507 | 80 × 65 × 65 | peptidoglycan recognition protein Ialpha | |
| Ca2+ | 21 | 3LI3 | 1.66 | 31801 | 70 × 70 × 70 | DFPase |
| 22 | 1BLI | 1.9 | 33689 | 100 × 60 × 60 | Holo Bla | |
| 23 | 2UUY | 1.15 | 23199 | 70 × 60 × 60 | tick tryptase inhibitor | |
| 24 | 1A4V | 1.8 | 23122 | 70 × 60 × 60 | alpha-lactalbumin | |
| 25 | 4KTS | 1.30 | 31659 | 70 × 70 × 70 | bovine trypsin | |
| 26 | 2AAA | 2.1 | 45364 | 100 × 70 × 70 | alpha-amylase | |
| 27 | 3TZ1 | 1.8 | 23334 | 70 × 60 × 60 | scallop troponin C | |
| 28 | 1EXR | 1.0 | 27781 | 100 × 55 × 55 | calmodulin | |
| 29 | 1RWY | 1.05 | 19971 | 60 × 60 × 60 | alpha-parvalbumin | |
| 30 | 3ICB | 2.3 | 19927 | 60 × 60 × 60 | bovine intestine |
Each system is solvated with TIP3P water and has 0.15 M of salt. R indicates the resolution of the crystal structure. N represents the total number of atoms of the fully solvated simulation systems.
Sampling of Ion-Binding Sites
The program NAMD and the CHARMM C36 force field were used to carry out MD simulations.49 Energy minimization by means of the conjugate gradient algorithm was performed to relax the initial structures and remove any high-energy contacts. Each of the solvated proteins was equilibrated for 4 ns using NPT ensemble coupling with p = 1 atm.50 The system temperature was kept at 300 K using Langevin dynamics with a damping constant of 5 ps–1 and a time step of 1 fs. The purpose of this MD simulation step is to sample different conformations of the nearest protein ligands around the bound ions, so the numerical interaction energies between the ions and the ligands via ab initio methods, the Drude polarizable force field, and the CHARMM C36 additive force field possess thermal effects (see Supporting Information Figure S1).1,31 We found that most of the systems have the ions stably bound in the binding sites, with a few exceptions, which have the binding ions migrating out of the binding site during the 4 ns MD simulations. In those few cases, we applied a soft harmonic potential with spring constant equal to 1.0 kcal/mol/Å2 to the bound ions. This restraint allows a similar sampling of the ligand conformations around the ions (see Figure S2). From the 4 ns conformations, we extracted 20 snapshots to build a truncated model of the ion-binding sites. Each ion-binding site in the enzymatic proteins was truncated within a sphere of 5.5 Å from the ions, which is larger than the distance from the first hydration shell to the ions (≈ 3.0 Å).
The truncated ion binding pockets formed by amino-acid residues have C- and N-termini defined in the CHARMM force field: (1) acetylated N-terminus (ACE) and N-methylamide C-terminus (CT3); (2) N-terminus (NTER) and C-terminus (CTER). The two sets of termini allow testing if there is a dependence of binding energies on the terminated groups. Since they yield almost the same results, we discuss the results for the first set of termini in the main text, and the other results are provided in the SI. When the truncated procedure introduced several small and sparse segments of the original undisrupted protein sequences, we added one or two original amino acids to the segments in order to avoid disruptions, thus reducing the numbers of end-amino-acid termini, even though the added amino acids of the proteins were not found in the truncation. However, if the disruptions required adding more than two original amino acids between the sparse segments, we treated the sparse segments as separate ligands. We also kept about two to five water molecules nearest to the pockets of the binding sites. As a result, the truncated models of the binding sites contain about 200 ± 50 atoms, including the binding-ions, two or five water molecules and the number of ligands varies from 1 to 6 in different systems.
Ab Initio Methods
All ab initio calculations using basis set superposition error (BSSE) corrections51 for the gas-phase ion-model compound clusters and ion-binding proteins were carried out using the Gaussian 09 suite of programs.52 Another ab initio software, called General Atomic and Molecular Electronic Structure System (GAMESS),53 was also used to ensure the consistency between the two commonly used softwares (we tested on small complexes in SI). For QM calculations, it is essential to choose basis sets and types of approximations,54 whose detailed analysis are provided in the SI from Tables S1–7 and Figures S3–6, to compute ion-binding energies of metalloprotein sites, which are defined as interaction energies between the cations and surroundings using the counterpoise option in Gaussian. We found that the ion–protein binding energies computed by the B3LYP functional with basis set CEP-121 are consistent and reliable in terms of accuracy and computational cost.55−63 The geometries, and hence different symmetries of ion–NMA clusters were characterized at various coordination numbers from 1 to 4 as illustrated in Figure 1. The number of NMA was changed from 2 to 4 except in Ca2+–NMA clusters, because the system of Ca2+ and one NMA leads to severely distorted electron distributions. The geometries of small gas-phase clusters were optimized at the B3PW91 level with the LANL2DZ basis set.64,65
Results and Discussions
Parameterization of the Force Field
Table 1 lists pair-specific interactions between the ions and protein atoms/particles: (1) interactions between K+, Na+, Ca2+, Cl– and protein backbones tested in the model compound NMA; (2) interactions between K+, Na+, Ca2+, Cl– and protein side-chains having hydroxyl groups tested in the model compound ETOH; and (3) interactions between K+, Na+, Ca2+ and protein side-chains having carboxylate groups tested in the model compound PA. In the case of the ion-NMA interactions, we introduced extra pair-specific interactions between the ions and the lone-pair particles attached to the carbonyl oxygen atoms (see Methodologies). These interactions effectively restrain the C–O-ion angles in the ion–NMA dimers (Table 3) to a reasonable range of about 180°, thus preventing the angular geometry from being suddenly distorted, where C and O are for carbon and oxygen atoms of carbonyl groups, respectively. Reproducing the stability of this angle is critical for modeling at molecular levels; otherwise any instability indicates imbalanced interactions between the ions and the amide group, thus leading to incorrect coordination of the ions. In the case of the Cl––amide interactions, in addition to the interactions between Cl– and its immediate neighbors of amide HDP1A atoms, we found it to be necessary to include a Thole screening function between the charges on the Cl– and ND2A2 atoms on the amide groups to reproduce the QM energies more accurately (see below).
Gas-Phase Model Compounds
To optimize the interactions of the ion-NMA clusters with different sizes (Figures 1−4), we examined multiple properties from the interaction energies to the coordination geometries that are key features for predicting and reproducing realistic features in biological modeling.66 Table 3 lists the properties with both the ab initio calculations of the monovalent ion–NMA dimers and their experimentally measured binding enthalpies. Using a Gaussian-3 (G3) protocol with the geometry-corrected counterpoise method, Siu et al.67,68 and Tsang et al.67,68 reported the binding enthalpies of −30.3 kcal/mol and −38.1 kcal/mol for K+ and Na+ with single NMA molecule, respectively. Using LANL2DZ basis set and B3PW91 functional, we obtained the binding enthalpies of −30.8 kcal/mol for the K+–NMA dimer and −38.4 kcal/mol for the Na+-dimer, both within 0.5 kcal/mol of the G3 calculations. The Drude interaction energies of the ion–NMA dimers differ by less than 3.0 kcal/mol from the first-principles calculations. Although the binding enthalpy for the Na+–NMA dimer obtained from the Drude model is 2.8 kcal/mol larger than that from the ab initio calculations, it deviates by only 0.1 kcal/mol from the value measured in the collision-induced-disassociation experiments by Klassen et al.69 In terms of fundamental geometries, the Drude model successfully reproduces the following characteristics of the QM calculations:
(1). Angular Geometry
Using the Drude force field, both K+ and Na+ have the C–O–Ion angles within ±10° of the QM angles. A difference of about 5° is found for the N–H–Cl– angles. In the case of Ca2+, we used a reference structure having a trimer that contains one cation and 2 NMA molecules to mimic the condensed phase, where Ca2+ is usually coordinated with at least four water molecules or other electron-rich protein groups.69 This structure returns a difference of about 14° between the O1–Ca2+–O2 angles.
(2). Optimized Binding Distances between the Ions and NMA
The optimized distances, 2.48 Å between K+ and NMA, and 2.15 Å between Na+ and NMA, are 0.05 Å longer than the values by Siu et al.,67 which converge to 2.43 and 2.10 Å, respectively. The differences between the Drude and ab initio optimized ion-NMA distances are less than 0.1 Å for all of the monovalent ions. Using the Drude force field, Ca2+ has the optimized distances from NMA of about 0.12 Å lower than that from the ab initio calculations. In this case, compensation on the NMA–ion distance (0.12 Å in the Ca2+ cluster vs 0.10 Å in monovalent–cation NMA cluster) is necessary to achieve a balanced description of the geometry and interaction energies. For this geometry, the CHARMM27 model, which was developed to reproduce the solvation free energies of alkali cations in the condensed phase but, in the gas-phase, leads to significant underestimations for the absolute binding enthalpies, and thus overestimates the optimized distances between the ions and amide groups. For example, CHARMM27 estimated an NMA–K+ distance to be 2.68 Å in the dimer cluster, in comparison with the QM predicted value of 2.48 Å.
(3). Coordination of the Ions
We found that, as the number of NMA molecules increases from 1 to 4, the ion–NMA distances in the Drude models increase by 0.09 Å for K+ and 0.06 Å for Na+, reproducing well the values found in the ab initio calculations. For Ca2+, the distance increases by 0.08 Å in the ab initio calculations and by 0.06 Å in the Drude models. This phenomenon is of particular importance because it reflects the behavioral correlations between ions and protein structures, which dynamically change local electrostatic environments, for example, in the processes of ion permeation through channel structures such as the ion-channel KcsA protein.70 From the bulk water environment to the channel interior, the coordination number of water molecules and the oxygen atoms of the negatively charged carbonyl groups in the immediate solvation shell of a cation vary noticeably as the cation enters deeper into the selectivity filter of KcsA.
The interactions and geometries between the ions and other typical amino-acid side-chains, which are modeled as PA and ETOH molecules (Figures 3 and 4), are listed in Tables 4 and 5. Since the first coordination shell of the solvent molecules contributes approximately half of the ion-electrochemical solvation free energies,66 the size effects of the coordination shell were examined by varying the number of ETOH molecules from 1 to 4, and the number of PA molecules from 1 to 2 for the monovalent cations, and 2 to 3 for Ca2+. The numbers of PA molecules are chosen based on the survey of the carboxylate groups within 5.5 Å of the cations in the 30 ion-binding sites (see the Sampling of Ion-Protein Binding section). PA is a natural carboxylic acid having one negative charge (−|e|), whose electrostatic attractive forces with the cations can have large contributions due to the polarization effects, since a 0.1 Å deviation of the ion–PA distance can result in roughly 6–10 kcal/mol changes in the interaction energies for the dimer structures, and as large as 30 kcal/mol for the Ca2+–PA trimer. To account for these contributions, we parametrized the ion–PA interactions in an iterative fashion by using the QM results as the targets. Table 4 summarizes an assessment of the ion–PA interactions, which shows the Drude force field yielding an absolute difference of <0.1 Å from the QM calculations for all of the ion-oxygen distances, and the energies are different from the QM ones by <5 kcal/mol. The Drude model also exhibits an accurate performance for the ion–ETOH interaction energies, which differ from the QM results by less than 2 kcal/mol (<7%) (Table 5). The optimized ion-oxygen distances show deviations of ≤0.02 Å from the QM optimized values, while the optimized angles have such deviations of <5°. In fact, these deviations are less than those among various ab initio approximations (Table S1).
Table 4. Interaction Energies (ΔE) and Optimized Geometries of the Gas-Phase Ion-Ethanol (ETOH) Clustera.
| 1ETOH |
2ETOH |
3ETOH |
4ETOH |
||||||
|---|---|---|---|---|---|---|---|---|---|
| property | QM | Drude | QM | Drude | QM | Drude | QM | Drude | |
| K+ | C=O–K+ angle | - | - | 175.4 | 176.2 | - | - | - | - |
| O1–K+(Å) | 2.60 | 2.62 | 2.63 | 2.65 | 2.66 | 2.67 | 2.69 | 2.69 | |
| O2–K+(Å) | - | - | 2.64 | 2.66 | 2.67 | 2.67 | 2.70 | 2.70 | |
| O3–K+(Å) | - | - | - | - | 2.67 | 2.68 | 2.71 | 2.70 | |
| O4–K+(Å) | - | - | - | - | - | - | 2.71 | 2.71 | |
| ΔE (kcal/mol) | –22.0 | –22.6 | (−42.6) | (−40.8) | (−61.6) | (−57.6) | (−78.4) | (−73.7) | |
| Na+ | C=O–Na+ angle | - | - | 176.8 | 172.1 | - | - | - | - |
| O1–Na+(Å) | 2.22 | 2.25 | 2.25 | 2.27 | 2.28 | 2.30 | 2.32 | 2.34 | |
| O2–Na+(Å) | - | - | 2.25 | 2.28 | 2.28 | 2.30 | 2.32 | 2.34 | |
| O3–Na+(Å) | - | - | - | - | 2.28 | 2.31 | 2.33 | 2.37 | |
| O4–Na+(Å) | - | - | - | - | - | - | 2.34 | 2.37 | |
| ΔE (kcal/mol) | –32.7 | –30.5 | (−62.5) | (−54.2) | (−88.3) | (−74.3) | (−110.3) | (−100.9) | |
| Ca2+ | O1–Ca2+-O2 angle | - | - | 167.1 | 115.2 | - | - | - | - |
| O1–Ca2+(Å) | - | - | 2.30 | 2.25 | 2.32 | 2.29 | 2.35 | 2.34 | |
| O2–Ca2+(Å) | - | - | 2.30 | 2.25 | 2.32 | 2.29 | 2.36 | 2.34 | |
| O4–Ca2+(Å) | - | - | - | - | 2.32 | 2.30 | 2.36 | 2.34 | |
| O4–Ca2+(Å) | - | - | - | - | - | - | 2.36 | 2.35 | |
| ΔE (kcal/mol) | - | - | –136.6 | –137.4 | (−192.8) | (−200.6) | (−241.5) | (−238.1) | |
Schematic representations for the geometric variables used in this table are shown in Figures 1, 2, 3, and 4. The ab initio calculations are performed at the B3PW91/LANL2DZ level with the BSSE corrections, using the Gaussian 09 program suite.52 Experimental values of the binding enthalpies are taken from the study by Klassen et al.69 The interaction energies in brackets are not employed as benchmarks in the parameterization process. All other properties in the table are employed as target values for parameterizing the Drude model.
Table 5. Interaction Energies (ΔE) and Optimized Geometries of the Gas-Phase Ion-Propanoic Acid (PA) Clustera.
| property | QM | Drude | QM | Drude | |
|---|---|---|---|---|---|
| 1PA | 2PA | ||||
| K+ | O1–K+ (Å) | 2.59 | 2.69 | 2.74 | 2.76 |
| O2–K+ (Å) | 2.59 | 2.69 | 2.74 | 2.76 | |
| O3–K+ (Å) | - | - | 2.74 | 2.77 | |
| O4–K+ (Å) | - | - | 2.75 | 2.77 | |
| ΔE (kcal/mol) | –123.3 | –124.3 | -(233.9) | (−235.4) | |
| 1PA | 2PA | ||||
| Na+ | O1–Na+(Å) | 2.24 | 2.24 | 2.39 | 2.42 |
| O2–Na+(Å) | 2.25 | 2.24 | 2.39 | 242 | |
| O3–Na+(Å) | - | - | 2.41 | 2.43 | |
| O4–Na+(Å) | - | - | 2.41 | 2.43 | |
| ΔE (kcal/mol) | –145.1 | –142.9 | (−271.2) | (−264.0) | |
| 2PA | 3PA | ||||
| Ca2+ | C1–Ca2+(Å) | 2.78 | 2.68 | 2.86 | 2.74 |
| C2–Ca2+(Å) | 2.78 | 2.68 | 2.86 | 2.74 | |
| C3–Ca2+(Å) | - | - | 2.86 | 2.74 | |
| C4–Ca2+(Å) | - | - | - | - | |
| ΔE (kcal/mol) | –558.7 | –553.7 | (−784.9) | (−798.8) | |
Schematic representations for the geometric variables used in this table are shown in Figures 1, 2, 3 and 3. The ab initio calculations are performed at the B3PW91/LANL2DZ level with the BSSE corrections, using the Gaussian 09 program suite.52 Experimental values of the binding enthalpies are taken from the study by Klassen et al.69 The interaction energies in brackets are not employed as benchmarks in the parameterization process. All other properties in the table are employed as target values for parameterizing the Drude model.
Thermodynamic Properties
To examine the quality of the Drude force field in terms of thermodynamics, we computed the solvation free energies and solvent–solvent transfer free energies of natural salts in several liquids, to directly compare with the experiments by Yu et al.23,69 and Klassen et al.23,69 In Tables 6 and 7, we summarize the numerical and experimental free energies of the ions in the liquids of NMA and ethanol transferring from liquid water simulation systems. The accurate prediction of the Drude model for these thermodynamic properties is remarkable because the model can be used to describe changes of not only local electrostatic environments (see above), but also bulk-solvent environments having different electrostatic environments and substantially different polarizable effects.
Table 6. Solvation Free Energies (kcal/mol) of Single Ion and Neutral Salts in Ion-Model Compound Liquidsa.
| solvent | system | ions | ||||
|---|---|---|---|---|---|---|
| water | salt | KCl | NaCl | KCl → NaCl | CaCl2 | |
| expt. | –156.8 | –174.0 | –17.2 | –529.9 | ||
| Drude | –157.0 | –174.7 | –17.7 | –526.7 | ||
| NMA | single ion | K+ | Na+ | K+ → Na+ | Cl– | |
| Drude | –89.0 | –107.6 | –18.6 | –68.1 | ||
| salt | KCl | NaCl | KCl → NaCl | CaCl2 | ||
| expt. | –153.0, 151.3* | –171.6, 168.9* | –18.6 | –526.7 | ||
| Drude | –153.3 | –171.9 | –18.6 | –526.6 | ||
| PARAM27/NBFIX | –140.7 | –157.0 | –16.3 | - | ||
| ETOH | single ion | K+ | Na+ | K+ → Na+ | Cl– | |
| Drude | –65.3 | –80.5 | –15.2 | –84.1 | ||
| salt | K+ | Na+ | KCl → NaCl | CaCl2 | ||
| expt. | –145.0* | –160.3* | –15.3 | –524.9 | ||
| Drude | –145.3 | –160.5 | –15.2 | –473.2 | ||
The absolute solvation free energies of single ions include the contributions of the interfacial potentials for ion translocation across the vacuum liquid–NMA interface. Asterisks (*) indicate experimental data from Case et al.72
Table 7. Solvent–Solvent Transfer Free Energies (kcal/mol) of the Salts from Water to Liquid NMA and to Liquid Ethanol, at Room Temperature, in the Drude Calculations, and from Experiments.
| water → NMA |
water → ethanol |
|||
|---|---|---|---|---|
| expt. | Drude | expt. | Drude | |
| KCl | 3.5 | 3.7 | 11.8 | 11.5 |
| NaCl | 2.4 | 2.8 | 13.7 | 13.2 |
(1). Liquid NMA
The solvation free energy for NaCl and KCl salts in all of the liquids are different from the experimental values by only 0.3 kcal/mol. In contrast, the CHARMM PARAM27 nonpolarizable force field (using the NBFIX parameters) yields the free energies of −140.7 kcal/mol for KCl and −157.0 kcal/mol for NaCl in NMA, which are at least 10 kcal/mol larger than the experimental values, thus indicating inaccurate interactions between the ions and the condensed phase liquids. Using the Drude model, we also estimated the solvation free-energy differences to be −17.7, −18.6, and −15.2 kcal/mol for the substitution of the ions (K+ → Na+) in liquid water, NMA and ETOH, respectively. These values are almost identical to the experimental values reported in many experiments, whereas the free energy difference for the substitution in liquid NMA computed by the CHARMM C36 force field is 2.3 kcal/mol larger than the experimental value.23 For CaCl2 solvation in liquid NMA, the solvation free energy was experimentally estimated to be −526.7 kcal/mol in liquid water environment at 293 K, while the Drude force field accurately predicted this value to be −526.6 kcal/mol in liquid NMA.71
(2). Liquid Ethanol
For the ion solvation free energies in this liquid, the Drude force field reproduces the values of −145.5 kcal/mol for KCl and −160.5 kcal/mol for NaCl, which deviate by 0.5 kcal/mol from the experiments.72 For CaCl2 in this liquid, we computed the solvation free energy by considering the transfer free energy of a salt between two saturated solutions using
| 2 |
where A and B refer to two types of solvents with molarity χA and χB, γA and γB are the activity coefficients of the salt in two solvents, and T is the temperature. Based on experimental data, this equation can estimate the solvation free energy of CaCl2 in ethanol to be −524.9 kcal/mol. However, the Drude model predicts this value to be −473.2 kcal/mol, which is about 50 kcal/mol (∼10%) different from the experimental estimation. This difference, even though it is large, is commonly encountered in QM calculations for the interactions between calcium and proteins (see Figure S5(a)). As an approximation of electron densities, the Drude model perhaps suffers the same difficulty in describing the divalent ion interactions with surroundings. As we will show later, the Drude model yields an acceptable accuracy (uncertainty <10%) for a number of calcium-binding sites.
(3). Solvent–Solvent Transferring Free Energy
Table 7 shows the free energy differences for transferring salts from one solvent to another. A free energy of transferring between two salts can indicate the capability of a force field to describe changes of electrostatic environment, which can be quantified by dielectric permittivity. For example, at 293.15 K the dielectric permittivity is 80.1 for water, 37.8 for liquid NMA, only ∼24.5 for liquid ethanol, and in proteins the dielectric permittivity ranges from ∼80 to as low as 4.73 Indeed, the Drude polarizable force field can accurately reflect the changes between the different electrostatic environments with the solvent–solvent free energies less than 0.5 kcal/mol away from the experimental values.
Ion-Protein Binding Sites
For the final and critical test, we examined how the Drude force field performs for ion-binding sites in 30 biologically important enzymes (see Methodologies). For protein atoms, Drude polarizable force field was employed.39 Table 8 shows the types and numbers of ion-coordinating oxygen atoms in the various binding sites found in these enzymes. Those oxygen atoms include backbone amide linkages, hydroxyl groups of SER and THR, carboxylate groups of ASP and GLU, and carboxamide groups of ASN and GLN. Table 8 also shows that K+ mainly interacts with backbone carbonyl groups, Na+ tends to have a preference for both carbonyl groups and the carboxylate oxygen atoms, and Ca2+ displays favorable interactions with the carboxylate groups. Snapshots of enzymes 1NI4 (K+), 1L5B (Na+), and 3LI3 (Ca2+) are illustrated in Figure 5. Figures 6 and S7–9 show the binding energies computed by using QM calculations, the Drude force field, and the C36 force field (the numerical data are provided in Tables S8–9). In order to illustrate how different force fields influence the ion-protein binding, Figure 7 shows the structure alignments of simulation snapshots obtained from the two force fields for the binding sites having K+, Na+, and Ca2+.
Table 8. Properties of Ion-Binding Sites Identified from the Crystal Structuresa.
| types of oxygen atoms |
|
|||||
|---|---|---|---|---|---|---|
| ion | PDB | –OH | -C=O | –COO– | H2O | ion |
| K+ | 1J5Y | 0 | 4 | 0 | 3 | 0 |
| 1JF8 | 1 | 5 | 1 | 4 | 0 | |
| 1NI4 | 0 | 5 | 0 | 1 | 0 | |
| 2BFD | 1 | 6 | 0 | 1 | 0 | |
| 1P36 | 1 | 1 | 1 | 4 | 0 | |
| 1LJL | 1 | 5 | 1 | 3 | 0 | |
| 1TYY | 0 | 5 | 1 | 3 | 0 | |
| 1DTW | 1 | 6 | 0 | 1 | 0 | |
| 1V3Z | 0 | 5 | 0 | 0 | 0 | |
| 4LS7 | 1 | 6 | 1 | 2 | 0 | |
| Na+ | 193L | 1 | 4 | 0 | 2 | 0 |
| 1E43 | 0 | 1 | 6 | 1 | 2Ca2+ | |
| 1SFQ | 0 | 2 | 0 | 5 | 0 | |
| 1GEN | 0 | 4 | 0 | 0 | 1Cl– | |
| 3N0U | 0 | 4 | 0 | 3 | 0 | |
| 1L5B | 0 | 5 | 0 | 2 | 0 | |
| 1QNJ | 0 | 5 | 3 | 1 | 0 | |
| 1QUS | 1 | 1 | 4 | 1 | 0 | |
| 1S36 | 0 | 5 | 1 | 0 | 1Cl– | |
| 1SK4 | 1 | 5 | 0 | 1 | 0 | |
| Ca2+ | 3LI3 | 0 | 4 | 3 | 4 | 0 |
| 1BLI | 0 | 1 | 5 | 1 | 1Na+ | |
| 2UUY | 0 | 3 | 2 | 2 | 0 | |
| 1A4V | 0 | 2 | 3 | 2 | 0 | |
| 4KTS | 0 | 3 | 3 | 2 | 0 | |
| 2AAA | 0 | 2 | 4 | 3 | 0 | |
| 3TZ1 | 1 | 1 | 5 | 1 | 0 | |
| 1EXR | 0 | 1 | 5 | 1 | 0 | |
| 1RWY | 1 | 1 | 6 | 0 | 0 | |
| 3ICB | 0 | 5 | 2 | 1 | 0 | |
Each element (types of oxygen atoms, H2O, ion and amino acids components) is counted within a 3.5 Å sphere centered at the bound ion.
Figure 5.
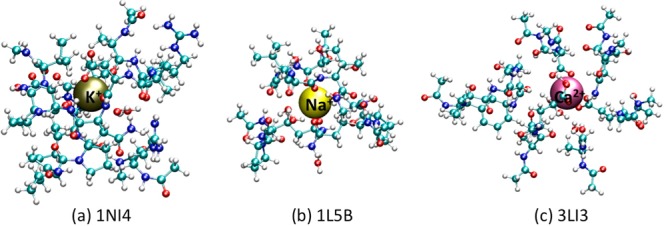
Snapshots of toy-model (truncated) ion-binding sites employed in QM calculations. (a) K+ in 1NI4. (b) Na+ in 1L5B. (c) Ca2+ in 3LI3. The cations are illustrated using VDW model. The backbone structures of the protein segments are highlighted in orange with the ribbon model.
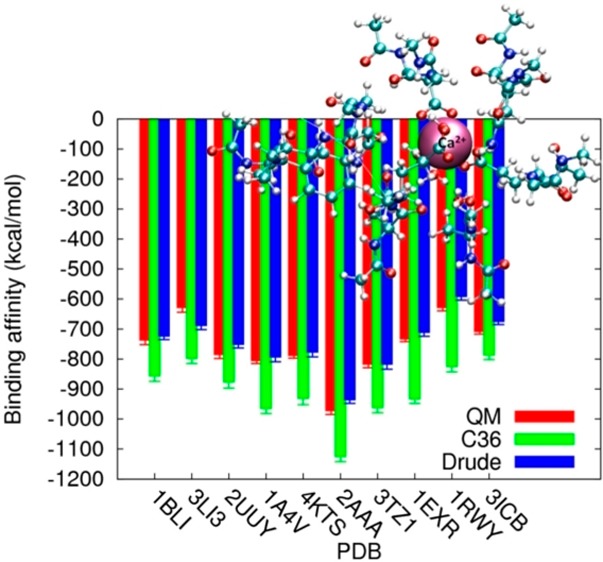
Figure 6.
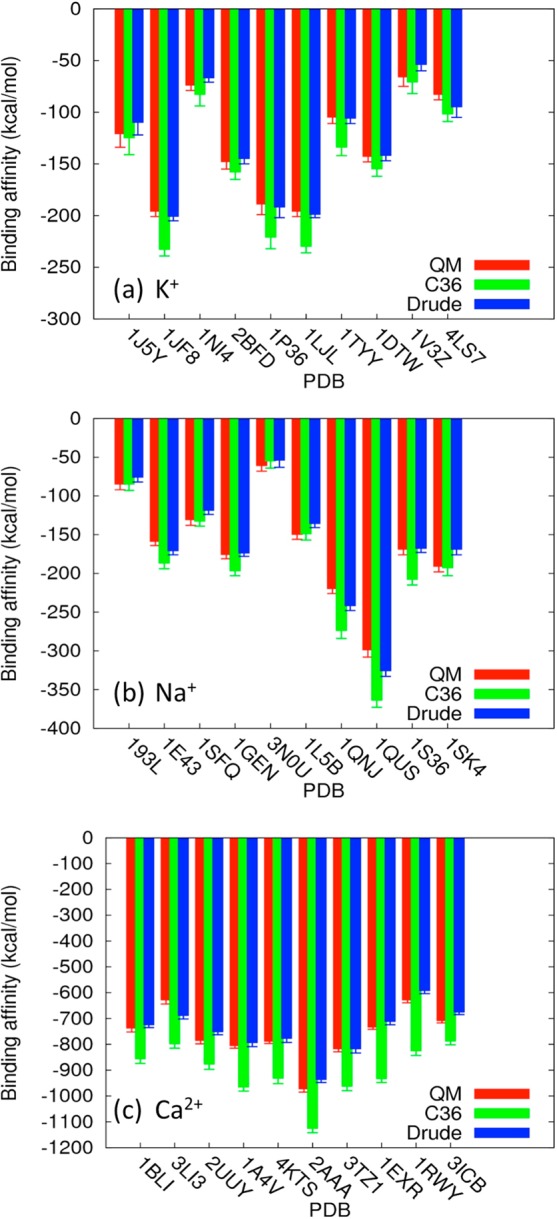
Ion-site binding energies of 30 truncated model systems. The red, green, and blue bars with statistic errors represent calculations using QM, C36, and the Drude model, respectively. (a) K+ binding proteins. (b) Na+ binding proteins (c) Ca2+ binding proteins.
Figure 7.
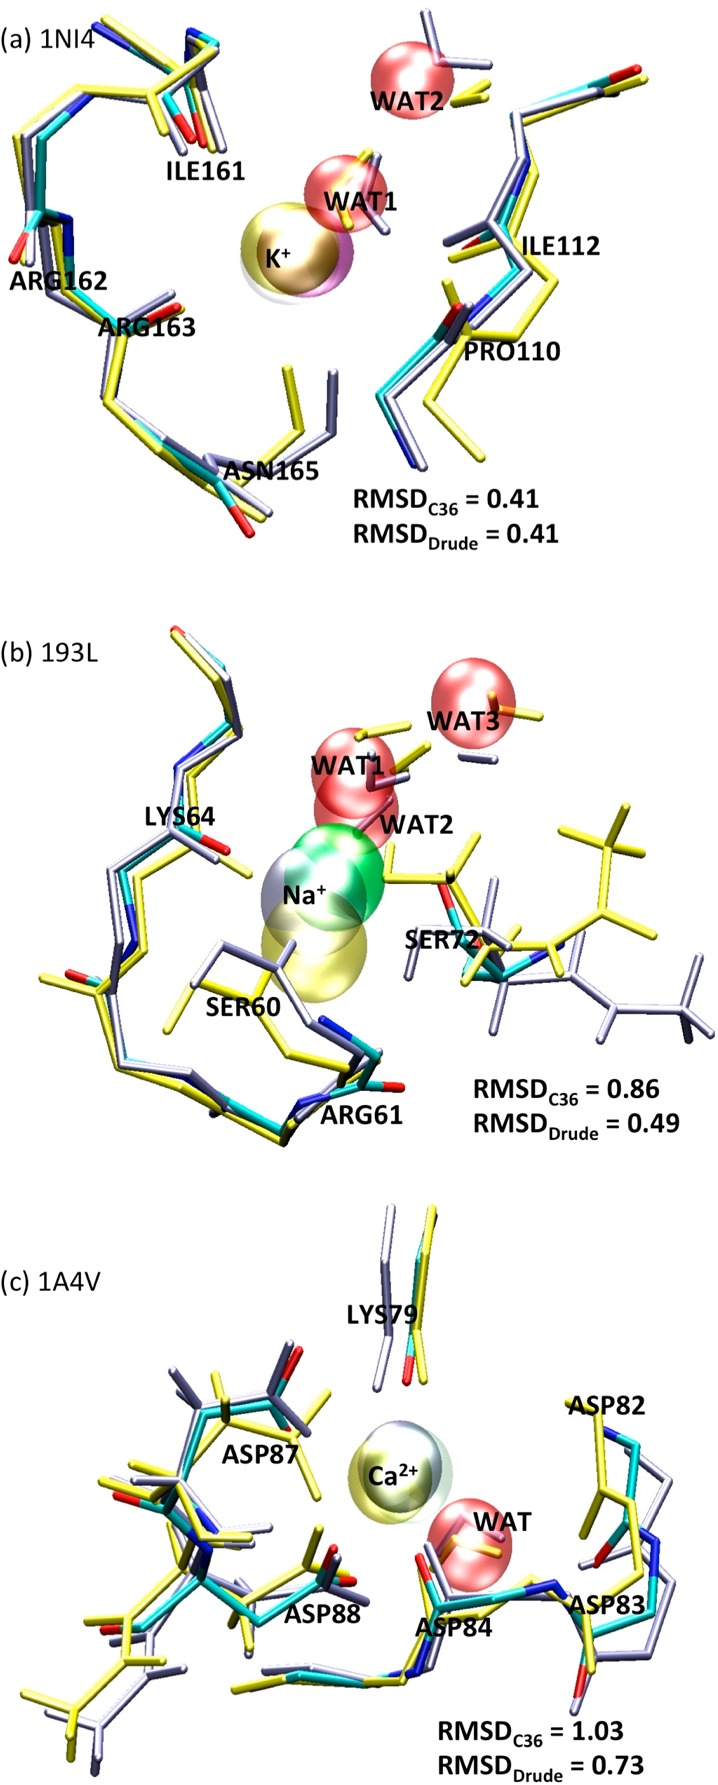
Structure alignments for proteins 1NI4 (a), 193L (b) and 1A4V (c) with K+, Na+ and Ca2+ cations, respectively. The structures are the X-ray structures (colored by atom name) and snapshots from MD full system simulations using the CHARMM C36 force field (yellow licorice stick models) and the Drude force field (light purple licorice stick models). The cations are illustrated by the VDW model. The red VDW sphere represents position of water molecules in the crystal structures. In panels a and b, the RMSD values indicate the deviations between the backbone carbonyl groups of the crystal structure and of the equilibrated structures from 4 ns MD calculations using the C36 and the Drude force field. In panel c, the RMSD indicates the deviation between the crystal structure and the MD equilibrated structure, by aligning the carbonyl group oxygen as well as the side chain of residue ASP87 and ASP88.
(1). K+–Protein Interaction Energies
Consistent with the experimental solvation energies of K+ in the neat liquids, the QM calculations yield the binding affinities for 10 binding sites in a range of −60 to −200 kcal/mol with standard deviations of about 10 kcal/mol (Figure 6a). Overall, the Drude force field reproduces all 10 of the affinities with the same uncertainties as in the QM calculations. The largest deviations between the QM and Drude calculations are found in enzymes 1V3Z and 4LS7, in which the binding affinities have been underestimated and overestimated by 12 kcal/mol, respectively. For comparison, the CHARMM36 force field with or without the NBFIX parameters for K+ systemically overestimates the absolute binding affinities by 4–37 kcal/mol (see Figures S7–9 in the SI). This overestimation and data in Table 6, where we showed that the nonpolarizable force field underestimates the solvation free energy of neutral salt KCl in NMA by 12.6 kcal/mol, suggest that the C36 force field is unable to reflect the highly polarizable nature of the Cl– anion and the interactions between K+ and NMA. In particular, to quantify the consistency between the developed models and the QM benchmarks, we computed a concordance correlation coefficient ρc between the QM calculated binding energies (EiQM) and the energies evaluated using the C36 and Drude models (Ei), for K+-binding protein 1JF8 (see Figure 8a)
| 3 |
where σ2 and μ are the variance and the average of the calculated energies, respectively. The parameter r, which is the correlation coefficient between two sets of energies, is evaluated by
| 4 |
We found that the Drude model for K+ not only yields binding energies close to those of the QM calculations, but also improves the consistency with QM, from ρc = 0.012 with the C36 force field to 0.317 with the Drude force field. The improved accuracy is also reflected in the ability of the force field to maintain the crystallographic structures. For K+ binding in protein 1NI4 (Figure 7a), both the Drude and the C36 model have carbonyl group oxygen root mean square deviation (RMSD) from the crystal structure of 0.41 Å relative to the crystal structure (obtained by aligning the backbone carbonyl group oxygen atom of the ion-binding site). A closer look to the binding site reveals that the deviations are primarily associated with the backbone carbonyl groups and a few water molecules. In the C36 and the Drude simulations, the K+ ion is in direct contact with one water molecule and the backbones of ILE161, ARG163, ASN165, and ILE112. A subtle difference is observed in the orientation of the PRO110 backbone. In the MD simulations based on the Drude force field, the PRO110 carbonyl group points toward the interior of the binding site in agreement with the crystal structure, while in the simulation based on C36 this carbonyl group flipped and points toward the exterior of the binding site. The structural difference decreases the binding energies from −67 ± 4 kcal/mol in the Drude simulation to −83 ± 11 kcal/mol in the C36 simulation.
Figure 8.
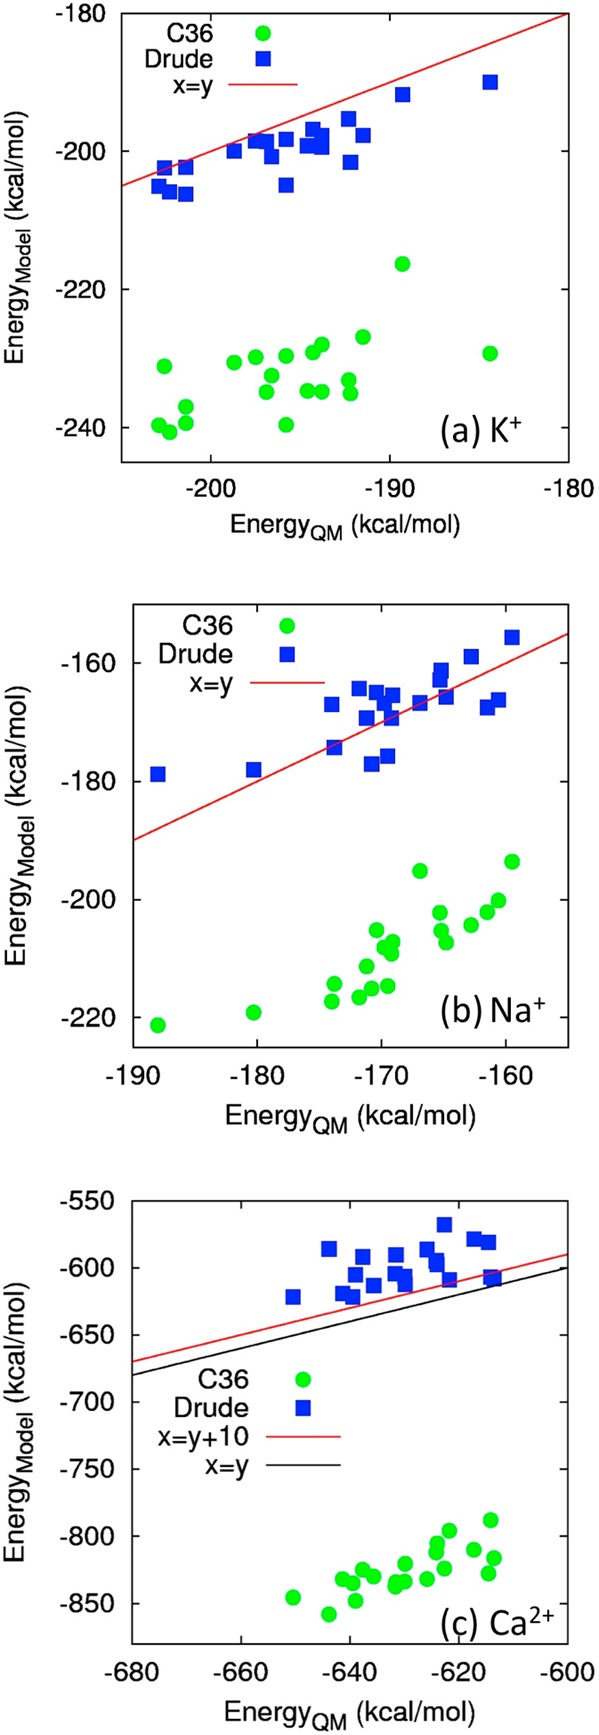
Correlation of binding energies in (a) K+-binding protein 1JF8, (b) Na+-binding protein 1S36, and (c) Ca2+-binding protein 1RWY. In each system, we used 20 snapshots from 4 ns MD simulations for computing the energies (see Methodologies) via QM (horizontal axis), and C36 and the Drude force field (vertical axis). The green dots and blue squares represent the C36 and Drude energies versus QM energies, respectively. The solid red line represents the agreement between molecular mechanics and QM binding energies. In panel c, the black line in c presents the QM binding energies; the red line presents the reference values employed in the parametrization process, which has been increased by 10 kcal/mol with respect to the black line.
(2). Na+–Protein Interaction Energies
Na+ displays stronger binding energetics than K+, as reflected by the higher absolute Na+-binding affinities of −60 to −300 kcal/mol in the QM calculations (Figure 6b). The largest affinity appears in the case of 1QUS, which has one hydroxyl oxygen atom, one carbonyl oxygen atom and nearly 4 carboxylate oxygen atoms on average within a cutoff of 3.0 Å. Overall, the Drude model shows absolute differences of the affinities from 1 to 27 kcal/mol with respect to the QM calculations. No systematic overestimation or underestimation is observed. In contrast, the C36 force field systematically overestimates the binding affinities, especially for 1QNJ and 1QUS, where the binding affinities are overestimated by >50 kcal/mol, with two exceptions, where the same affinity as computed from QM calculations was found for 193L and an underestimate by 6 kcal/mol with respect to the QM energy was found for 3N0U. In particular, we found that the concordance correlation coefficient between the C36/Drude binding energies and the QM energies for Na+-binding protein 1S36 (see Figure 8b) differs significantly with ρc = 0.365 of the Drude model from ρc = 0.027 of the C36 force field. Although both force fields yield the same binding energies of −64 kcal/mol for Na+ binding in protein 193L, the packing of the SER72 side chain differs in the Drude and the C36 simulations. As shown in Figure 7b, the C36 simulation predicts a more compact structure, which deviates further from the crystal structure than that from the Drude simulation. The SER72 hydroxyl group is 0.2 Å closer to the cation than in the Drude simulation. In terms of the packing of the backbone carbonyl group, the Drude simulation yields an RMSD of 0.49 Å relative to the crystal structure. However, the deviation between the C36 structure and the crystal structure is as large as 0.86 Å.
(3). Ca2+–Protein Interaction Energies
Among the three cations examined in the present study (αNa+ = 0.157 Å3; αK+ = 0.830 Å3; αCa2+ = 0.490 Å3), Ca2+ has the largest net charge and therefore the strongest polarizing power. The ab initio estimates (Figure 6c) indicate the binding affinities with an average of approximately −700 kcal/mol and a broad span of nearly 350 kcal/mol from the most negative value (2AAA, −973 kcal/mol) to the least negative one (1RWY, −629 kcal/mol). Overall, although the Drude force field seems to underestimate the binding affinities by about 10–40 kcal/mol for all 10 of the binding sites, it yields the binding affinities more accurately than the C36 additive force field, which overestimates the binding affinities by more than 80 kcal/mol compared to the QM calculations (Figure 9). In particular, for Ca2+-binding protein 1RWY, the C36 model yields ρc = 0.003, which is much lower than ρc = 0.578 computed from the Drude force field. In the three cases (1BLI, 1EXR, and 1RWY), the C36 force field misrepresents the binding energies over ∼170–200 kcal/mol. Interestingly, we found that in the three proteins, Ca2+ interacts with more than five oxygen atoms of the carboxylate groups (see Figure 10). The overestimated binding energies with the C36 force field are also found to increase almost linearly as a function of the number of carboxylate oxygen atoms in the crystal structures (see Table 8). Consequently, this indicates significant overbinding of Ca2+ as well as potentially distorted structures and inaccurate coordination numbers by the C36 force field due to too strong attraction between Ca2+ and electron-rich groups. However, the Drude force field yields the binding affinities for Ca2+ in agreement with the ab initio calculations, especially for 1A4V and 4KTS with the differences being only 8 and 9 kcal/mol, respectively. Note that B3LYP approximation used for the QM calculations can overestimate the absolute binding free energies for Ca2+ by about 10 kcal/mol compared with the MP2 method; and the CEP-121 basis set employed in the benchmark calculation can yield an overestimate of 10–20 kcal/mol compared with the full-electron calculations using the 6-31++G** basis set (see Table S7 and Figures S3–6). These large uncertainties even in the QM calculations imply that such a simpler approximation as the Drude model for describing approximate electron densities around the divalent ion cannot be more accurate than 10–20 kcal/mol. Therefore, an uncertainty of 10–40 kcal/mol (<6% of the averaged binding affinity) for all 10 of the Ca2+-binding sites can be considered as acceptable. Consistent with the clear differences between the C36 and Drude/QM binding energies, we observed several distinguishable features of Ca2+ binding in 1A4V during the 4 ns full-system simulation using the Drude force field and the C36 additive force field. In Figure 7c, we aligned the backbone carbonyl group oxygen atoms as well as the side chain of ASP87 and ASP88 of the equilibrated structure with the crystal structure. In the Drude simulation, the side chain of residue ASP87 and ASP88 both have one oxygen atom in direct contact with the Ca2+ cation, consistent with the crystal structure. The RMSD between the two structures is 0.73 Å. However, we found that the equilibrated C36 structure deviates from the crystal structure by an RMSD of more than 1.0 Å. The backbone of residue ASP82, and the side chain of residue ASP87 and ASP88 pack tightly around the divalent cation. Interestingly, the latter two residues are bound to Ca2+ through both of the carboxylate oxygen atoms, showing a completely different coordination from the crystal structure, and thus explaining why the C36 model significantly overestimates the Ca2+ binding affinity in 1A4V by 164 kcal/mol.
Figure 9.
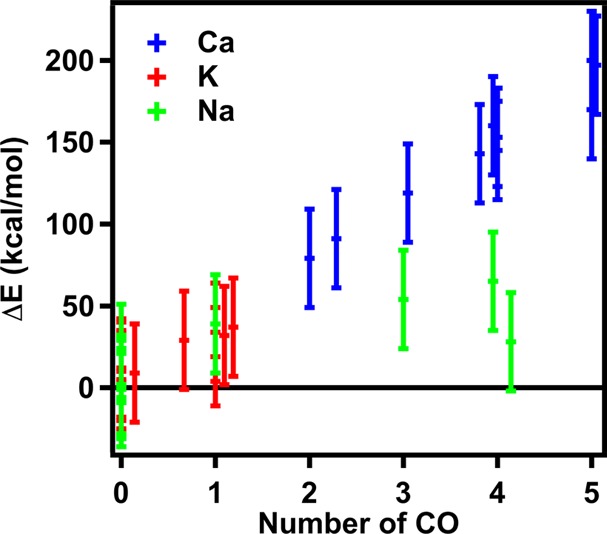
Difference between QM ion-binding energy and classical ion-binding energy versus number of carboxylate (CO) oxygen atoms in 30 ion-binding sites. The CHARMM C36 force field is employed in the classical simulations. The error bar is 20 kcal/mol for all systems.
Figure 10.
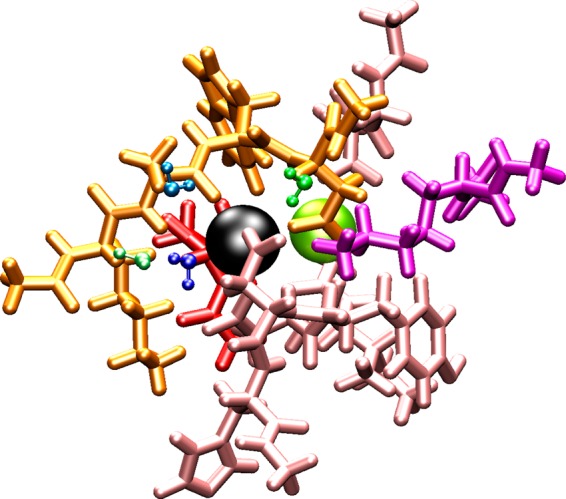
Illustration of ligands for the analysis of the nonadditive effects in Ca2+-binding protein 1BLI. The Ca2+ cation is colored in black. Lig1 to lig6 are represented by warm colors with the licorice stick models. Water1 to water5 are illustrated using the ball–stick model and represented in cool colors. The second binding ion Na+ is illustrated with the yellow-green VDW model.
Nonadditive Effects
One of the key features of a polarizable force field is its ability to account for QM nonadditive effects, which follow from the observation that the sum over individual interaction energies of each ion-ligand pairs (ΔESum) does not match the total interaction energy of the ion for the complete binding site (ΔEOverall). Hence, nonadditivity is simply quantified as the difference (ΔΔE) between ΔESum and ΔEOverall. By default, nonadditivity is absent with a nonpolarizable additive force field. To evaluate this feature of the models, we compared the K+-NMA cluster interaction energies computed by QM, the CHARMM C36 nonpolarizable force field, the Drude force field, and the AMOEBA polarizable force field.74 Table 9 shows that as the number of NMA molecules increases from 1 to 4, the magnitude of ΔΔE = ΔESum – ΔEOverall accordingly increases from 0 to 14.6 kcal/mol, where ΔESum is a sum of interaction energies for all K+ ion-NMA pairs, and ΔEOverall is the interaction energy of the overall cluster. Both the Drude and AMOEBA polarizable models perform in accord with this trend. The deviations between the Drude and QM results are +0.1, −1.8, and −3.3 kcal/mol for the systems of 2, 3, and 4 NMA molecules, respectively. These deviations are smaller than those in the AMOEBA force field, which overestimates nonadditive effects by +2.7, +3.9, and +5.5 kcal/mol for the systems of 2, 3, and 4 NMA molecules, respectively.
Table 9. K+–NMA Cluster Interaction Energies (kcal/mol) Evaluated from QM, the CHARMM C36, Drude and AMEOBA Polarizable Force Fields.74a.
| system | method | NMA1 | NMA2 | NMA3 | NMA4 | ΔESum | ΔEOverall | ΔΔE |
|---|---|---|---|---|---|---|---|---|
| 1NMA | QM | –30.8 | - | - | - | –30.8 | –30.8 | 0.0 |
| Drude | –29.8 | - | - | - | –29.8 | –29.8 | 0.0 | |
| C36 | –21.9 | - | - | - | –21.9 | –21.9 | 0.0 | |
| AMOEBA | –28.6 | - | - | - | –28.6 | –28.6 | 0.0 | |
| 2NMA | QM | –30.6 | –30.6 | - | - | –61.2 | –59.5 | 1.7 |
| Drude | –29.1 | –29.2 | - | - | –58.3 | –56.5 | 1.8 | |
| C36 | –21.8 | –21.8 | - | - | –43.6 | –43.6 | 0.0 | |
| AMOEBA | –28.1 | –28.1 | - | - | –56.2 | –51.6 | 4.4 | |
| 3NMA | QM | –30.5 | –30.5 | –30.5 | - | –91.5 | –84.2 | 7.3 |
| Drude | –28.8 | –28.7 | –28.6 | - | –86.1 | –80.4 | 5.7 | |
| C36 | –22.2 | –21.5 | –21.4 | - | –65.1 | –65.0 | 0.1* | |
| AMOEBA | –27.7 | –27.8 | –27.6 | - | –83.0 | –71.8 | 11.2 | |
| 4NMA | QM | –29.6 | –29.6 | –29.5 | –29.5 | –118.2 | –103.6 | 14.6 |
| Drude | –27.8 | –27.8 | –27.6 | –27.5 | –110.5 | –100.2 | 10.3 | |
| C36 | –21.2 | –21.2 | –20.3 | –20.3 | –83.0 | –83.0 | 0.0 | |
| AMOEBA | –27.5 | –27.5 | –27.1 | –27.1 | –109.1 | –89.0 | 20.1 |
ΔESum is a sum of interaction energies for all individual K+-ion–NMA pairs. ΔEOverall is the interaction energy of the overall cluster. The non-additive energy ΔΔE = ΔESum – ΔEOverall. *The 0.1 kcal difference is due to round off error.
To further assess nonadditive effects produced by the new Drude force field, we applied the same analysis to some ion-binding sites, which have 4–6 individual ligands. Each ion-binding site was then dissected into smaller fragments for computing the binding interaction energies between a cation and all individual fragments. One fragment can be a peptide, or a single water molecule, or another binding ion as illustrated in Figure 10 (specifically, the binding site of 1E43 has two Ca2+ ions, the binding site of 1BLI has another Na+, and the binding sites of 1GEN and 1S36 have a chloride anion (see Table 8)). Tables 10, 11, and 12 report the nonadditive effects in 1JF8, 1LJL, 1E43, 1L5B, 1BLI, and 3L3I. For example, in the K+-binding enzyme 1JF8, the QM binding energy ΔEOverall is −196 kcal/mol and ΔESum is −239 kcal/mol, thus rendering a value of the nonadditivity, ΔΔE = −43 kcal/mol, which accounts for 18% of ΔESum. Obviously, nonadditivity with the CHARMM C36 force field is zero by construction. Remarkably, nonadditive effects with the Drude force field for this binding site differs by only 6 kcal/mol from the QM nonadditivity value. Similar consistency of the nonadditive effects is found for other monovalent ion-binding sites. Nonadditive effects become more pronounced in the Ca2+ binding proteins, where they contribute approximately 20–30% of the accumulated binding energies in both the QM and Drude calculations. The magnitude of nonadditive effects explains the difficulties in approximating electron densities around a divalent ion on the basis of effective fixed-charge models. The ability of the Drude model to successfully reproduce the many-body electrostatic nonadditive effects present in the QM is a real breakthrough in the efforts to accurately represent ion–protein interactions.
Table 10. Comparison of Interaction Energies for K+ Ion-Binding Proteins, Using QM Calculations, the C36 Additive Force Field, and the Drude Polarizable Force Fielda.
| 1JF8 |
1LJL |
|||||
|---|---|---|---|---|---|---|
| QM | C36 | Drude | QM | C36 | Drude | |
| ΔELig1 | –21 | –18 | –22 | –22 | –19 | –21 |
| ΔELig2 | –6 | –3 | –4 | –2 | –1 | –5 |
| ΔELig3 | –82 | –83 | –75 | –78 | –78 | –76 |
| ΔELig4 | –22 | –16 | –24 | –24 | –19 | –22 |
| ΔELig5 | –98 | –102 | –103 | –99 | –103 | –102 |
| ΔELig6 | N/A | N/A | N/A | N/A | N/A | N/A |
| ΔEW1 | 3 | 3 | –3 | 3 | 3 | 2 |
| ΔEW2 | 2 | 2 | –4 | –1 | –1 | –3 |
| ΔEW3 | –2 | –1 | –2 | –5 | –3 | –5 |
| ΔEW4 | –1 | –1 | –2 | 2 | 2 | 1 |
| ΔEW5 | –13 | –12 | –11 | –12 | –11 | –12 |
| ΔEIon | N/A | N/A | N/A | N/A | N/A | N/A |
| ΔESum | –239 | –233 | –250 | –237 | –230 | –243 |
| ΔEOverall | –196 | –233 | –201 | –196 | –230 | –201 |
| ΔΔE | –43 | 0 | –49 | –41 | 0 | –42 |
Lig1 to Lig6 represent different peptide segments in the truncated proteins. W1 to W5 represent different water molecules. ΔESum is the sum of interaction energies for all individual ion–ligand, ion–water, and ion–ion pairs. ΔEOverall is the overall QM interaction energy by treating all the ligands, water molecules and other ions as a whole system. The non-additive energy ΔΔE = ΔESum – ΔEOverall. All values in kcal/mol are averaged for 20 frames extracted from 4 ns simulations.
Table 11. Comparison of Interaction Energies for Na+ Ion-Binding Proteins, Using QM Calculations, the C36 Additive Force Field, and the Drude Polarizable Force Fielda.
| 1E43 |
1L5B |
|||||
|---|---|---|---|---|---|---|
| QM | C36 | Drude | QM | C36 | Drude | |
| ΔELig1 | –108 | –101 | –105 | –35 | –22 | –27 |
| ΔELig2 | –109 | –110 | –109 | –44 | –35 | –38 |
| ΔELig3 | –128 | –133 | –124 | –41 | –30 | –33 |
| ΔELig4 | –178 | –179 | –175 | –39 | –30 | –35 |
| ΔELig5 | –3 | 3 | –4 | N/A | N/A | N/A |
| ΔELig6 | N/A | N/A | N/A | N/A | N/A | N/A |
| ΔEW1 | 1 | 2 | –2 | –2 | –2 | –2 |
| ΔEW2 | 1 | 2 | 6 | –1 | 0 | –1 |
| ΔEW3 | 7 | 7 | 4 | –5 | –4 | –5 |
| ΔEW4 | 3 | 3 | 2 | –18 | –14 | –15 |
| ΔEW5 | –1 | –1 | –1 | –13 | –11 | –11 |
| ΔEIon | 320 | 320 | 319 | N/A | N/A | N/A |
| ΔESum | –195 | –187 | –189 | –198 | –149 | –167 |
| ΔEOverall | –159 | –187 | –171 | –150 | –149 | –136 |
| ΔΔE | –36 | 0 | –16 | –48 | 0 | –29 |
Details are the same as in Table 10.
Table 12. Comparison of Interaction Energies for Ca2+ Ion-Binding Proteins, Using QM Calculations, the C36 Additive Force Field, and the Drude Polarizable Force Fielda.
| 1BLI |
3LI3 |
|||||
|---|---|---|---|---|---|---|
| QM | C36 | Drude | QM | C36 | Drude | |
| ΔELig1 | –287 | –297 | –317 | –278 | –281 | –321 |
| ΔELig2 | –218 | –168 | –221 | –28 | –16 | –20 |
| ΔELig3 | –173 | –115 | –121 | –199 | –159 | –166 |
| ΔELig4 | –444 | –456 | –461 | –68 | –33 | –60 |
| ΔELig5 | 73 | 101 | 89 | –272 | –264 | –280 |
| ΔELig6 | N/A | N/A | N/A | –9 | 20 | 6 |
| ΔEW1 | –2 | –1 | –2 | –8 | –2 | –8 |
| ΔEW2 | –3 | 2 | –5 | –27 | –22 | –21 |
| ΔEW3 | –22 | –17 | –25 | –23 | –20 | –30 |
| ΔEW4 | –17 | –13 | –19 | –58 | –48 | –50 |
| ΔEW5 | 4 | 6 | 3 | –40 | –31 | –34 |
| ΔEIon | 159 | 158 | 158 | N/A | N/A | N/A |
| ΔESum | –930 | –799 | –921 | –1010 | –858 | –985 |
| ΔEOverall | –629 | –799 | –689 | –738 | –857 | –725 |
| ΔΔE | –301 | 0 | –232 | –272 | –1 | –260 |
Details are the same as in Table 10.
General Implications for MD Simulations of Metalloproteins
All conclusions derived from MD simulations of cation interactions with proteins are dependent on the accuracy of the underlying potential functions. The conformational sampling, selection of low energy states and therefore the time-evolution of solvated metalloproteins are essentially limited by the accuracy of the potential energy surfaces and by statistical availability. New simulation techniques, software and hardware solutions are pushing time-scales into the micro- and even milli-second range, but one must seek a balance between more accurate but more expensive representations of the energy surfaces, and the obligation to adequately sample the relevant configurations. We believe that the present study clarifies the limitations of existing additive force fields in studies of metalloproteins and exposes possible sources of systematic error. According to the energy mapping of 30 protein sites, there is an extremely sharp variation in accuracy between an additive force-field and ab initio data with an increase in (a) cation and/or site net charge, (b) complexity of the electrostatic environment and chemical types of coordinating ligands. Interestingly, the same can be concluded from comparative studies of simple liquid mimetic systems such as ethanol and N-methylacetamide as reported in this and previous studies.23 This can be attributed in part to the nonadditive effects, but another source of error is an assumption on the transferability of ion parameters developed for reproducing the solvation in water to simulations of metalloprotein sites. The findings reported in this paper warrant the revisitation and validation of some previous conclusions about the transport mechanisms or selective binding to metalloprotein sites.
Conclusions
We have refined the Drude polarizable force field to accurately represent ion–protein interactions. Pairwise-specific nonbonded parameters and charge-screening functions were systematically optimized to reproduce a representative set of target data comprising ab initio calculations and experimental thermodynamic properties. The resulting force field accurately models the interactions of K+, Na+, Ca2+, and Cl– with the different polar groups present in all proteins, including the backbone amide linkage, and the amino acid side chains that contain hydroxyl, carboxylate or carboxamide groups. By carefully calibrating the force field parameters for a set of model systems on the basis of geometrical and thermodynamic properties and ab initio calculations, the resulting force field is likely to remain accurate for a wide range of situations. We also demonstrated that the refined Drude ion–protein models successfully reproduce consistent energetics in 30 different ion-bound enzymatic proteins in comparison with ab initio calculations, whereas the additive models such as the C36 additive force field can fail. The accuracy is clearly improved in the case where the many-body polarization effect is pronounced, for example, in the Ca2+ binding proteins. Remarkably, we showed that the many-body nonadditive effects found in QM are successfully accounted for in the Drude model for more accurate descriptions of the ion–protein interactions than the nonadditive force fields, and the Drude model is substantially less computationally expensive than QM calculations for simulating a variety of biological systems.
Since the ion–protein interactions are significantly improved, the simulation approaches using the Drude force field will be viable, inexpensive, and robust. The force field maintains the format of the CHARMM force field, so it can be used in many simulation softwares such as NAMD, AMBER, etc., while effectively modulating the pair-specific interactions and describing well the dynamical changes of electron densities. Our study leaves little doubt that even the most carefully parametrized additive force-field will meet with increasing difficulties in reproducing correctly the ion–site interaction energetics for diverse electrostatic environments. The nonadditive effects in the description of divalent ion/protein site interactions lead to up to 15% adjustment in interaction energetics compared to that of well-parametrized force fields such as CHARMM C36. In the situation where the electrostatic environment has to dynamically change in response to ion binding, these effects become crucial to the understanding of metalloprotein function.
Systematically assessing and enhancing the accuracy, we believe that the present study will facilitate more advanced improvements and innovations in the fields of computational biophysics and biochemistry for studies of ion channels, transporters, enzymes, and so on. This study also outlines a novel protocol for comprehensively constructing and evaluating a force field for modeling macromolecules such as a force field for QM/MM SCC-DFTB embedded in CHARMM. The protocol incorporates training of parameter sets on a large number of biological systems, whose properties are diverse. In that protocol, additional parameters can be introduced based on specific physical properties, either by utilizing customized parameter optimization tools or with readily available gadgets, for example, the General Automated Atomic Model Parameterization (GAAMP) web portal (URL: http://gaamp.lcrc.anl.gov/).
Acknowledgments
This work was supported by the National Science Foundation through the grant GM-072558 to B.R. The work in SYN and DRS groups was supported by the Natural Sciences and Engineering Research Council of Canada (NSERC) (Discovery Grant RGPIN-315019 to S.Y.N. and RGPIN-10174 to D.R.S.) and Alberta Innovates Technology Futures (AITF) Strategic Chair in BioMolecular Simulations (Centre for Molecular Simulation). S.N. is a Canadian Institute for Health Research New Investigator, and an Alberta Innovates Health Solutions (AIHS) Scholar. The calculations were performed using computational resources at the Laboratory Computing Resource Center (LCRC) of the Argonne National Lab of the United States, the Extreme Science and Engineering Discovery Environment (XSEDE) network, and the TNK cluster supported by the Canadian Foundation for Innovation and the Compute Canada/WestGrid supercomputer center.
Supporting Information Available
Selection of theory/level in ab initio calculations. This material is available free of charge via the Internet at http://pubs.acs.org.
Author Contributions
⊥ Denotes equal contribution.
The authors declare no competing financial interest.
Supplementary Material
References
- MacKerell A. D. Jr; Bashford D.; Bellott M.; Dunbrack R. L. Jr; Evanseck J. D.; Field M. J.; Fischer S.; Gao J.; Guo H.; Ha S.; et al. All-atom empirical potential for molecular modeling and dynamics studies of proteins. J. Phys. Chem. B 1998, 102183586–3616. [DOI] [PubMed] [Google Scholar]
- Oostenbrink C.; Villa A.; Mark A. E.; Van Gunsteren W. F. A biomolecular force field based on the free enthalpy of hydration and solvation: The GROMOS force-field parameter sets 53A5 and 53A6. J. Comput. Chem. 2004, 25131656–1676. [DOI] [PubMed] [Google Scholar]
- Cornell W. D.; Cieplak P.; Bayly C. I.; Gould I. R.; Merz K. M.; Ferguson D. M.; Spellmeyer D. C.; Fox T.; Caldwell J. W.; Kollman P. A. A second generation force field for the simulation of proteins, nucleic acids, and organic molecules. J. Am. Chem. Soc. 1995, 117195179–5197. [Google Scholar]
- Jorgensen W. L.; Maxwell D. S.; Tirado-Rives J. Development and testing of the OPLS all-atom force field on conformational energetics and properties of organic liquids. J. Am. Chem. Soc. 1996, 1184511225–11236. [Google Scholar]
- Durrant J. D.; McCammon J. A. Molecular dynamics simulations and drug discovery. BMC Biol. 2011, 9171. [DOI] [PMC free article] [PubMed] [Google Scholar]
- Gordon M. S.; Schmidt M. W. In Theory and Applications of Computational Chemistry: The First Forty Years; Dykstra C. E., Frenking G., Kim K. S.,Scuseria G. E., Eds.; Elsevier B.V.: Amsterdam, 2005; pp 1167–1189. [Google Scholar]
- Riahi S.; Roux B.; Rowley C. N. QM/MM molecular dynamics simulations of the hydration of Mg (II) and Zn (II) ions. Can. J. Chem. 2013, 917552–558. [Google Scholar]
- Lev B.; Roux B.; Noskov S. Y. Relative free energies for hydration of monovalent ions from QM and QM/MM simulations. J. Chem. Theory Comput. 2013, 994165–4175. [DOI] [PubMed] [Google Scholar]
- Ji C.; Mei Y.; Zhang J. Z. H. Developing Polarized Protein-Specific Charges for Protein Dynamics: MD Free Energy Calculation of pKa Shifts for Asp26 Asp20 in Thioredoxin. Biophys. J. 2008, 9531080–1088. [DOI] [PMC free article] [PubMed] [Google Scholar]
- Harder E.; MacKerell A. D. Jr; Roux B. Many-Body Polarization Effects and the Membrane Dipole Potential. J. Am. Chem. Soc. 2009, 13182760–2761. [DOI] [PMC free article] [PubMed] [Google Scholar]
- Berendsen H. J. C.; Grigera J. R.; Straatsma T. P. The missing term in effective pair potentials. J. Phys. Chem. 1987, 91246269–6271. [Google Scholar]
- Ponder J. W.; Wu C.; Ren P.; Pande V. S.; Chodera J. D.; Schnieders M. J.; Haque I.; Mobley D. L.; Lambrecht D. S.; DiStasio R. A. Jr. Current status of the AMOEBA polarizable force field. J. Phys. Chem. B 2010, 11482549–2564. [DOI] [PMC free article] [PubMed] [Google Scholar]
- Lamoureux G.; MacKerell A. D. Jr; Roux B. A simple polarizable model of water based on classical Drude oscillators. J. Chem. Phys. 2003, 119105185–5197. [Google Scholar]
- Lamoureux G.; Roux B. Modeling induced polarization with classical Drude oscillators: Theory and molecular dynamics simulation algorithm. J. Chem. Phys. 2003, 11963025–3039. [Google Scholar]
- Anisimov V. M.; Lamoureux G.; Vorobyov I. V.; Huang N.; Roux B.; MacKerell A. D. Jr. Determination of Electrostatic Parameters for a Polarizable Force Field Based on the Classical Drude Oscillator. J. Chem. Theory Comput. 2004, 11153–168. [DOI] [PubMed] [Google Scholar]
- Harder E.; Anisimov V. M.; Vorobyov I. V.; Lopes P. E. M.; Noskov S. Y.; MacKerell A. D. Jr; Roux B. Atomic Level Anisotropy in the Electrostatic Modeling of Lone Pairs for a Polarizable Force Field Based on the Classical Drude Oscillator. J. Chem. Theory Comput. 2006, 261587–1597. [DOI] [PubMed] [Google Scholar]
- Harder E.; Anisimov V. M.; Whitfield T.; MacKerell A. D. Jr; Roux B. Understanding the Dielectric Properties of Liquid Amides from a Polarizable Force Field. J. Phys. Chem. B 2008, 112113509–3521. [DOI] [PMC free article] [PubMed] [Google Scholar]
- Lamoureux G.; Harder E.; Vorobyov I. V.; Roux B.; MacKerell A. D. Jr. A polarizable model of water for molecular dynamics simulations of biomolecules. Chem. Phys. Lett. 2006, 4181–3245–249. [Google Scholar]
- Kozack R. E.; Jordan P. C. Polarizability effects in a four-charge model for water. J. Chem. Phys. 1992, 9643120–3130. [Google Scholar]
- Dick B. G. Jr; Overhauser A. W. Theory of the dielectric constants of alkali halide crystals. Phys. Rev. 1958, 112190. [Google Scholar]
- Yu H.; van Gunsteren W. F. Charge-on-spring polarizable water models revisited: from water clusters to liquid water to ice. J. Chem. Phys. 2004, 121199549–9564. [DOI] [PubMed] [Google Scholar]
- Yu H.; Whitfield T. W.; Harder E.; Lamoureux G.; Vorobyov I.; Anisimov V. M.; MacKerell A. D. Jr; Roux B. Simulating Monovalent and Divalent Ions in Aqueous Solution Using a Drude Polarizable Force Field. J. Chem. Theory Comput. 2010, 63774–786. [DOI] [PMC free article] [PubMed] [Google Scholar]
- Yu H.; Mazzanti C. L.; Whitfield T. W.; Koeppe R. E.; Andersen O. S.; Roux B. A Combined Experimental and Theoretical Study of Ion Solvation in Liquid N-Methylacetamide. J. Am. Chem. Soc. 2010, 1323110847–10856. [DOI] [PMC free article] [PubMed] [Google Scholar]
- Noskov S. Y.; Lamoureux G.; Roux B. Molecular dynamics study of hydration in ethanol–water mixtures using a polarizable force field. J. Phys. Chem. B 2005, 109146705–6713. [DOI] [PubMed] [Google Scholar]
- Huang J.; Lopes P. E. M.; Roux B.; MacKerell A. D. Jr. Recent Advances in Polarizable Force Fields for Macromolecules: Microsecond Simulations of Proteins Using the Classical Drude Oscillator Model. J. Phys. Chem. Lett. 2014, 5183144–3150. [DOI] [PMC free article] [PubMed] [Google Scholar]
- Ueda E. K. M.; Gout P. W.; Morganti L. Current and prospective applications of metal ion–protein binding. J. Chromatogr. A 2003, 98811–23. [DOI] [PubMed] [Google Scholar]
- Record M. T.; Anderson C. F.; Lohman T. M. Thermodynamic analysis of ion effects on the binding and conformational equilibria of proteins and nucleic acids: The roles of ion association or release, screening, and ion effects on water activity. Q. Rev. Biophys. 1978, 1102103–178. [DOI] [PubMed] [Google Scholar]
- Baldwin R. L. How Hofmeister ion interactions affect protein stability. Biophys. J. 1996, 7142056–2063. [DOI] [PMC free article] [PubMed] [Google Scholar]
- Assche F. V.; Clijsters H. Effects of metals on enzyme activity in plants. Plant, Cell Environ. 1990, 133195–206. [Google Scholar]
- Rembert K. B.; Paterová J.; Heyda J.; Hilty C.; Jungwirth P.; Cremer P. S. Molecular mechanisms of ion-specific effects on proteins. J. Am. Chem. Soc. 2012, 1342410039–10046. [DOI] [PubMed] [Google Scholar]
- MacKerell A. D. Jr; Feig M.; Brooks C. L. Extending the treatment of backbone energetics in protein force fields: Limitations of gas-phase quantum mechanics in reproducing protein conformational distributions in molecular dynamics simulations. J. Comput. Chem. 2004, 25111400–1415. [DOI] [PubMed] [Google Scholar]
- Drude P.The Theory of Optics; Courier Dover Publications: Mineola, NY, 1925. [Google Scholar]
- Deng Y.; Roux B. Hydration of amino acid side chains: nonpolar and electrostatic contributions calculated from staged molecular dynamics free energy simulations with explicit water molecules. J. Phys. Chem. B 2004, 1084216567–16576. [Google Scholar]
- Kumar S.; Rosenberg J. M.; Bouzida D.; Swendsen R. H.; Kollman P. A. The weighted histogram analysis method for free-energy calculations on biomolecules. I. The method. J. Comput. Chem. 1992, 1381011–1021. [Google Scholar]
- Souaille M.; Roux B. t. Extension to the weighted histogram analysis method: Combining umbrella sampling with free energy calculations. Comput. Phys. Commun. 2001, 135140–57. [Google Scholar]
- Kastenholz M. A.; Hünenberger P. H. Computation of methodology-independent ionic solvation free energies from molecular simulations. I. The electrostatic potential in molecular liquids. J. Chem. Phys. 2006, 12412124106. [DOI] [PubMed] [Google Scholar]
- Kastenholz M. A.; Hünenberger P. H. Computation of methodology-independent ionic solvation free energies from molecular simulations. II. The hydration free energy of the sodium cation. J. Chem. Phys. 2006, 12422224501. [DOI] [PubMed] [Google Scholar]
- Brooks B. R.; Bruccoleri R. E.; Olafson B. D.; States D. J.; Swaminathan S.; Karplus M. CHARMM: A program for macromolecular energy, minimization, and dynamics calculations. J. Comput. Chem. 1983, 42187–217. [Google Scholar]
- Lopes P. E. M.; Huang J.; Shim J.; Luo Y.; Li H.; Roux B.; MacKerell A. D. Jr. Polarizable Force Field for Peptides and Proteins Based on the Classical Drude Oscillator. J. Chem. Theory Comput. 2013, 9125430–5449. [DOI] [PMC free article] [PubMed] [Google Scholar]
- de Leeuw S. W.; Perram J. W.; Smith E. R. Simulation of electrostatic systems in periodic boundary conditions. I. Lattice sums and dielectric constants. Proc. R. Soc. London. A: Math. Phys. Sci. 1980, 373175227–56. [Google Scholar]
- Martyna G. J.; Tobias D. J.; Klein M. L. Constant pressure molecular dynamics algorithms. J. Chem. Phys. 1994, 10154177–4189. [Google Scholar]
- Nosé S. A molecular dynamics method for simulations in the canonical ensemble. Mol. Phys. 1984, 522255–268. [Google Scholar]
- Hoover W. G. Canonical dynamics: Equilibrium phase-space distributions. Phys. Rev. A 1985, 3131695. [DOI] [PubMed] [Google Scholar]
- Ryckaert J.-P.; Ciccotti G.; Berendsen H. J. C. Numerical integration of the cartesian equations of motion of a system with constraints: Molecular dynamics of n-alkanes. J. Comput. Phys. 1977, 233327–341. [Google Scholar]
- Ewald P. P. Die Berechnung optischer und elektrostatischer Gitterpotentiale. Ann. Phys. 1921, 3693253–287. [Google Scholar]
- Berman H. M.; Westbrook J.; Feng Z.; Gilliland G.; Bhat T. N.; Weissig H.; Shindyalov I. N.; Bourne P. E. The protein data bank. Nucleic Acids Res. 2000, 281235–242. [DOI] [PMC free article] [PubMed] [Google Scholar]
- Jo S.; Kim T.; Iyer V. G.; Im W. CHARMM-GUI: A web-based graphical user interface for CHARMM. J. Comput. Chem. 2008, 29111859–1865. [DOI] [PubMed] [Google Scholar]
- Jorgensen W. L.; Chandrasekhar J.; Madura J. D.; Impey R. W.; Klein M. L. Comparison of simple potential functions for simulating liquid water. J. Chem. Phys. 1983, 792926–935. [Google Scholar]
- Phillips J. C.; Braun R.; Wang W.; Gumbart J.; Tajkhorshid E.; Villa E.; Chipot C.; Skeel R. D.; Kale L.; Schulten K. Scalable molecular dynamics with NAMD. J. Comput. Chem. 2005, 26161781–1802. [DOI] [PMC free article] [PubMed] [Google Scholar]
- Feller S. E.; Zhang Y.; Pastor R. W.; Brooks B. R. Constant pressure molecular dynamics simulation: The Langevin piston method. J. Chem. Phys. 1995, 103114613–4621. [Google Scholar]
- Xantheas S. S. On the importance of the fragment relaxation energy terms in the estimation of the basis set superposition error correction to the intermolecular interaction energy. J. Chem. Phys. 1996, 104218821–8824. [Google Scholar]
- Frisch M.; Trucks G. W.; Schlegel H. B.; Scuseria G. E.; Robb M. A.; Cheeseman J. R.; Scalmani G.; Barone V.; Mennucci B.; Petersson G. A. Gaussian 09, Revision A. 02, Gaussian. Inc., Wallingford, CT 2009, 200.
- Schmidt M. W.; Baldridge K. K.; Boatz J. A.; Elbert S. T.; Gordon M. S.; Jensen J. H.; Koseki S.; Matsunaga N.; Nguyen K. A.; Su S. General atomic and molecular electronic structure system. J. Comput. Chem. 1993, 14111347–1363. [Google Scholar]
- Davidson E. R.; Feller D. Basis set selection for molecular calculations. Chem. Rev. 1986, 864681–696. [Google Scholar]
- Becke A. D. A new mixing of Hartree–Fock and local density-functional theories. J. Chem. Phys. 1993, 9821372–1377. [Google Scholar]
- Lee C.; Yang W.; Parr R. G. Development of the Colle–Salvetti correlation-energy formula into a functional of the electron density. Phys. Rev. B 1988, 372785–789. [DOI] [PubMed] [Google Scholar]
- Stevens W. J.; Basch H.; Krauss M. Compact effective potentials and efficient shared-exponent basis sets for the first-and second-row atoms. J. Chem. Phys. 1984, 81126026–6033. [Google Scholar]
- Stevens W. J.; Krauss M.; Basch H.; Jasien P. G. Relativistic compact effective potentials and efficient, shared-exponent basis sets for the third-, fourth-, and fifth-row atoms. Can. J. Chem. 1992, 702612–630. [Google Scholar]
- Cundari T. R.; Stevens W. J. Effective core potential methods for the lanthanides. J. Chem. Phys. 1993, 9875555–5565. [Google Scholar]
- Becke A. D. Density-functional thermochemistry. III. The role of exact exchange. J. Chem. Phys. 1993, 9875648–5652. [Google Scholar]
- Basch H. Bond dissociation energies in organometallic compounds. Inorg. Chim. Acta 1996, 2521265–279. [Google Scholar]
- Rogalewicz F.; Ohanessian G.; Gresh N. Interaction of neutral and zwitterionic glycine with Zn2+ in gas phase: Ab initio and SIBFA molecular mechanics calculations. J. Comput. Chem. 2000, 2111963–973. [Google Scholar]
- Krauss M. Ab initio structure of the active site of phosphotriesterase. J. Chem. Information and Comput. Sci. 2001, 4118–17. [DOI] [PubMed] [Google Scholar]
- Wang Y.; Perdew J. P. Correlation hole of the spin-polarized electron gas, with exact small-wave-vector and high-density scaling. Phys. Rev. B 1991, 4424298–307. [DOI] [PubMed] [Google Scholar]
- Hay P. J.; Wadt W. R. Ab initio effective core potentials for molecular calculations. Potentials for K to Au including the outermost core orbitals. J. Chem. Phys. 1985, 821299–310. [Google Scholar]
- Beck T. L. A local entropic signature of specific ion hydration. J. Phys. Chem. B 2011, 115329776–9781. [DOI] [PubMed] [Google Scholar]
- Siu F. M.; Ma N. L.; Tsang C. W. Cation−π interactions in sodiated phenylalanine complexes: Is phenylalanine in the charge-solvated or zwitterionic form?. J. Am. Chem. Soc. 2001, 123143397–3398. [DOI] [PubMed] [Google Scholar]
- Tsang Y.; Siu F. M.; Ho C. S.; Ma N. L.; Tsang C. W. Experimental validation of theoretical potassium and sodium cation affinities of amides by mass spectrometric kinetic method measurements. Rapid Commun. Mass Spectrom. 2004, 183345–355. [DOI] [PubMed] [Google Scholar]
- Klassen J. S.; Anderson S. G.; Blades A. T.; Kebarle P. Reaction enthalpies for M+ L= M++ L, where M+= Na+ and K+ and L = acetamide, N-methylacetamide, N,N-dimethylacetamide, glycine, and glycylglycine, from determinations of the collision-induced dissociation thresholds. J. Phys. Chem. 1996, 1003314218–14227. [Google Scholar]
- Roux B.; Berneche S.; Im W. Ion channels, permeation, and electrostatics: Insight into the function of KcsA. Biochemistry 2000, 394413295–13306. [DOI] [PubMed] [Google Scholar]
- Lide D. R.CRC Handbook of Chemistry and Physics; CRC Press: Boca Raton, FL, 2004. [Google Scholar]
- Case B.; Parsons R. The real free energies of solvation of ions in some non-aqueous and mixed solvents. Trans. Faraday Soc. 1967, 63, 1224–1239. [Google Scholar]
- Li L.; Li C.; Zhang Z.; Alexov E. On the dielectric “constant” of proteins: Smooth dielectric function for macromolecular modeling and its implementation in Delphi. J. Chem. Theory Comput. 2013, 942126–2136. [DOI] [PMC free article] [PubMed] [Google Scholar]
- Ren P.; Wu C.; Ponder J. W. Polarizable atomic multipole-based molecular mechanics for organic molecules. J. Chem. Theory Comput. 2011, 7103143–3161. [DOI] [PMC free article] [PubMed] [Google Scholar]
Associated Data
This section collects any data citations, data availability statements, or supplementary materials included in this article.