Abstract
The immunological mechanisms mediated by regulatory cytokine interleukin (IL)-35 are unclear in systemic lupus erythematosus (SLE). We investigated the frequency of CD4+CD25+forkhead box protein 3 (FoxP3)+ regulatory T (Treg) and IL-10+ regulatory B (Breg) cells and related immunoregulatory mechanisms in a female Murphy Roths Large (MRL)/lpr mouse model of spontaneous lupus-like disease, with or without IL-35 treatment. A remission of histopathology characteristics of lupus flare and nephritis was observed in the MRL/lpr mice upon IL-35 treatment. Accordingly, IL-35 and IL-35 receptor subunits (gp130 and IL-12Rβ2) and cytokines of MRL/lpr and BALB/c mice (normal controls) were measured. The increased anti-inflammatory cytokines and decreased proinflammatory cytokines were possibly associated with the restoration of Treg and Breg frequency in MRL/lpr mice with IL-35 treatment, compared to phosphate-buffered saline (PBS) treatment. mRNA expressions of Treg-related FoxP3, IL-35 subunit (p35 and EBI3) and soluble IL-35 receptor subunit (gp130 and IL12Rβ2) in splenic cells were up-regulated significantly in IL-35-treated mice. Compared with the PBS treatment group, IL-35-treated MRL/lpr mice showed an up-regulation of Treg-related genes and the activation of IL-35-related intracellular Janus kinase/signal transducer and activator of transcription signal pathways, thereby indicating the immunoregulatory role of IL-35 in SLE. These in vivo findings may provide a biochemical basis for further investigation of the regulatory mechanisms of IL-35 for the treatment of autoimmune-mediated inflammation.
Keywords: cytokines, interleukin-35, regulatory B cells, regulatory T cells, systemic lupus erythematosus
Introduction
Systemic lupus erythematosus (SLE) is a complex multi-system chronic inflammatory disease that is characterized by the breakdown of immune tolerance of B and T cells to self-antigens, resulting in the production of autoantibodies, followed by the formation of immune complexes and development of damage to multiple organs, such as the kidney, skin, blood vessels and central nervous system 1. The pathogenesis of SLE involves an imbalance in homeostasis caused by defective clearance of pathogenic autoantibodies and immune complexes, loss of immune tolerance and dysregulation of multiple cytokines and susceptibility genes 1,2.
Immune homeostasis is controlled by the mechanisms of central and peripheral tolerance. Central tolerance involves the deletion of self-reactive T lymphocytes in the thymus at an early stage of development 3,4. Peripheral tolerance is maintained by a specialized subset of naturally occurring CD4+CD25+ regulatory T cells (Treg) which play important roles in suppressing activation and effector functions of autoreactive T cells that escape central tolerance in mice 5–7. Interleukin (IL)-35 has been identified as the newest member of the IL-12 family cytokines including IL-23 and IL-27, which is distinct from its siblings in several ways. Within the CD4+ T helper (Th) cell population, IL-35 is a dimeric immunosuppressive/anti-inflammatory cytokine, with two subunits including IL-12A (p35) and Epstein–Barr virus-induced 3 (EBI3) 8,9. It is expressed by resting and activated Tregs via converting naive CD4+CD25− effector T (Teff) cells into IL-35-dependent induced Tregs (iTr35) 9,10. Similar to that of regulatory cytokines transforming growth factor (TGF)-β and IL-10, IL-35 is one of the major components of the suppressive repertoire 10.
IL-35 has been shown to mediate intracellular signalling either through the heterodimer of receptor chains IL-12Rβ2/gp130 or homodimer of each chain 11. Furthermore, secretion of IL-35 has been confirmed either in non-stimulated mouse Tregs or in recombinant IL-35 (rIL-35)-induced regulatory B cells (Bregs) and Toll-like receptor (TLR)-4 plus CD40 activated B cells 9,12,13. IL-35 can directly suppress Teff cell proliferation in vitro, in an antigen-presenting cell (APC)-free culture 9.
Murphy Roths Large (MRL)/MpJ-lpr/lpr (MRL/lpr) mice develop a spontaneous age-dependent lupus-like disease that has been used widely as an experimental murine model of SLE 14. A low Treg frequency or reduced sensitivity of Teff to Treg may play a key role in the suppression of autoinflammation in MRL/lpr mice 15,16. Moreover, loss of IL-35 expression results in the reduced suppressive capacity of Tregss in vivo 9. These findings suggest a potential regulatory role of Treg cells in lupus mice. However, the immunoregulatory roles of IL-35 in the Treg and Breg cell-mediated suppression of SLE disease have remained unexplored. Therefore, in an attempt to investigate the in vivo immunoregulatory roles of IL-35 in the MRL/lpr mouse model, we examined the plasma concentration of IL-35 and the expression of its receptors on CD4+ Th cells, and in relation to the number of splenic, thymic and circulating Treg and Breg cells. Importantly, we found that the physiological and biochemical parameters were improved significantly in the MRL/lpr mice with IL-35 treatment. Furthermore, the epigenetically regulated gene expression of inducible and natural regulatory T (iTreg and nTreg) cells and mRNA expression of forkhead box protein 3 (FoxP3) were up-regulated significantly in splenic lymphocytes, and an activation of IL-35-related Janus kinase/signal transducer and activator of transcription (JAK/STAT) signalling pathway was shown on CD4+ Th cells from IL-35 treated MRL/lpr mice compared with phosphate-buffered saline (PBS) treatment. Moreover, we showed elevated plasma soluble gp130 and IL-12Rβ2 concentrations and expression of IL-35 receptor (IL-35R) on CD4+ Th cells, which may contribute to the expansion of the ratios of CD4+CD25+FoxP3+ Treg %/CD4+CD25– effector T cell %, the elevation of the plasma concentrations of anti-inflammatory cytokines and the decrease of proinflammatory cytokines.
Materials and methods
Mice
The MRL/MpJ-Faslpr/2J (MRL/lpr) mice purchased from Jackson Laboratory (Bar Harbor, ME, USA) were bred and maintained under specific pathogen-free conditions in the Laboratory Animal Services Center, The Chinese University of Hong Kong (LASC, CUHK) and Cancer Center of Prince of Wales Hospital, Hong Kong. Sex-matched 20–24-week-old adult BALB/c mice (LASC, CUHK) were used as normal control mice; 12–24-week-old adult female MRL/lpr mice were kept in a conventional animal facility. All experiments involving live animals were carried out strictly according to the principles outlined in the Animal Experimentation Ethics Committee Guide for the Care and Use of Laboratory Animals, as approved by the Animal Experimentation Ethics Committee of the Chinese University of Hong Kong.
Monitoring disease activity
Urine collected from each group (n = 10) of untreated MRL/lpr and BALB/c mice was analysed for protein and leucocytes using the URS-5T urine strips (Healgen Scientific LLC, Houston, TX, USA). According to the proteinuria scoring system, the scores were as follows: score 0 = 0–15 mg/dl, score 1 = 16–29 mg/dl, score 2 = 30–99 mg/dl, score 3 = 100–299 mg/dl, score 4 = 300–1999 mg/dl, score 5 ≥2000 mg/dl (score 0–1: mild; score 2–3: moderate; score 4–5: severe) 17–19. The 12–24-week-old female MRL/lpr mice were divided into three groups (n = 10 in each group): mild (aged 12–15 weeks), moderate (aged 16–19 weeks) and severe SLE mice (aged 20–24 weeks).
Biochemical and physiological parameters
Briefly, the divided MRL/lpr mice and BALB/c control mice (n = 5 in each group) were injected intravenously (i.v.) daily at the base of the tail with 800 ng/mouse of recombinant mouse IL-35 (Adipogen International, Inc., San Diego, CA, USA) for 7 days, and with 200 μl/mouse of PBS (i.v.) daily for 7 days as control (n = 5 in each group). Mice were culled 1 day after 7-daily IL-35 or PBS administration to investigate the biochemical parameters including plasma anti-nuclear antibody (ANA), anti-double-stranded DNA antibody (anti-ds-DNA) and cytokines. The disease severity of clinical signs of lupus flare using a four-point scale [0–3, where 0 = normal, 1 = mild (occurred area: snout and ears), 2 = moderate (occurred area < 2 cm: snout, ears and intrascapular) and 3 = severe (occurred area > 2 cm: snout, ears and intrascapular)] was assessed in each group (n = 10) of MRL/lpr mice before treatment 20,21.
Morphological investigations
Longitudinal sections of the kidneys, cut through the papilla, were fixed in 4% paraformaldehyde buffer and then embedded in paraffin. The kidney sections were subsequently cut with 2 μm thickness. They were stained with periodic acid-Schiff (PAS) 22. The number of mesangial cells in the glomeruli was determined by counting their nuclei. Microscopic examination (Leica Microsystems, Wetzlar, Germany) was used to evaluate the area of glomeruli. One hundred glomeruli were evaluated in each group. The severities of vessels infiltration, interstitial nephritis and glomerulonephritis were each scored using a macroscopic scoring system in the range 0–5 (0 = normal; 1–2 = mild; 3 = moderate; 4–5 = severe) 23.
Quantitative real-time polymerase chain reaction (qRT–PCR)
Whole transcriptome analysis of T helper (Th) cell differentiation and Janus kinase (JAK)/signal transducer and activator of transcription (STAT) signalling pathways were performed using mouse RT2 profiler PCR Array gene chip (Qiagen GmbH, Hilden, Germany) with RNA purified by RNeasy Mini Kit (Qiagen) from purified splenic CD4+ Th cells using a naive CD4+ T cell isolation kit (Miltenyi Biotec, Bergisch Gladbach, Germany). Purified RNA from 1 × 10⁶ splenic CD4+ Th cells was performed following the instructions of the RT2 profiler PCR Array kit with the use of 384-well Applied Biosystems 7900HT Fast Real-Time PCR System (Applied Biosystems Inc., Foster City, CA, USA). The mRNA expression was calculated completely using the formula as follows:
(expt: experiment, ctrl: control, GOI: gene of interest, HKG: housekeeping gene). For mRNA quantification, total RNA extracted from 2 × 10⁶ splenic and thymic cells were quantified by real-time PCR with using the 48-well StepOne™ Real Time PCR System (Applied Biosystems Inc.), and cDNA was prepared with the PrimeScript™ RT Master Mix (Takara Bio Inc., Otsu, Shiga, Japan). Quantitative RT–PCR was performed with SYBR® Premix Ex Taq II (Takara). The sequences of the amplification primers p35, EBI3, gp130, IL-12Rβ2, FoxP3 and glyceraldehyde 3-phosphate dehydrogenase (GAPDH) (endogenous control) were listed (Supporting information, Table S1). The real-time PCR reactions were set up according to the manufacturer’s instructions (SYBR® Premix Ex Taq II; Takara) using 20 μl reaction volume. mRNA expression was calculated by comparing with the expression of GAPDH using the formula [2–ΔCt (Cttarget gene – CtGAPDH)].
Plasma ANA, anti-ds-DNA, IL-35 and IL-35R concentrations
Concentrations of plasma ANA, anti-ds-DNA, IL-35, gp130 and IL-12Rβ2 in each group were measured by enzyme-linked immunosorbent assay (ELISA) using reagent kits from Mybiosource (San Diego, CA, USA).
Flow cytometric analysis for CD4+CD25+FoxP3+ Treg cells, CD4+CD25− Teff cells and CD19+CD5+CD1d+IL-10+ Breg cells
Peripheral blood (1 × 10⁶), splenic and thymic cells from MRL/lpr and BALB/c mice were stained to determine the number of CD4+CD25+FoxP3+ Treg cells [fluorescein peridinin chlorophyll protein (PerCP)-conjugated anti-CD4 antibody and allophycocyanin (APC)-conjugated anti-CD25 antibody (BioLegend, San Diego, CA, USA] were used for T cell surface staining, and used AlexaFluor 488-conjugated anti-FoxP3 antibody (BD Pharmingen Corp., San Diego, CA, USA) for intracellular staining of the T lymphocyte subpopulation. CD4+CD25− Teff cells were gated from total lymphocytes, and an IL-10+ Bregs [(CD19+CD5+CD1d+ regulatory B cell) cocktail used for B cell surface staining and phycoerythrin/cyanine dye 7 (PE/Cy7)-conjugated anti-IL-10 antibody (BioLegend) used directly for intracellular staining after fixation and permeabilization without treatment] were gated using flow cytometry (Beckman Navios flow cytometer; Beckman Coulter Inc., Brea, CA, USA).
Flow cytometric analysis for the IL-35R expression
Peripheral blood (1 × 10⁶) splenic and thymic cells from MRL/lpr and BALB/c mice were stained for IL-35R expression. Indirect immunofluorescent staining was used to determine the cell surface expression of IL-12Rβ2 (BD Pharmingen) and gp130 (R&D Systems, Minneapolis, MN, USA) on PerCP-conjugated CD4+ (BioLegend) Th lymphocyte subpopulations. Expression of the cell surface molecules of 10 000 viable cells was analysed by flow cytometry (Beckman Navios flow cytometer) and expressed as geometric mean of mean fluorescence intensity (MFI) 15,24.
Plasma concentrations of cytokines from MRL/lpr and BALB/c mice
Plasma from each mousce group was harvested and stored at −80°C for subsequent multiplex immunoassay of cytokines using the Milliplex MAP kit assay reagent (Merck Millipore, Billerica, MA, USA) with the Bio-Plex 200 suspension array system (BioRad Laboratories, Hercules, CA, USA).
Statistical analysis
Statistical analysis of the gene array data was described in the section gene array hybridization and data analysis. Results were expressed as mean ± standard error mean (s.e.m.) for normally distributed data. Numerical data were expressed as median [interquartile range (IQR)] if they were not in Gaussian distribution. Mann–Whitney U-tests were used for continuous variables. Comparison of different groups was made with Kruskal–Wallis analysis of variance (anova), followed by Dunn’s post-test for comparing the differences and calculating a probability (P) value for each pair of comparison. Two-way anova was used when comparing the different groups and treatments, followed by Bonferroni’s post-test for comparing the replicate means. All hypotheses were two-tailed, and P-values < 0·05 were considered significant. Data analyses were performed using GraphPad Prism (version 6·0 for Windows; GraphPad Software, La Jolla, CA, USA).
Results
SLE disease characteristics of MRL/lpr mice
Clinical characteristics of the mice are summarized in Table 1. MRL/lpr mice without treatment were first stratified into three subgroups (mild, moderate or severe) based on disease activity, as reflected by the proteinuria scores. The proteinuria scores and percentages of lymphadenopathy in each group of MRL/lpr mice were markedly higher than control (P < 0·001). All MRL/lpr mice in the moderate and severe groups had significantly higher scores of lupus flare and leucocyturia than normal control mice (P < 0·05), but without significant difference in the mild group (P > 0·05). Joint swelling of MRL/lpr mice in the mild and moderate groups was significantly higher than the control group (P < 0·05).
Table 1.
Clinical characteristics of Murphy Roths Large (MRL)/lpr and BALB/c mice before treatment
| MRL/lpr (n = 30) | BALB/c | |||
|---|---|---|---|---|
| Mild (n = 10) | Moderate (n = 10) | Severe (n = 10) | Normal (n = 10) | |
| Clinical assessment | ||||
| Body weight, mean ± s.d., g | 46·8 ± 7·6&&& | 44·8 ± 5·4*** | 46·4 ± 7·3### | 19·2 ± 0·3 |
| Joint swelling, mean ± s.d., μm | 89·6 ± 7·1&& | 89·6 ± 10·2* | 89·8 ± 16·3 | 80·7 ± 4·2 |
| Lupus flare score, mean ± s.d. | 0·6 ± 0·5 | 1·1 ± 0·6*** | 2·2 ± 0·4### | 0 |
| Proteinuria score, mean ± s.d. | 1·3 ± 0·5&&& | 2·8 ± 0·4*** | 4·2 ± 0·4### | 0·3 ± 0·5 |
| Leucocyturia score, mean ± s.d. | 0·4 ± 1·0 | 1·7 ± 1·2* | 2·3 ± 0·5### | 0 |
| Lymphadenopathy, no. (%) | 10/10 (100%)&&& | 10/10 (100%)*** | 10/10 (100%)### | 0/10 (0%) |
Joint swelling was measured in three joints of each hind paw (tarsus joint); leucocytuira score was determined by a four-point scale (0–3, where 0 was normal and 3 was severe). No. (%) = percentage of mice that had lymphadenopathy among each group; s.d. = standard deviation; MRL/lpr = MRL/MpJ-Faslpr/2J; mild = mice with mild disease activity [mild systemic lupus erythematosus (SLE), proteinuria score 0–1, age 12–15 weeks]; moderate: moderate disease activity (moderate SLE, proteinuria score 2–3, age 16–19 weeks); severe: high disease activity (severe SLE, proteinuria score 4–5, age 20–24 weeks); and normal: age- and sex-matched healthy BALB/c normal control mice (age 20–24 weeks).
&P < 0·05, &&P < 0·01, &&&P < 0·001, comparing between control and mild SLE mice.
*P < 0·05, **P < 0·01, ***P < 0·001, comparing between control sand moderate SLE mice.
#P < 0·05, ##P < 0·01, ###P < 0·001, comparing between control and severe SLE mice.
Relieving nephritis of MRL/lpr mice with IL-35 treatment
In order to confirm the immunoregulatory role of IL-35 in vivo, we measured the nephritis clinical characteristics of MRL/lpr mice with IL-35 or PBS injection. As shown in Fig. 1, almost all the nephritis-related clinical indices (scores of proteinuria, leucocyturia, glomerulonephritis, interstitial nephritis and vessel infiltrate) from MRL/lpr mice without IL-35 injection were significantly higher than BALB/c control mice and the same as lupus flare scores (all P < 0·05). From the results of IL-35-treated MRL/lpr mice, we found obvious remissions of nephritis and lupus disease compared with PBS treatment, especially in severe SLE mice (Fig. 1 and Supporting information, Fig. S1, P < 0·05). Moreover, there were remarkable differences of the concentrations of plasma ANA and anti-ds-DNA antibodies among the moderate, severe SLE mice and BALB/c control mice with PBS injection (Fig. 2). Although the concentrations of plasma ANA and anti-ds-DNA in severe SLE mice treated with IL-35 were significantly higher than those of BALB/c control mice (both P < 0.05), these concentrations were both decreased significantly in severe SLE mice compared to PBS treatment. Additionally, in moderate SLE mice with IL-35 treatment, plasma anti-ds-DNA concentration was also decreased significantly (P < 0·001).
Figure 1.
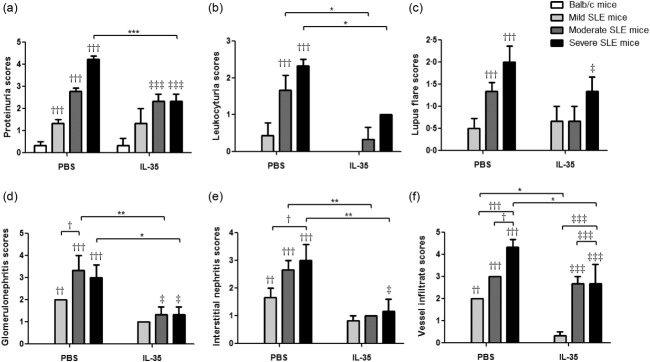
Clinical characteristics of Murphy Roths Large (MRL)/lpr mice with interleukin (IL)-35 or phosphate-buffered saline (PBS) injection. The results of each score system of the signs: (a) proteinuria, (b) leucocytuira, (c) lupus flare, (d) glomerulonephritis, (e) interstitial nephritis and (f) vessels infiltration are presented as bar charts with the arithmetic mean plus standard error of the mean (s.e.m.). *P < 0·05, **P < 0·01, ***P < 0·001, PBS treatment versus IL-35 treatment; †P < 0·05, ††P < 0·01, †††P < 0·001, BALB/c control mice versus PBS-treated MRL/lpr mice; ‡P < 0·05, ‡‡‡P < 0·001, BALB/c control mice versus IL-35-treated MRL/lpr mice (n = 5 in each group).
Figure 2.
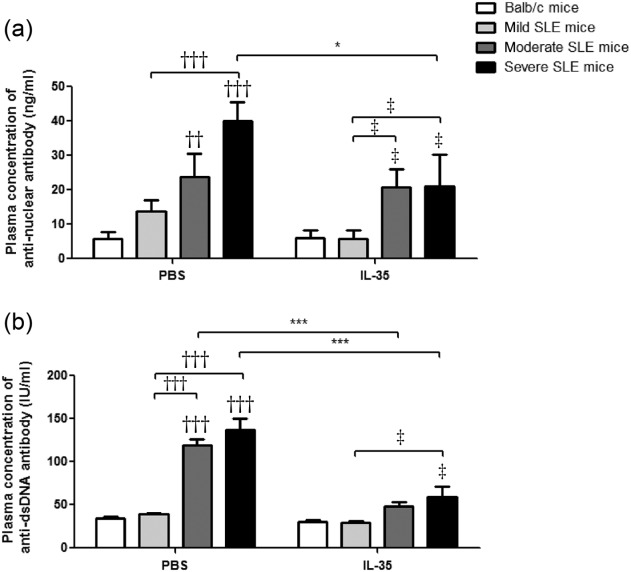
Plasma concentrations of anti-nuclear antibody and anti-double-stranded DNA antibody in Murphy Roths Large (MRL)/lpr and BALB/c mice treated with interleukin (IL)-35 or phosphate-buffered saline (PBS) injection. Concentrations of plasma (a) anti-nuclear antibody (ANA) and (b) anti-ds-DNA antibodies are presented as bar charts with the arithmetic mean plus standard error of the mean (s.e.m.). *P < 0·05, ***P < 0·001, PBS versus IL-35 treatment; ††P < 0·01, †††P < 0·001, BALB/c control mice versus PBS-treated MRL/lpr mice; ‡P < 0·05, BALB/c control mice versus IL-35-treated MRL/lpr mice (n = 5 in each group).
Epigenetically regulated gene expression profile of Th cell differentiation
Notably, the common logarithm for arithmetic mean value of epigenetically regulated gene expression of iTreg and nTreg (Ccr6, Fosl1, Foxp3, Ikzf2, Il9, Irf4, Irf8, Myb, Nr4a1, Nr4a3, Pou2f2, Rel, Tgif1 and Tnfsf11) in splenic CD4+ Th lymphocytes from MRL/lpr mice was significantly lower than Th2 cell-regulated genes (Asb2, Gata3, Il13, Il1rl1, Il4, Il5 and Pparg) compared with BALB/c control mice (Fig. 3a, P < 0·05). However, upon IL-35 treatment, the mean values of iTreg and nTreg and Th2 cell-regulated gene expression in splenic CD4+ Th lymphocytes from MRL/lpr mice were significantly higher than Th1 cell-regulated genes (Ifng, Il12rb2, Il18r1, Il18rap, Fasl and Tbx21) when compared with PBS-treated mice (Fig. 3b, P < 0·05). These results implied an immunoregulatory role of IL-35 in splenic CD4+ Th cell differentiation by inducing the CD4+ Th cell differentiated into iTreg and Th2 cells in vivo. Furthermore, from the result of gene expression profile of Th cell differentiation PCR array analysis, most T cell-related transcription factor genes were up-regulated in IL-35-treated MRL/lpr mice. In particular, Treg-related STAT-1 and FoxP3 genes were up-regulated more than threefold (data not shown).
Figure 3.
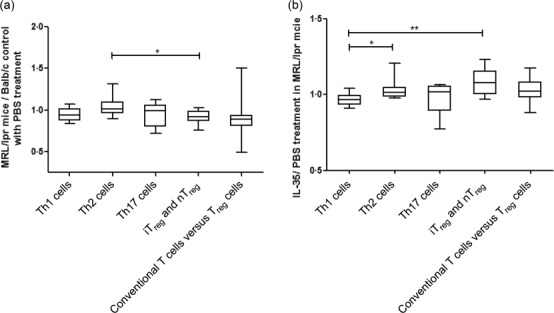
RT2 profiler polymerase chain reaction (PCR) array of mouse T helper (Th) cell differentiation. The results of epigenetically regulated gene expressions of Th1 cells, Th2 cells, inducible regulatory T cells (iTreg) and natural (n)Treg, Th17 cells and conventional T cells versus Treg cells in (a) phosphate-buffered saline (PBS)-treated Murphy Roths Large (MRL)/lpr versus BALB/c mice (in ratio) and (b) interleukin (IL)-35 treated versus PBS-treated MRL/lpr mice (as ratio) are grouped according to the instruction of the classification of kit and presented as box-and-whisker plots with the median [interquartile range (IQR)]. Mann–Whitney U-test was used to assess the differences of mRNA expression among different epigenetically regulated genes of Th cells. *P < 0·05, **P < 0·01.
Heatmap analysis of JAK/STAT signalling pathway
As shown in Supporting information, Fig. S2, the JAK/STAT signalling pathway genes from CD4+ T cells in IL-35-treated MRL/lpr mice were remarkably changed compared with the PBS treatment. As shown in the heatmap result, as well as the down-regulated Jak3 and Tyk2 genes, Jak2 was also down-regulated significantly compared with the up-regulated Jak1 gene (Supporting information, Fig. S2a). As shown in Supporting information, Fig. S2a,c, most of the regulators of JAK/STAT pathway and cell differentiation-related genes were down-regulated more than twofold. Furthermore, there was no obvious up-regulation of STAT protein-interacted genes (Supporting information, Fig. S2b). Most of the inflammatory response genes were found to be down-regulated, except Irf1 and Ifng (Supporting information, Fig. S2e).
Up-regulation of the mRNA expression of IL-35, IL-35R and FoxP3
Given that severe SLE mice with IL-35 treatment expressed higher levels of IL-35, we sought to determine the expression of receptor for IL-35 on splenic (Fig. 4) and thymic (Fig. 5) cells in MRL/lpr mice. As shown in Fig. 4, even though the mRNA expression of p35, EBI3, gp130 and IL-12Rβ2 in each group of PBS-treated MRL/lpr mice appeared to be lower than BALB/c controls in splenic cells, IL-35 exhibited its immunoregulatory effect by up-regulating the mRNA expression of IL-35 and IL-35R from MRL/lpr mice when compared to PBS treatment. However, FoxP3 mRNA expression from splenic cells was significantly higher in severe SLE mice with or without IL-35 treatment compared with BALB/c control mice (Fig. 4e, P < 0·01). Notably, we found a similar increasing trend of p35, EBI3, gp130, IL-12Rβ2 and FoxP3 mRNA expression from thymic cells in MRL/lpr mice with IL-35 treatment compared to PBS treatment (Fig. 5).
Figure 4.
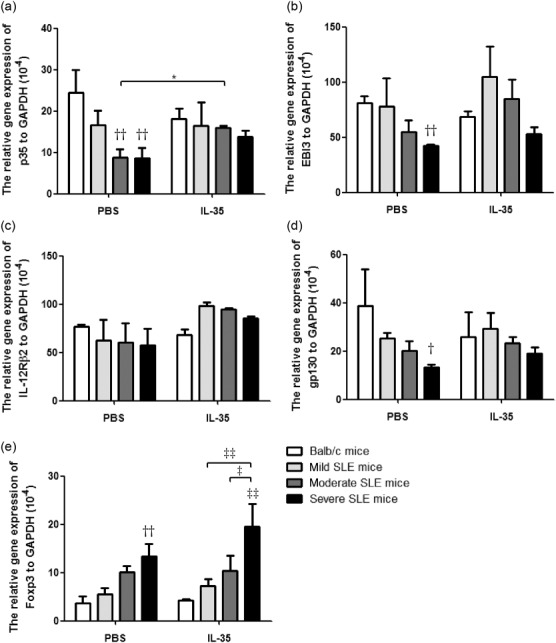
The differences of mRNA expression of p35, EBI3, gp130, IL-12Rβ2 and forkhead box protein 3 (FoxP3) of splenic cells between interleukin (IL)-35 and phosphate-buffered saline (PBS) treatment. Total RNA extracted from splenic cells from Murphy Roths Large (MRL)/lpr and BALB/c mice was reverse-transcribed and analysed by quantitative polymerase chain reaction (qPCR). Results were presented as Bar charts showing the arithmetic mean plus standard error of the mean (s.e.m.). *P < 0·05, PBS versus IL-35 treatment; ††P < 0·01, BALB/c control mice versus PBS-treated MRL/lpr mice; ‡P < 0·05, ‡‡P < 0·01, ‡‡‡P < 0·001, BALB/c control mice versus IL-35-treated MRL/lpr mice (n = 5 in each group).
Figure 5.
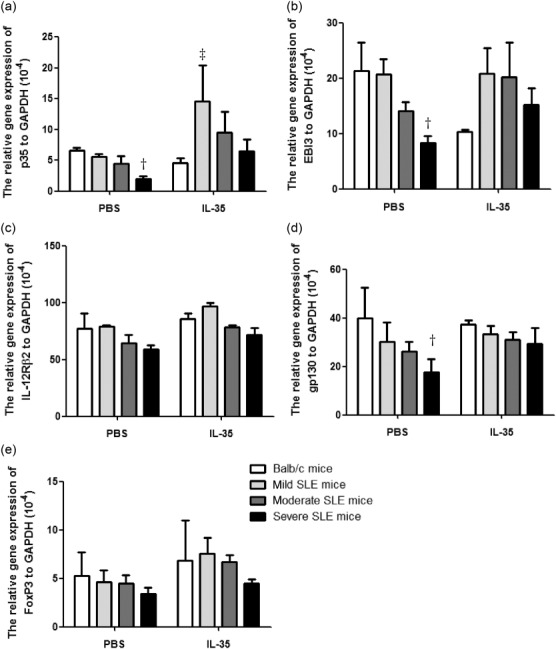
The differences of mRNA expression of p35, EBI3, gp130, IL-12Rβ2 and forkhead box protein 3 (FoxP3) of thymic cells between interleukin (IL)-35 and phosphate-buffered saline (PBS) treatment. Total RNA extracted from thymic cells from Murphy Roths Large (MRL)/lpr and BALB/c mice was reverse-transcribed and analysed by quantitative polymerase chain reaction (qPCR). Results were presented as bar charts showing the arithmetic mean plus standard error of the mean (s.e.m.). Differences among each group of mice in the same treatment were compared by Kruskal–Wallis analysis of variance (anova), followed by Dunn’s post-test. †P < 0·05, BALB/c control mice versus PBS-treated MRL/lpr mice; ‡P < 0·05, BALB/c control mice versus IL-35-treated MRL/lpr mice (n = 5 in each group).
Elevated concentrations of plasma IL-35 and soluble IL-35R in MRL/lpr mice treated with IL-35
We then analysed if the production of IL-35 and IL-35R was associated with any of the clinical characteristics of SLE. As shown in Fig. 6, plasma concentrations of IL-35 and gp130 in PBS-treated MRL/lpr mice were significantly lowered than BALB/c control mice, while plasma concentrations of IL-12Rβ2 in MRL/lpr mice was significantly higher than BALB/c control mice (all P < 0·05). Compared with PBS treatment, the plasma IL-35 concentration in mild SLE mice, gp130 in mild and moderate SLE mice and IL-12Rβ2 in moderate and severe SLE mice treated with IL-35 were increased significantly (Fig. 6, P < 0·05).
Figure 6.
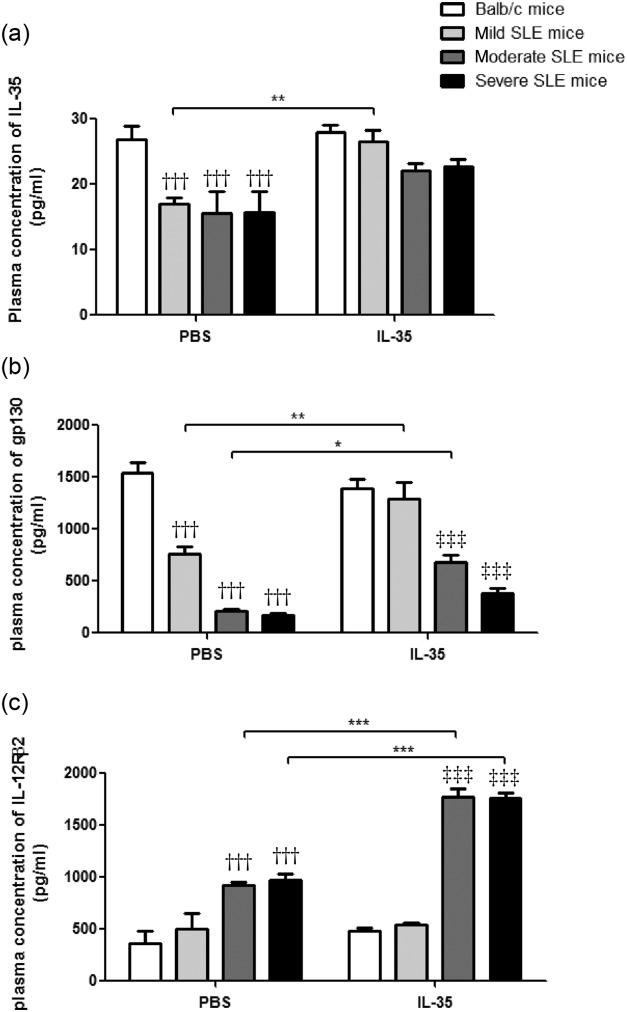
Plasma concentrations of interleukin (IL)-35 and soluble IL-35R component gp130 and IL-12Rβ2 in Murphy Roths Large (MRL)/lpr and BALB/c mice with IL-35 or phosphate-buffered saline (PBS) treatment. Results of the concentrations of plasma (a) IL-35, (b) gp130 and (c) IL-12Rβ2 are presented as bar charts with the arithmetic mean plus standard error of the mean (s.e.m.). *P < 0·05, **P < 0·01, ***P < 0·001, PBS versus IL-35 treatment; †††P < 0·001, BALB/c control mice versus PBS-treated MRL/lpr mice; ‡‡‡P < 0·001, BALB/c control mice versus IL-35-treated MRL/lpr mice (n = 5 in each group).
Increment of % CD4+CD25+FoxP3+ Tregs and % IL-10+ Bregs in MRL/lpr mice with IL-35 treatment
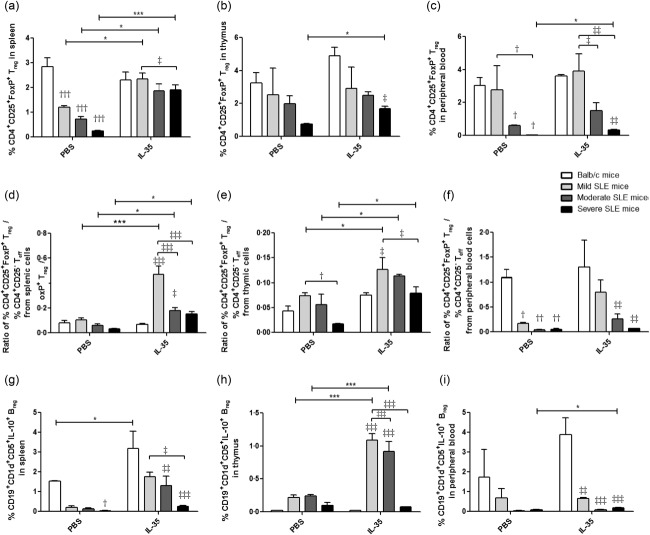
As shown in Fig. 7a–c and Supporting information, Figs S3 and S4, according to the disease severity we found that the number of CD4+CD25+FoxP3+ Treg cells in all groups of MRL/lpr mice, either with or without IL-35 treatment, appeared to be a decreasing trend compared to the BALB/c control. Compared with PBS treatment, % CD4+CD25+FoxP3+ Treg cells from splenic, thymic and peripheral blood cells in severe SLE mice with IL-35 treatment were increased significantly (all P < 0·05). Furthermore, % CD4+CD25+FoxP3+ Treg cells from splenic cells in mild and moderate SLE mice with IL-35 treatment were significantly higher than PBS treatment (P < 0·05). Accordingly, the ratios of CD4+CD25+FoxP3+ Treg %/CD4+CD25− effector T cell % from splenic and thymic cells was increased significantly in all groups of MRL/lpr mice with IL-35 treatment (Fig. 7d,e, P < 0·05). Finally, there was a significant increment of % IL-10+ Breg cells from thymic cells in mild and moderate SLE mice and peripheral blood cells in severe SLE mice with IL-35 treatment compared to PBS treatment (Fig. 7g, P < 0·05).
Figure 7.
Characterization of % CD4+CD25+forkhead box protein 3 (FoxP3)+ regulatory T cells (Treg), the ratios of CD4+CD25+FoxP3+ Treg %/CD4+CD25− effector T cell % and % IL-10+ regulatory B cells (Breg) in Murphy Roths Large (MRL)/lpr and BALB/c mice treated with IL-35 or phosphate-buffered saline (PBS). Bar charts showed the arithmetic mean plus standard error of the mean (s.e.m.) of the frequency of CD4+CD25+FoxP3+ Tregs in (a) splenic, (b) thymic and (c) peripheral blood cells; and the ratios of CD4+CD25+FoxP3+ Treg %/CD4+CD25− effector T cell % in (d) splenic, (e) thymic and (f) peripheral blood cells; and the frequency of IL-10+ Breg cells in (g) splenic, (h) thymic and (i) peripheral blood cells. *P < 0·05, ***P < 0·001, IL-35 versus PBS treatment; †P < 0·05, ††P < 0·01, †††P < 0·001. BALB/c control mice versus PBS-treated MRL/lpr mice; ‡P < 0·05, ‡‡P < 0·01, ‡‡‡P < 0·001, BALB/c control mice versus IL-35-treated MRL/lpr mice (n = 5 in each group).
Up-regulated cell surface expression of IL-35R on CD4+ Th cells in MRL/lpr mice with IL-35 treatment
As shown in Fig. 8, the expression of IL-35 receptor subunit gp130 and IL-12Rβ2 exhibited a down-regulation trend on splenic, thymic and peripheral blood CD4+ Th cell surfaces of all MRL/lpr mice compared to BALB/c control mice (all P < 0·05). These findings were similar to our previous findings: a decreased expression of gp130 on the peripheral blood CD4+ Th cell surface in SLE patients (data not shown). The expression of IL-35R on splenic and peripheral blood CD4+ Th cell surface in mild SLE mice treated with IL-35 was up-regulated significantly when compared with PBS treatment (Fig. 8a,b,d,e, all P < 0·05). Expression of IL-35R on the peripheral blood CD4+ Th cell surface of severe SLE mice treated with IL-35 was significantly higher than that with PBS treatment (Fig. 8b,e, P < 0·05).
Figure 8.
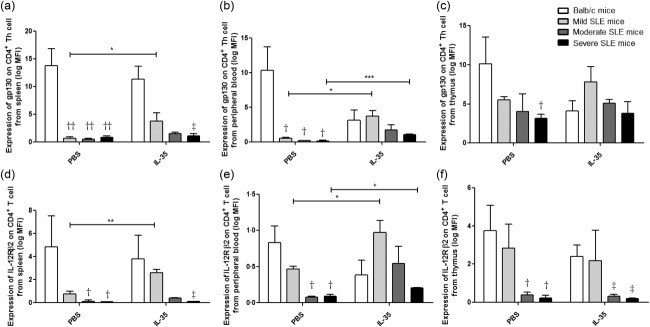
Expression of gp130 and IL-12Rβ2 on splenic CD4+ T helper (Th) cell surface in Murphy Roths Large (MRL)/lpr and BALB/c mice with interleukin (IL)-35 or phosphate-buffered saline (PBS) treatment. Isolated splenic cells were stained with immunofluorescent antibodies and analysed by flow cytometry. Cell surface expression of gp130 and IL-12Rβ2 on CD4+ Th cells was presented as bar charts with the arithmetic mean plus standard error of the mean (s.e.m.). *P < 0·05, **P < 0·01, ***P < 0·001, IL-35 versus phosphate-buffered saline (PBS) treatment; †P < 0·05, ††P < 0·01, BALB/c control mice versus PBS-treated MRL/lpr mice; ‡P < 0·05, BALB/c control mice versus IL-35-treated MRL/lpr mice (n = 5 in each group).
Plasma concentrations of cytokines of MRL/lpr and BALB/c mice
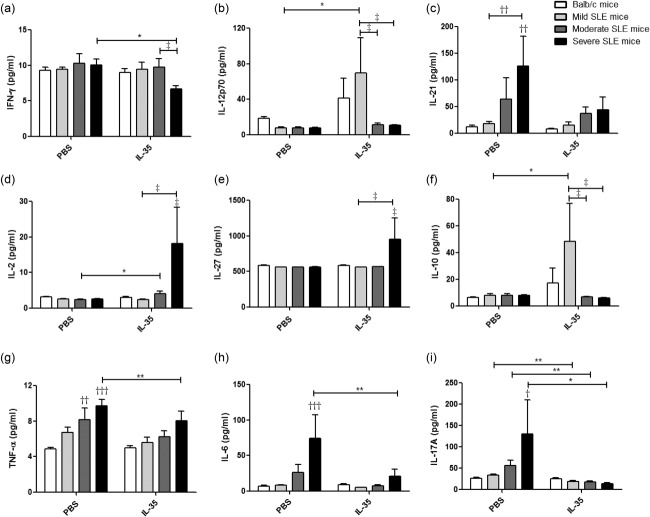
Compared with PBS treatment, the plasma concentrations of inflammatory cytokines interferon (IFN)-γ, tumour necrosis factor (TNF)-α, IL-6 and Th17 cytokine IL-17A from severe SLE mice were decreased significantly upon IL-35 treatment (Fig. 9, all P < 0·05). Plasma IL-10 and IL-2 concentrations from mild, moderate and severe SLE mice were increased significantly with IL-35 treatment (Fig. 9d,f, all P < 0·05). Plasma concentration of IL-17A from each group of MRL/lpr mice with IL-35 treatment was decreased significantly compared to that of PBS treatment (Fig. 9i, P < 0·05). Furthermore, plasma concentration of IL-12p70 from mild SLE mice treated with IL-35 was increased significantly compared to PBS treatment (Fig. 9b). Although differences did not reach statistical significance, there was a decrement of IL-21 with IL-35 treatment in all groups of MRL/lpr mice (Fig. 9c, P > 0·05).
Figure 9.
Plasma concentrations of cytokines in Murphy Roths Large (MRL)/lpr and BALB/c mice with interleukin (IL)-35 or phosphate-buffered saline (PBS) treatment. Bar charts are shown with the arithmetic mean values of the plasma levels of (a) interferon (IFN)-γ, (b) IL-12p70, (c) IL-21, (d) IL-2, (e) IL-27, (f) IL-10, (g) tumour necrosis factor (TNF)-α, (h) IL-6 and (i) IL-17A.*P < 0·05, **P < 0·01, IL-35 versus PBS treatment; †P < 0·05, ††P < 0·01, †††P < 0·001, BALB/c control mice versus PBS-treated MRL/lpr mice; ‡P < 0·05, BALB/c control mice versus IL-35-treated MRL/lpr mice (n = 5 in each group).
Discussion
It has been shown that the lack or loss of functional regulatory IL-35 can lead to enhanced inflammatory immune responses, and hence increased incidence and severity of inflammatory diseases 16,25,26. Conversely, the induction of IL-35 expression can alleviate disease symptoms of inflammatory bowel disease, encephalomyelitis and collagen-induced arthritis 27–30. Even though IL-35 can reduce the frequency and severity of arthritis and other inflammatory immune responses, there is limited knowledge on the in vivo immunoregulatory mechanism of IL-35. In a clinical study, we observed an increased level of plasma IL-35 together with low expression of IL-35 receptor on CD4+ T cells that may not be sufficient enough to suppress proinflammatory cytokines in SLE patients (data not shown). Although it is possible that the murine IL-35 ELISA kit can measure both endogenous synthesized IL-35 and recombinant IL-35 injected into the mouse, because of the cross-reactivity of the detecting antibody, according to previous publications 31,32, the half-life of recombinant cytokines in circulation is short, within several hours. In view of the short half-life of recombinant cytokines, daily i.v. injection of IL-35 is required to maintain its anti-inflammatory effect. Moreover, the measured plasma IL-35 level 1 day after the last injection of recombinant IL-35 should be due to the endogenous production rather than i.v. injection. It may also account for the relatively low induction of plasma IL-35 level in recombinant IL-35-treated MRL/lpr mice (Fig. 6a). We speculated that the additional increased IL-35 may restore the balance of inflammatory immune responses and autoimmune tolerance in SLE mice. Accordingly, our study provided the earliest evidence that IL-35 could play a key regulatory role in the propagation of immune tolerance in the SLE murine model. The predominant mechanism associated with the regulatory activity of IL-35 is related to the suppression of T cell proliferation and effector functions 33–36. Treatment with rIL-35 can also reduce the differentiation of CD4+ Th cells into Th17 effector cells as well as the function of Th17 cells 27,30,37. We also found that rIL-35 could lead to decreased concentrations of plasma autoantibody ANA and anti-ds-DNA in SLE mice. Therefore, the ability of IL-35 to suppress the production of ANA and anti-ds-DNA antibody might imply that the suppressive activity of IL-35 is not only limited to CD4+ Tregs, but might also be able to activate other cell populations, such as its enhancement effects on the propagation of IL-10+ Breg cells.
Consistent with our previous findings regarding the significant decreased frequency of Treg cells in SLE patients (data not shown), in this study significantly decreased frequencies of splenic and peripheral blood Treg cells in PBS-treated lupus mice were also found (Fig. 7a,c). The i.v. injection of rIL-35 could induce the frequency of splenic, thymic and peripheral blood Treg cells in lupus mice (Fig. 7a–c). These elevated Treg cells might subsequently enhance (1) the frequency ratio of Treg: Teff cells (Fig. 7d–f); (2) the concentration of plasma IL-2 to promote the differentiation of Treg from naive T cells; (3) the production of anti-inflammatory cytokine IL-27 to promote the immunoregulatory role of IL-35 (Fig. 9d,e); and (4) profoundly suppress the increment of proinflammatory cytokine IFN-γ, IL-12p70, IL-21, TNF-α, IL-6 and IL-17A (Fig. 9a–c,g–i). Furthermore, IL-35 induced the increase of frequency of IL-10+ Breg cells in splenic, thymic and peripheral blood (Fig. 7g–i), with a significant elevation of plasma immunosuppressive cytokine IL-10 production compared to the PBS treatment (Fig. 9f). Apart from the inflammation, there was a relief of SLE disease symptoms in this mouse model following the injection of rIL-35 (Fig. 1 and Supporting information, Fig. S1).
After being expressed and secreted by Tregs, IL-35 can act on its target cells by binding to the IL-35 receptor to transduce its signal through intracellular signalling molecule STAT-1 and STAT-4, which can also form a unique heterodimer and induce the expression of target genes including p35 and EbI3, thereby forming a feedback loop to promote IL-35 expression 11. Different from the other members of IL-12 family, when IL-35 binds to one of its homodimeric receptors (gp130 homodimer for STAT-1 or IL-12Rβ2 homodimer for STAT-4), either the STAT-1 or STAT-4 signal transduction pathway was activated to exhibit only a partial suppressive activity of IL-35 compared with signalling through the fully functional IL-12Rβ2-gp130 heterodimer receptor 11. Although, in this study, rIL-35 was a fusion protein combining EBI3 and p35 which fused to the Fc region of human IgG1, we found no significant in vivo effect of i.v. injection with human IgG1 compared with PBS treatment (data not shown). Notably, from results of the gene expression profile analysis of JAK/STAT signalling pathways and Th cell differentiation, the expression of IL-35 receptor (gp130 and IL-12Rβ2) and IL-35 receptor-related genes (Stat1 and Stat4) were remarkably up-regulated upon in vivo IL-35 treatment. It further confirmed that the IL-35 signal transduction pathway was activated either through its homodimer or heterodimer receptor. Furthermore, from the gene expression profile assay of Th cell differentiation, IL-35 might preferentially expand iTreg and nTreg cells, but suppress Th1-related cell activation. The elevated Treg cells could suppress the residual Teff cells activity in vitro 38,39 and may prevent kidney damage in chronic inflammation of SLE. Nevertheless, the underlying mechanisms by which IL-35 can suppress Teff cells and its subsequent immunological consequence need further investigation.
Together, these results have demonstrated that the immunoregulatory functions of IL-35 in vivo, and the close relationship between IL-35 and Treg cells suggested that the IL-35-mediated intracellular signalling pathway can be targeted towards future development of SLE disease therapeutic strategies. Similar to our previous findings of the increment of plasma IFN-γ, IL-17A, IL-6, IL-10, CXCL8 and CCL2 in SLE patients 40–43, we also found the significant increment of proinflammatory cytokines (IFN-γ, IL-17A, IL-6 and IL-10) in MRL/lpr mice with PBS treatment (Fig. 9a,f,h,i). Even though IL-35 performs its immunoregulatory role in suppressing the production of these cytokines, it is still uncertain whether IL-35 plays any role in mediating suppression of autoimmune disease together with other immunosuppressive cytokines such as IL-10 and TGF-β, or how this induced IL-10+ Breg population performs its regulatory activity in autoimmune disease. Because we are elucidating the immune regulation and autoimmune tolerance, it is essential to characterize further other suppressive mechanisms of the novel mediators of tolerance, and evaluate the identification of Treg and Breg cell populations in local inflammatory sites. As the detection of IL-35 expression can be daunting, the plastic nature of these IL-35-positive populations makes them challenging to be identified and tracked over time. After the injection dose of IL-35 (800 ng/mouse, i.e. 20 ng/g body weight) in this study being translated into human application, the equivalent human dose is 20 μg/kg, or approximately 1 mg/adult, which should be pharmacologically and physiologically feasible. Our IL-35 injection dose is actually compatible to a previous publication regarding the i.v. injection of recombinant cytokine for therapeutic treatment 44. As lower doses (200 or 400 ng/mouse) did not exhibit any significant anti-inflammatory activities (Supporting information, Fig. S5, all P > 0·05), 800 ng IL-35/mouse was the optimal dose used in this in vivo study. In conclusion, our present study provides a biochemical basis for further investigation of the regulatory mechanisms of Treg and Breg cells for IL-35-mediated anti-inflammation in SLE diseases.
Acknowledgments
We thank Ms Ida Miu Ting Chu and Mr Timmy Wai Sheng Cheng for their efforts on experimental supports. This work was supported by National Natural Science Foundation of China (grant no. 81273248).
Disclosure
No conflicts of interest have been declared by the authors.
Supporting Information
Additional Supporting Information may be found in the online version of this article at the publisher’s Web site:
Table S1. Primers sequences used for real-time polymerase chain reaction (PCR).
Fig. S1. Effects of interleukin (IL)-35 treatment on nephritis disease in severe Murphy Roths Large (MRL)/lpr mice. Kidney tissues from severe MRL/lpr mice were collected and fixed in 4% paraformaldehyde. The tissue sections were stained with periodic acid-Schiff (PAS) staining. Representative kidney histopathology in (a,b) phosphate-buffered saline (PBS) and (c,d) IL-35-treated MRL/lpr mice are shown. (a,c) Periodic acid Schiff (PAS) staining of a representative perivascular area is shown (×100). Black arrows point the mononuclear cells infiltration on vessel area. (b,d) PAS staining of a representative glomerulus area is shown (×400). Black arrows point the increased mesangial cells and glomerular mesangial expansion.
Fig. S2. Gene expression profile analysis of Janus kinase/signal transducer and activator of transcription (JAK/STAT) signalling pathway. The mRNA was extracted from splenic CD4+ T helper (Th) cells of Murphy Roths Large (MRL)/lpr mice with interleukin (IL)-35 or phosphate-buffered saline (PBS) treatment. Each row and column represents a separate gene and separate subgroups of JAK/STAT signalling pathway and their related target genes, respectively, in each frame. The normalized expression index for each transcript sequence (rows) in each subgroup (columns) is indicated by a colour code. Relative gene expression compared with internal housekeeping genes from IL-35- versus PBS-treated MRL/lpr mice was analysed by online polymerase chain reaction (PCR). Array Data Analysis Software (Qiagen). The visualized heatmaps are exported from range approximately 0 (bright green) to twofold increase (bright red) by software HemI (Heatmap Illustrator, version 1.0; Wuhan, Hubei, China).
Fig. S3. Flow cytometric analysis of the relative frequencies of CD4+CD25+forkhead box protein 3 (FoxP3)+ regulatory T cells (Treg) in Murphy Roths Large (MRL)/lpr and BALB/c mice with interleukin (IL)-35 or phosphate-buffered saline (PBS) treatment. Single-cell suspensions were obtained from MRL/lpr and BALB/c mice spleen, thymus and peripheral blood cells. The cells were stained with fluorochrome-labelled antibodies against CD4, CD25 and FoxP3. Representative dot-plots of CD4+CD25+ T cells and FoxP3+ Treg cells are presented. The representative percentage of CD4+CD25+FoxP3+ Treg cells in total lymphocytes is shown as FoxP3+ gating in different mouse groups.
Fig. S4. Flow cytometric analysis of the relative frequencies of CD19+CD5+CD1d+interleukin (IL)-10+ regulatory B cells (Breg) in Murphy Roths Large (MRL)/lpr and BALB/c mice with IL-35 or phosphate-buffered saline (PBS) treatment. Single-cell suspensions were obtained from MRL/lpr and BALB/c mice spleen, thymus and peripheral blood cells. The cells were stained with fluorochrome-labelled antibodies against CD19, CD5, CD1d and IL-10. Representative dot-plots of CD19+IL-10+ B cells and CD5+CD1d+ Breg cells are presented. The representative percentage of CD19+CD5+CD1d+IL-10+ Breg cells in total lymphocytes is shown as quadruple positive gating in different mouse groups.
Fig. S5. Clinical characteristics of Murphy Roths Large (MRL)/lpr mice with interleukin (IL)-35 or phosphate-buffered saline (PBS) injection. The 20–24-week-old MRL/lpr mice were injected intravenously (i.v.) with recombinant mouse IL-35 (200 or 400 ng/mouse) or PBS daily for 7 days (n = 3 in each treatment group). The results of each score system of the signs: (a) proteinuria, (b) leucocytuira, (c) lupus flare, (d) glomerulonephritis, (e) interstitial nephritis and (f) vessels infiltration are presented as bar charts with the arithmetic mean plus standard error of the mean.
References
- Mok CC, Lau CS. Pathogenesis of systemic lupus erythematosus. J Clin Pathol. 2003;56:481–90. doi: 10.1136/jcp.56.7.481. [DOI] [PMC free article] [PubMed] [Google Scholar]
- Crispin JC, Oukka M, Bayliss G. Expanded double negative T cells in patients with systemic lupus erythematosus produce IL-17 and infiltrate the kidneys. J Immunol. 2008;181:8761–6. doi: 10.4049/jimmunol.181.12.8761. [DOI] [PMC free article] [PubMed] [Google Scholar]
- Van Parijs L, Abbas AK, et al. Homeostasis and self-tolerance in the immune system: turning lymphocytes off. Science. 1998;280:243–8. doi: 10.1126/science.280.5361.243. [DOI] [PubMed] [Google Scholar]
- Kappler JW, Roehm N, Marrack P. T cell tolerance by clonal elimination in the thymus. Cell. 1987;49:273–80. doi: 10.1016/0092-8674(87)90568-x. [DOI] [PubMed] [Google Scholar]
- Sakaguchi S. Regulatory T cells: key controllers of immunologic self-tolerance. Cell. 2000;101:455–8. doi: 10.1016/s0092-8674(00)80856-9. [DOI] [PubMed] [Google Scholar]
- Shevach EM. CD4+ CD25+ suppressor T cells: more questions than answers. Nat Rev Immunol. 2002;2:389–400. doi: 10.1038/nri821. [DOI] [PubMed] [Google Scholar]
- Sakaguchi S. Naturally arising CD4+ regulatory t cells for immunologic self-tolerance and negative control of immune responses. Annu Rev Immunol. 2004;22:531–62. doi: 10.1146/annurev.immunol.21.120601.141122. [DOI] [PubMed] [Google Scholar]
- Collison LW, Vignali DA. Interleukin-35: odd one out or part of the family? Immunol Rev. 2008;226:248–62. doi: 10.1111/j.1600-065X.2008.00704.x. [DOI] [PMC free article] [PubMed] [Google Scholar]
- Collison LW, Workman CJ, Kuo TT. The inhibitory cytokine IL-35 contributes to regulatory T-cell function. Nature. 2007;450:566–9. doi: 10.1038/nature06306. [DOI] [PubMed] [Google Scholar]
- Collison LW, Chaturvedi V, Henderson AL, et al. IL-35-mediated induction of a potent regulatory T cell population. Nat Immunol. 2010;11:1093–101. doi: 10.1038/ni.1952. [DOI] [PMC free article] [PubMed] [Google Scholar]
- Collison LW, Delgoffe GM, Guy CS, et al. The composition and signaling of the IL-35 receptor are unconventional. Nat Immunol. 2012;13:290–9. doi: 10.1038/ni.2227. [DOI] [PMC free article] [PubMed] [Google Scholar]
- Wang RX, Yu CR, Dambuza IM, et al. Interleukin-35 induces regulatory B cells that suppress autoimmune disease. Nat Med. 2014;20:633–41. doi: 10.1038/nm.3554. [DOI] [PMC free article] [PubMed] [Google Scholar]
- Shen P, Roch T, Lampropoulou V, et al. IL-35-producing B cells are critical regulators of immunity during autoimmune and infectious diseases. Nature. 2014;507:366–70. doi: 10.1038/nature12979. [DOI] [PMC free article] [PubMed] [Google Scholar]
- Boggio E, Clemente N, Mondino A, et al. IL-17 protects T cells from apoptosis and contributes to development of ALPS-like phenotypes. Blood. 2013;123:1178–86. doi: 10.1182/blood-2013-07-518167. [DOI] [PubMed] [Google Scholar]
- Yu SL, Chan PK, Wong CK, et al. Antagonist-mediated down-regulation of Toll-like receptors increases the prevalence of human papillomavirus infection in systemic lupus erythematosus. Arthritis Res Ther. 2012;14:R80. doi: 10.1186/ar3803. [DOI] [PMC free article] [PubMed] [Google Scholar]
- Cao D, Malmstrom V, Baecher-Allan C, Hafler D, Klareskog L, Trollmo C, et al. Isolation and functional characterization of regulatory CD25brightCD4+ T cells from the target organ of patients with rheumatoid arthritis. Eur J Immunol. 2003;33:215–23. doi: 10.1002/immu.200390024. [DOI] [PubMed] [Google Scholar]
- Yang JQ, Wen X, Liu H. Examining the role of CD1d and natural killer T cells in the development of nephritis in a genetically susceptible lupus model. Arthritis Rheum. 2007;56:1219–33. doi: 10.1002/art.22490. [DOI] [PMC free article] [PubMed] [Google Scholar]
- Nozaki Y, Yamagata T, Yoo BS, et al. The beneficial effects of treatment with all-trans-retinoic acid plus corticosteroid on autoimmune nephritis in NZB/WF mice. Clin Exp Immunol. 2005;139:74–83. doi: 10.1111/j.1365-2249.2005.02654.x. [DOI] [PMC free article] [PubMed] [Google Scholar]
- Jacob N, Yang H, Pricop L, et al. Accelerated pathological and clinical nephritis in systemic lupus erythematosus-prone New Zealand Mixed 2328 mice doubly deficient in TNF receptor 1 and TNF receptor 2 via a Th17-associated pathway. J Immunol. 2009;182:2532–41. doi: 10.4049/jimmunol.0802948. [DOI] [PMC free article] [PubMed] [Google Scholar]
- Zagury D, Le Buanec H, Mathian A, et al. IFNalpha kinoid vaccine-induced neutralizing antibodies prevent clinical manifestations in a lupus flare murine model. Proc Natl Acad Sci USA. 2009;106:5294–9. doi: 10.1073/pnas.0900615106. [DOI] [PMC free article] [PubMed] [Google Scholar]
- Zhang Z, Kyttaris VC, Tsokos GC, et al. The role of IL-23/IL-17 axis in lupus nephritis. J Immunol. 2009;183:3160–9. doi: 10.4049/jimmunol.0900385. [DOI] [PMC free article] [PubMed] [Google Scholar]
- Ma J, Rossini M, Yang HC, Zuo Y, Fogo AB, Ichikawa I. Effects of podocyte injury on glomerular development. Pediatr Res. 2007;62:417–21. doi: 10.1203/PDR.0b013e31813cbed1. [DOI] [PubMed] [Google Scholar]
- Chan OT, Hannum LG, Haberman AM, Madaio MP, Shlomchik MJ. A novel mouse with B cells but lacking serum antibody reveals an antibody-independent role for B cells in murine lupus. J Exp Med. 1999;189:1639–48. doi: 10.1084/jem.189.10.1639. [DOI] [PMC free article] [PubMed] [Google Scholar]
- Moon HW, Kim BH, Park CM. CD4+CD25highFoxP3+ regulatory T-cells in hematologic diseases. Korean J Lab Med. 2011;31:231–7. doi: 10.3343/kjlm.2011.31.4.231. [DOI] [PMC free article] [PubMed] [Google Scholar]
- Elkord E, et al. Thymus-derived, peripherally derived, and in vitro-induced T regulatory cells. Front Immunol. 2014;5:17. doi: 10.3389/fimmu.2014.00017. [DOI] [PMC free article] [PubMed] [Google Scholar]
- Li Y, Wang Y, Liu Y, Zuo X, Lu X. The possible role of the novel cytokines IL-35 and IL-37 in inflammatory bowel disease. Mediat Inflamm. 2014;2014:136329. doi: 10.1155/2014/136329. [DOI] [PMC free article] [PubMed] [Google Scholar]
- Niedbala W, Wei XQ, Cai B. IL-35 is a novel cytokine with therapeutic effects against collagen-induced arthritis through the expansion of regulatory T cells and suppression of Th17 cells. Eur J Immunol. 2007;37:3021–9. doi: 10.1002/eji.200737810. [DOI] [PubMed] [Google Scholar]
- Liu JQ, Liu Z, Zhang X, et al. Increased Th17 and regulatory T cell responses in EBV-induced gene 3-deficient mice lead to marginally enhanced development of autoimmune encephalomyelitis. J Immunol. 2012;188:3099–106. doi: 10.4049/jimmunol.1100106. [DOI] [PMC free article] [PubMed] [Google Scholar]
- Tirotta E, Duncker P, Oak J, et al. Epstein-Barr virus-induced gene 3 negatively regulates neuroinflammation and T cell activation following coronavirus-induced encephalomyelitis. J Neuroimmunol. 2012;254:110–6. doi: 10.1016/j.jneuroim.2012.10.005. [DOI] [PMC free article] [PubMed] [Google Scholar]
- Kochetkova I, Golden S, Holderness K, Callis G, Pascual DW, et al. IL-35 stimulation of CD39+ regulatory T cells confers protection against collagen II-induced arthritis via the production of IL-10. J Immunol. 2010;184:7144–53. doi: 10.4049/jimmunol.0902739. [DOI] [PMC free article] [PubMed] [Google Scholar]
- Jalah R, Rosati M, Ganneru B. The p40 subunit of interleukin (IL)-12 promotes stabilization and export of the p35 subunit: implications for improved IL-12 cytokine production. J Biol Chem. 2013;288:6763–76. doi: 10.1074/jbc.M112.436675. [DOI] [PMC free article] [PubMed] [Google Scholar]
- Hamza T, Barnett JB, Li B, et al. Interleukin 12 a key immunoregulatory cytokine in infection applications. Int J Mol Sci. 2010;11:789–806. doi: 10.3390/ijms11030789. [DOI] [PMC free article] [PubMed] [Google Scholar]
- Chavele KM, Ehrenstein MR. Regulatory T-cells in systemic lupus erythematosus and rheumatoid arthritis. FEBS Lett. 2011;585:3603–10. doi: 10.1016/j.febslet.2011.07.043. [DOI] [PubMed] [Google Scholar]
- Sakaguchi S, Wing K, Onishi Y, Prieto-Martin P, Yamaguchi T. Regulatory T cells: how do they suppress immune responses? Int Immunol. 2009;21:1105–11. doi: 10.1093/intimm/dxp095. [DOI] [PubMed] [Google Scholar]
- Schmidt A, Oberle N, Krammer PH. Molecular mechanisms of Treg-mediated T cell suppression. Front Immunol. 2012;3:51. doi: 10.3389/fimmu.2012.00051. [DOI] [PMC free article] [PubMed] [Google Scholar]
- Olson BM, Sullivan JA, Burlingham WJ. Interleukin 35: a key mediator of suppression and the propagation of infectious tolerance. Front Immunol. 2013;4:315. doi: 10.3389/fimmu.2013.00315. [DOI] [PMC free article] [PubMed] [Google Scholar]
- Kuo J, Nardelli DT, Warner TF, Callister SM, Schell RF. Interleukin-35 enhances Lyme arthritis in Borrelia-vaccinated and -infected mice. Clin Vaccine Immunol. 2011;18:1125–32. doi: 10.1128/CVI.00052-11. [DOI] [PMC free article] [PubMed] [Google Scholar]
- Tao R, Wang L, Murphy KM, Fraser CC, Hancock WW. Regulatory T cell expression of herpesvirus entry mediator suppresses the function of B and T lymphocyte attenuator-positive effector T cells. J Immunol. 2008;180:6649–55. doi: 10.4049/jimmunol.180.10.6649. [DOI] [PubMed] [Google Scholar]
- Whibley N, Maccallum DM, Vickers MA. Expansion of Foxp3(+) T-cell populations by Candida albicans enhances both Th17-cell responses and fungal dissemination after intravenous challenge. Eur J Immunol. 2014;44:1069–83. doi: 10.1002/eji.201343604. [DOI] [PMC free article] [PubMed] [Google Scholar]
- Wong CK, Ho CY, Li EK, Lam CW, et al. Elevation of proinflammatory cytokine (IL-18, IL-17, IL-12) and Th2 cytokine (IL-4) concentrations in patients with systemic lupus erythematosus. Lupus. 2000;9:589–93. doi: 10.1191/096120300678828703. [DOI] [PubMed] [Google Scholar]
- Wong CK, Lit LC, Tam LS, Li EK, Wong PT, Lam CW. Hyperproduction of IL-23 and IL-17 in patients with systemic lupus erythematosus: implications for Th17-mediated inflammation in auto-immunity. Clin Immunol. 2008;127:385–93. doi: 10.1016/j.clim.2008.01.019. [DOI] [PubMed] [Google Scholar]
- Lit LC, Wong CK, Tam LS, Li EK, Lam CW. Raised plasma concentration and ex vivo production of inflammatory chemokines in patients with systemic lupus erythematosus. Ann Rheum Dis. 2006;65:209–15. doi: 10.1136/ard.2005.038315. [DOI] [PMC free article] [PubMed] [Google Scholar]
- Yu SL, Wong CK, Wong PT. Down-regulated NOD2 by immunosuppressants in peripheral blood cells in patients with SLE reduces the muramyl dipeptide-induced IL-10 production. PLOS ONE. 2011;6:e23855. doi: 10.1371/journal.pone.0023855. [DOI] [PMC free article] [PubMed] [Google Scholar]
- Kinoshita M, Seki S, Ono S, Shinomiya N, Hiraide H, et al. Paradoxical effect of IL-18 therapy on the severe and mild Escherichia coli infections in burn-injured mice. Ann Surg. 2004;240:313–20. doi: 10.1097/01.sla.0000133354.44709.28. [DOI] [PMC free article] [PubMed] [Google Scholar]
Associated Data
This section collects any data citations, data availability statements, or supplementary materials included in this article.
Supplementary Materials
Table S1. Primers sequences used for real-time polymerase chain reaction (PCR).
Fig. S1. Effects of interleukin (IL)-35 treatment on nephritis disease in severe Murphy Roths Large (MRL)/lpr mice. Kidney tissues from severe MRL/lpr mice were collected and fixed in 4% paraformaldehyde. The tissue sections were stained with periodic acid-Schiff (PAS) staining. Representative kidney histopathology in (a,b) phosphate-buffered saline (PBS) and (c,d) IL-35-treated MRL/lpr mice are shown. (a,c) Periodic acid Schiff (PAS) staining of a representative perivascular area is shown (×100). Black arrows point the mononuclear cells infiltration on vessel area. (b,d) PAS staining of a representative glomerulus area is shown (×400). Black arrows point the increased mesangial cells and glomerular mesangial expansion.
Fig. S2. Gene expression profile analysis of Janus kinase/signal transducer and activator of transcription (JAK/STAT) signalling pathway. The mRNA was extracted from splenic CD4+ T helper (Th) cells of Murphy Roths Large (MRL)/lpr mice with interleukin (IL)-35 or phosphate-buffered saline (PBS) treatment. Each row and column represents a separate gene and separate subgroups of JAK/STAT signalling pathway and their related target genes, respectively, in each frame. The normalized expression index for each transcript sequence (rows) in each subgroup (columns) is indicated by a colour code. Relative gene expression compared with internal housekeeping genes from IL-35- versus PBS-treated MRL/lpr mice was analysed by online polymerase chain reaction (PCR). Array Data Analysis Software (Qiagen). The visualized heatmaps are exported from range approximately 0 (bright green) to twofold increase (bright red) by software HemI (Heatmap Illustrator, version 1.0; Wuhan, Hubei, China).
Fig. S3. Flow cytometric analysis of the relative frequencies of CD4+CD25+forkhead box protein 3 (FoxP3)+ regulatory T cells (Treg) in Murphy Roths Large (MRL)/lpr and BALB/c mice with interleukin (IL)-35 or phosphate-buffered saline (PBS) treatment. Single-cell suspensions were obtained from MRL/lpr and BALB/c mice spleen, thymus and peripheral blood cells. The cells were stained with fluorochrome-labelled antibodies against CD4, CD25 and FoxP3. Representative dot-plots of CD4+CD25+ T cells and FoxP3+ Treg cells are presented. The representative percentage of CD4+CD25+FoxP3+ Treg cells in total lymphocytes is shown as FoxP3+ gating in different mouse groups.
Fig. S4. Flow cytometric analysis of the relative frequencies of CD19+CD5+CD1d+interleukin (IL)-10+ regulatory B cells (Breg) in Murphy Roths Large (MRL)/lpr and BALB/c mice with IL-35 or phosphate-buffered saline (PBS) treatment. Single-cell suspensions were obtained from MRL/lpr and BALB/c mice spleen, thymus and peripheral blood cells. The cells were stained with fluorochrome-labelled antibodies against CD19, CD5, CD1d and IL-10. Representative dot-plots of CD19+IL-10+ B cells and CD5+CD1d+ Breg cells are presented. The representative percentage of CD19+CD5+CD1d+IL-10+ Breg cells in total lymphocytes is shown as quadruple positive gating in different mouse groups.
Fig. S5. Clinical characteristics of Murphy Roths Large (MRL)/lpr mice with interleukin (IL)-35 or phosphate-buffered saline (PBS) injection. The 20–24-week-old MRL/lpr mice were injected intravenously (i.v.) with recombinant mouse IL-35 (200 or 400 ng/mouse) or PBS daily for 7 days (n = 3 in each treatment group). The results of each score system of the signs: (a) proteinuria, (b) leucocytuira, (c) lupus flare, (d) glomerulonephritis, (e) interstitial nephritis and (f) vessels infiltration are presented as bar charts with the arithmetic mean plus standard error of the mean.


