

Abstract
Heme oxygenase-1 (HO-1) contribution to iron homeostasis has been postulated, because it facilitates iron recycling by liberating iron mostly from heme catabolism. This enzyme also appears to be responsible for the resolution of inflammatory conditions. In a patient with HO-1 deficiency, inflammation and dysregulation of body iron homeostasis, including anemia and liver and kidney hemosiderosis, are evidenced. Here we postulated that HO-1 is critical in the regulation of ferroportin, the major cellular iron exporter, and hepcidin, the key regulator of iron homeostasis central in the pathogenesis of anemia of inflammation. Our current experiments in human THP-1 monocytic cells indicate a HO-1-induced iron-mediated surface-ferroportin expression, consistent with the role of HO-1 in iron recycling. Surprisingly, we observed low hepcidin levels in the HO-1-deficient patient, despite the presence of inflammation and hemosiderosis, both inducers of hepcidin. Instead, we observed highly increased soluble transferrin receptor levels. This suggests that the decreased hepcidin levels in HO-1 deficiency reflect the increased need for iron in the bone marrow due to the anaemia. Using human hepatoma cells, we demonstrate that HO-activity did not have a direct modulating effect on expression of HAMP, the gene that encodes for hepcidin. Therefore, we argue that the decreased iron recycling may, in part, have contributed to the low hepcidin levels. These findings indicate that dysregulation of iron homeostasis in HO-1 deficiency is the result of both defective iron recycling and erythroid activity-associated inhibition of hepcidin expression. This study therefore shows a crucial role for HO-1 in maintaining body iron balance.
Keywords: heme oxygenase-1, inflammation, iron, hepcidin and hepaidin, ferroportin
Introduction
Heme oxygenase (HO) catalyses the break-down of haem into carbon monoxide (CO), free iron, and biliverdin that is rapidly converted into bilirubin by biliverdin reductase. To date, two functional isoforms of HO have been described in human beings [1]. HO-1 is inducible by diverse stimuli, including mediators of oxidative stress and inflammation, whereas HO-2 is thought to be mainly constitutively expressed [2]. HO-1 is important as part of the defense mechanism against oxidative stress and inflammation. Moreover, because HO-1 is largely responsible for iron recycling by liberating iron mostly from haem catabolism after phagocytosis of senescent erythrocytes by tissue macrophages, its contribution to iron homeostasis has been postulated.
Recently, hepcidin, a peptide mostly produced in hepatocytes that is encoded by the HAMP gene in human beings, has been demonstrated as a key regulator of body iron homeostasis [3]. This peptide inhibits iron efflux from enterocytes and macrophages by inactivating the major cellular iron exporter, ferroportin [4, 5]. Hepcidin action may explain several genetic causes of iron overload syndrome [6]. Additionally, hepcidin levels are elevated during inflammation [3]. This acts on the one hand as a crucial causative factor in pathogenesis of anaemia of inflammation, by retention of heme-derived iron in the iron storage sites, thereby withholding it from the erythroid compartment [7–9] On the other hand, hepcidin suppression is observed in anemias, necessary to increase iron supply needed for the accelerated erythropoietic activity [10].
It has been reported that HO-1 deficiency in human exhibits both signs of inflammation and dysregulation of body iron homeostasis, such as iron accumulation in the kidneys and the liver (Table 1) [11, 12]. Similarly, Ho-1 knock-out mice (Ho-1 KO mice) developed severe inflammation and anemia associated with low transferrin iron, and also hepatic and renal iron accumulation (Table 1) [13]. Therefore, it has been proposed that HO-1 facilitates iron efflux from hepatic and renal cells. Another in vitro study suggested a function for HO-1 in regulating cellular iron by inducing iron efflux [14]. Indeed, in 2000, the same group proposed the presence of an iron ATPase transporter that in association with HO-1 acts as an iron exporter [15].
Table 1.
Comparison of some conditions between HO-1-deficient mice and man
| HO-1-deficient mice [13] | HO-1-deficient patient [11, 12] | |
|---|---|---|
| Anemia | + | + |
| Fragmentation | ? | + |
| RBC morphology | Microcytic, anisocytosis | Microcytic, anisocytosis |
| Blood transfusion | – | Regularly |
| Leukocytosis | + | + |
| Ferritin | Elevated | Elevated |
| Serum iron | Low | Low normal |
| Transferrin saturation | Low | Low |
| Hemosiderosis | Hepatic parenchymal and Kupffer cells, renal proximal tubules | Hepatic parenchymal and Kupffer cells, renal proximal tubules |
| Hepatomegaly | + | + |
| Splenomegaly | Enlarged spleen | Asplenia |
| Glomerulonephritis | + | + |
| Chronic inflammation | Progressive | Steady, receiving anti-inflammatory medications |
HO-1, heme oxygenase-1; RBC, red blood cells.
In the present study, we hypothesized that dysregulation of iron homeostasis present in HO-1 deficiency was mediated by modulation of hepcidin expression. We therefore investigated HO-1 cross-talk with hepcidin and ferroportin, in order to delineate the mechanistic basis of body iron regulation, and furthermore to help explain the dysregulation of iron homeostasis in HO-1 deficiency. Direct links between HO-1 and HAMP expression were assessed in human hepatoma cell lines, whereas effects of HO-1 on ferroportin expression were examined in human THP-1 monocytic cells. Furthermore, we evaluated these results with the measured levels of serum hepcidin, inflammatory markers, hematological measurements and iron parameters, in blood or serum samples of the HO-1-deficient patient.
Materials, methods and patient
Cell culture
Both human hepatoma cell lines, HepG2 and Hep3B, were cultured in a humidified 37°C incubator with 5% CO2 using PC-1 medium (Cambrex, Walkersville, MD, USA). Human THP-1 monocytic cells were cultured in RPMI1640 (Gibco, Breda, The Netherlands) supplemented with 2 mmol/l L-glutamine and 10% heat-inactivated foetal calf serum (Gibco).
Viability test
Cell viability after various treatments was monitored using a standard trypan blue exclusion test. In all experiments, both hepatoma and THP-1 cells were >95% viable after indicated treatments.
Quantitative polymerase chain reaction (Q-PCR)
Confluent hepatoma cells were treated for 6 hrs with different agents, including tin mesoporphyrin (SnMP, Frontier Scientific, UT, USA), cobalt protophorphyrin (CoPP, Frontier Scientific), hemin (Frontier Scientific) as the source of heme, and interleukin-6 (IL-6, R&D systems, Minneapolis, MN, USA). Two mmol/l stock solutions of SnMP, CoPP and hemin were freshly prepared as previously described [16]. Isolation of total RNA and subsequent cDNA synthesis were performed [17], followed by Q-PCR of the following human cDNAs: HAMP, HO-1 and, for normalization of expression, the housekeeping gene hypoxanthine phosphoribosyltransferase (HPRT). Q-PCR was performed in a 25-μl total reaction, using TaqMan Universal Master Mix (PE Applied Biosystems, Foster City, CA, USA). TaqMan enzyme was activated for 10 min. at 95°C before 40 two-step cycles were performed (30 sec., 95°C; 1 min., 60°C) in a ABI Prism 7700 (PE Applied Biosystems). All primers and probes were purchased from PE Applied Biosystems (HAMP, assay no. Hs00221783_m1; HO-1, assay no. Hs00157965_m1; HPRT, assay no. 4310890E). Relative expression of the specific target gene in comparison to the reference housekeeping gene was calculated based on a mathematical model as previously described [18].
Flow cytometry
After treatment with HO-1 inducers, HO-activity inhibitor, Fe(III)ammoniumcitrate (Sigma, MO, USA) or deferoxamine (DF, Novartis, The Netherlands), THP-1 cells were fixed using phosphate-buffered saline (PBS, Gibco) containing 4% paraformaldehyde (Sigma) for 5 min. Blocking of Fc receptors was carried out by incubating the cells in PBS containing 20% normal human serum (NHS) for 30 min. at 4°C. Incubation with 1:25 ferroportin antibody (a generous gift from Dr. A.T. Mckie and Dr. G.O. Latunde-dada, King’s College, London, UK), 1:50 HO-1 antibody (SPA895, Stressgen Sanbio, Uden, The Netherlands) or 5 μg/ml rabbit IgG isotype control (Rockland Immunochemicals, Gilbertsville, PA, USA) was done for 3 hrs in PBS containing 10% NHS at 4°C. After washing, labelling with 5 μg/ml Alexa-fluor-488-labelled secondary antibody (Molecular Probes, Eugene, OR, USA) was performed for 30 min. in PBS containing 10% NHS at 4°C. For HO-1 labelling, 0.05% tween-20 (Sigma) was included during incubation for permeabilization. Each flow cytometric measurement was performed using a Becton Dickinson FACScan (Oxnard, CA, USA) and 1 × 10⁴ cells were analysed.
HO-activity assay
After treatment as described in the previous section, 1 × 10⁵ cells were resuspended in 89.9 μl 0.1 mol/l phosphate buffer, 2 mmol/l MgCl2 (pH 7.4) and subsequently lysed by three freeze-thaw cycles. HO-activity was measured as described previously [55]. In brief: to the cell lysate, 10.1 μl master mix was added that consisted of 2.5 μl 80 mmol/l glucose-6-phosphate, 0.1 μl 0.5 U/μl glucose-6-phosphate dehydrogenase in 5 mmol/l glycine (both Sigma-Aldrich), 5 μl 32 mmol/l NADPH tetrasodium salt (Roche, Basel, Switzerland) and 2.5 μl 2 mmol/l hemin. The samples were incubated for 60 min. at 37°C in the dark. Next, 100 μl methanol was added and the samples were centrifuged at 13,000 ×g. A 50-μl aliquot of this sample was run on a HPLC (Spectrasystem SCM400, Spectra-Physics Analytical, Minneapolis, MN, USA) equipped with a 5 μm discovery C18 column and a discovery C18 super guard cartridge 5 μm particle size precolumn (both Sigma-Aldrich). Separation was done by performing a gradient of 80% solvent A (40% 100 mmol/l ammoniumacetate pH 5.5, 5% methoxy ethanol and 50% methanol (all Sigma-Aldrich) to 20% solvent B (5% methoxy ethanol and 95% methanol) over a 20-min. time interval at a flow rate of 1 ml/min. Biliverdin and bilirubin were detected at a wavelength of 377 and 450 nm, respectively. Standards of biliverdin and bilirubin (both Frontier Scientific) were also run in order to quantify the amount of biliverdin/bilirubin found in the samples.
Fluorescence microscopy
After treatment, THP-1 cells were spun at 500 ×g for 10 min. in 100 μl PBS onto a slide, air dried and fixed in acetone. Incubation with 1:25 ferroportin antibody was done for 1 hr in PBS containing 10% NHS at room temperature. After careful washing, labelling with 5 μg/ml Alexa-fluor-488-labelled secondary antibody was performed for 30 min. in PBS containing 10% NHS at room temperature. The slide was covered with fluorescence-preserving mounting media (Invitrogen Lifesciences, Breda, The Netherlands) and a glass cover slip, and further visualized using a Leica fluorescence microscope (Leica Microsystems, GmbH, Heidelberg, Germany).
Calcein assay for measurement of intracellular labile iron
A calcein assay was used to monitor intracellular labile iron accumulation as described elsewhere [19, 20]. In this assay, after treatment and washing, hepatoma or THP-1 cells were incubated with 0.1 μmol/l calcein-AM (Molecular Probes, OR, USA) for 30 min. at 37°C, in the presence of 5 μmol/l PSC-833, a P-glycoprotein inhibitor (Novartis), to avoid efflux of calcein-AM [21]. The cells were then washed twice to remove the remaining extracellular calcein-AM. The fluorescence signals of calcein (excitation 485 nm, emission 530 nm) were read in the Cytofluor II microplate reader (Perspective Biosystems, Framingham, MA, USA). Fractional decreases in fluorescence intensity correlates with intracellular labile iron level [19, 20]. Fe(III)ammoniumcitrate was used as a positive control to illustrate sensitivity of the assay.
HO-1-deficient patient and laboratory measurements
A patient with no functional HO-1 expression because of a two-nucleotide deletion within exon3 and a complete loss of exon2 of the HO-1 genes has been described previously [11, 12]. Informed consent was obtained and the study was approved by the Ethics Committee of Kanazawa University [11, 12]. The sera of the patient taken at two different time points exhibited low transferrin saturation, but elevated levels of ferritin and heme (Table 2). Several laboratory parameters of the sera, as shown in Table 2, were measured in previous studies [11, 12], and remeasured in the present study. The two samples were taken 5 months apart when the patient was 6 years old. The boy died several months after the last blood sample was taken. Both samples were stored at −80°C. Remeasurement of laboratory parameters of the stored samples in the present study was carried out using routine laboratory methods [8] (Department of Clinical Chemistry, Radboud University Nijmegen Medical Centre, The Netherlands). Serum hepcidin was measured using surface-enhanced laser desorption/ionization time-of-flight mass spectrometry (SELDI-TOF-MS) as described elsewhere [22]. As reference values, hepcidin levels were measured in sera of healthy volunteers that had been stored at −80°C for a similar period of time as the patient sera, i.e. 8 years. Soluble transferrin receptor (sTfR) was measured using the Dade Behring sTfR assay (Marburg, Germany). Ferric iron deposition has been reported in the renal and hepatic tissues, following a standard Prussian-blue staining method (Table 1) [11, 12]. The patient also suffered from persistent haemolytic anaemia, characterized by erythrocyte fragmentation and elevated LDH and aspartate aminotransferase (AST) levels in the presence of only slightly elevated alanine aminotransferase (ALT) levels (Table 2). The patient was asplenic and required regular transfusions of erythrocytes (Table 1).
Table 2.
Hematological, iron and inflammatory parameters of the HO-1-deficient patient
| First blood sampling | Second blood sampling | Reference values | |
|---|---|---|---|
| Hematological parameters | |||
| WBC (/μl) | 27,300 | 19,300 | 3300–8800 |
| RBC (×104/μl) | 221 | 195 | 430–550 |
| Hb (g/dl) | 7.1 | 5.6 | 13.5–17.0 |
| Hct (%) | 19.1 | 15.3 | 39.7–51.0 |
| MCV (fL) | 86.4 | 78.5 | 83–102 |
| MCHC (%) | 37.2 | 36.6 | 32–36 |
| Iron parameters | |||
| Ferritin (ng/ml) | 965 (2146) | 595 (2065) | 6–280 (26–360) |
| TIBC (μmol/l) | 98 (94) | 76 (82) | 48–71 (45–75) |
| Serum iron (μmol/l) | 7.5 (12) | 12 (10) | 8.9–30 (7–25) |
| Transferrin saturation (%) | (12.8) | (12.2) | (17–42) |
| Transferrin (mg/dl) | 424 | n.d. | 214–390 |
| Serum heme (μmol/l) | > 400 | > 400 | <1 |
| Inflammatory parameters and organ injury | |||
| CRP (mg/l) | 12.4 (17) | 6.1(9) | <0.5 (<10) |
| IL-6 (pg/ml) | (20) | (28) | (<5) |
| Creatinine (μmol/l) | (97) | (74) | (44–71) |
| ALT (IU/l) | 40 (49) | 40 (54) | 2–39 (10–25) |
| AST (IU/l) | 408 | 369 | 15–50 |
| LDH (IU/l) | 18,010 | 19,620 | 196–355 |
| TP (g/dl) | 10.1 | 9.1 | 6.6–8.1 |
| Haptoglobin (mg/dl) | 878 | n.d. | 30–252 |
| Serum hepcidin (MInt/l) | (<0.1) | (<0.1) | (0.6–9.9)‡, (1.02–6.26)* |
| sTfR (mg/l) | (19.4) | (34.1) | (0.76 – 1.76) |
Laboratory parameters were measured in previous studies [11, 12] and the present study. The presented values measured in the present study are in brackets. Reference values were based on the laboratory standards for males age 4–9 years old (Department of Clinical Chemistry, Radboud University Nijmegen Medical Centre, The Netherlands) or previous studies [11, 12]. ‡Based on a range of values obtained from 20 fresh sera of normal controls [22]. *Based on values obtained from 6- to 8-year stored sera of normal controls (Mint/l). HO-1, heme oxygenase-1; WBC, white blood cells; RBC, red blood cells; Hb, haemoglobin; Hct, hematocrit; MCV, mean corpuscular volume; MCHC, mean corpuscular haemoglobin concentration; TIBC, total iron-binding capacity; CRP, C-reactive protein; IL-6, interleukin-6; TNF-α, tumour necrosis factor-α; ALT, alanine aminotransferase; AST, aspartate aminotransferase; LDH, lactate dehydrogenase; TP, total protein; sTfR, soluble transferrin receptor; IU, international unit; Mint/l, Mega intensity/litre; *as previously described [22]; n.d., not determined.
Statistical analysis
Results are expressed as means ± standard errors of the means (S.E.). Differences in quantitative measures were tested for significance using one-way anova. All statistics were performed using the GraphPad Prism 4 statistical program (San Diego, CA, USA).
Results
HO-activity increases intracellular labile iron levels in THP-1 cells
Previous studies [13–15] have suggested a role for HO-1 in maintaining intracellular iron levels by promoting iron efflux. This may imply a central role for HO-1 in maintaining intracellular iron homeostasis. Here, we analysed intracellular labile iron pool in THP-1 cells after induction or inhibition of HO-activity, utilizing a calcein assay.
In THP-1 cells, 24 hrs treatment with Fe(III)ammoniumcitrate quenched the calcein signal (Fig. 1). The quenched signal was returned to basal levels when DF, the specific iron chelator, was added. This result indicates that iron-rich conditions promote intracellular labile iron accumulation. In these cells, 24-hr induction of HO-1 by heme also promoted calcein quenching (Fig. 1). This effect could be counteracted using SnMP, the specific HO-activity inhibitor. Thus, this result indicates that iron derived from intracellular heme degradation by HO-activity contributes to the increased levels of intracellular labile iron. However, the specific HO-1 inducer CoPP [23] did not promote accumulation of intracellular labile iron in THP-1 cells. This is likely due to a shortage of heme as the substrate of HO in the cells after 24 hrs of CoPP incubation [24, 25]. IL-6 treatment moreover did not affect the levels of intracellular labile iron. Taken together, our data demonstrate that increased HO-activity, in the presence of sufficient heme substrate, promotes accumulation of intracellular labile iron. Thus although HO-1 promotes cellular iron efflux [13–15], the level of intracellular labile iron is still increased.
Figure 1.
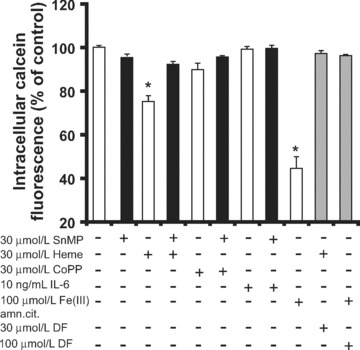
Detection of intracellular labile iron in THP-1 cells. Calcein assay was performed in THP-1 cells after indicated treatments for 24 hrs. Quenching of calcein fluorescence indicates increased intracellular labile iron. Each measurement is the mean value ± S.E., n= 3, *lower than the corresponding controls (P < 0.05).
The calcein assay was carried out in the presence or absence of PSC-833, an inhibitor of the calcein-AM transporter, P-glycoprotein, to avoid efflux of calcein-AM [21]. However, no differences in calcein quenching levels were observed when the results were compared with the assays performed without PSC-833 (data not shown).
Ferroportin induction by intracellular labile iron in human macrophage/monocyte-like cells
To examine whether HO-1 could directly regulate the iron exporter ferroportin, expression of ferroportin in THP-1 cells treated with HO-activity modifying agents was analysed. This study was also aimed to examine direct involvement of HO-1 in cellular iron efflux as has been postulated [13–15].
Increased HO-1 synthesis in THP-1 by heme (Fig. 2A and B) correlated with elevated expression of surface ferroportin (Fig. 3A–C). Here, an incubation period of 24 hrs was chosen to allow stable surface expression of ferroportin on THP-1 cells. Addition of the specific HO-activity inhibitor SnMP [16, 26] did not affect heme-induced HO-1 expression (Fig. 2B), however, it counteracted HO-induced ferroportin expression (Fig. 3B), confirming that HO-activity modulates surface ferroportin expression.
Figure 2.

Detection of HO-1 protein expression in THP-1 cells. HO-1 expression was analysed by FACS analysis in THP-1 cells after indicated treatments for 24 hrs. Prior to FACS analysis, cells were permeabilized and stained with anti-HO-1 IgG antibody, followed by the labelled secondary antibody. (A) The histogram illustrates several read-outs of FACS analysis, y-axis = events or cell numbers, x-axis = protein expression based on fluorescence intensity, a.u. = arbitrary units. IgG control = cells stained with IgG isotype control. (B) shows HO-1 expression levels in THP-1 cells after indicated treatments. Each FACS measurement is the mean value ± S.E., n= 3–4, *lower than the corresponding controls (P < 0.05).
Figure 3.
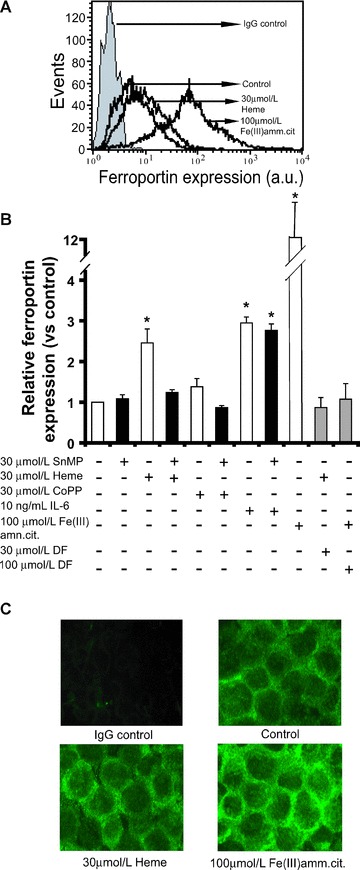
Detection of ferroportin protein expression on THP-1 cells. Ferroportin expression was analysed by FACS analysis on THP-1 cells after indicated treatments for 24 hrs. Prior to FACS analysis, cells were fluorescently stained with anti-ferroportin antibody, followed by the labelled secondary antibody. (A) The histogram illustrates several read-outs of FACS analysis, y-axis = events or cell numbers, x-axis = protein expression based on fluorescence intensity, a.u. = arbitrary units. IgG control = cells stained with IgG isotype control. (B) shows ferroportin expression levels in THP-1 cells after indicated treatments. Each FACS measurement is the mean value ± S.E., n= 3–4, *lower than the corresponding controls (P < 0.05). (C) After 24 hrs of specified treatments, THP-1 cells were stained using anti-ferroportin antibody, followed by the labelled secondary antibody. Expression of surface ferroportin in green was visualized using fluorescence microscopy. Enhanced green colour indicates increased ferroportin expression. The images are representative of two independent experiments.
THP-1 incubation with CoPP for 24 hrs, however, although promoting HO-1 expression (Fig. 2B), did not stimulate ferroportin expression (Fig. 3B). This is consistent with the absence of intracellular iron accumulation after CoPP stimulation (Fig. 1). Thus, increased intracellular labile iron levels are necessary for induction of ferroportin expression. This was supported by our observation that iron chelator DF was able to counteract both heme-induced and iron-induced ferroportin expression (Fig. 3B). DF appeared to also counteract the increased levels of intracellular labile iron (Fig. 1).
In addition, we observed that ferroportin expression was induced by IL-6 (Fig. 3B). Such induction of ferroportin by a proinflammatory cytokine has been previously reported [27]. This induction however is likely independent of HO-activity because SnMP did not counteract the effect of IL-6.
Taken together, the results indicate that surface ferroportin expression is induced by intracellular labile iron. These data therefore suggest that the previously described HO-1-induced iron efflux [13–15] is likely mediated by a heme-derived iron-induced ferroportin expression.
Despite chronic inflammation and tissue iron loading in the HO-1-deficient patient there is lack of hepcidin synthesis
Because HO-1 deficiency results in tissue iron loading (Table 1) and chronic inflammation shown by enhanced levels of IL-6, CRP and haptoglobin (Table 2), we questioned whether HO-1 modulates the synthesis of liver hepcidin. We measured hepcidin levels using SELDI-TOF-MS in serum samples of the HO-1-deficient patient and from six healthy volunteers that were stored in −80°C for a similar time period and thus served as reference values (Table 2). Hepcidin levels from two serum samples of the patient from different periods of collection were measured to monitor the consistency of the values. Because of the presence of pathological chronic inflammation and tissue iron loading conditions, together with low transferrin saturation, but highly elevated ferritin levels (Table 2), hepcidin levels in the sera were expected to be increased. However, on the contrary, we found that hepcidin levels, in the two serum samples of the HO-1-deficient patient were very low (both values were <0.1 Mint/l, whereas normal range of fresh sera = 0.6–9.9 Mint/l [22], and normal range of stored sera = 1.02–6.26 Mint/l, Table 2). These measured low levels of hepcidin in the stored patient sera are likely reflecting actual levels because (1) based on our methodology of hepcidin measurement, serum hepcidin preserves its stability even after several freeze-thaw cycles during storage [22], (2) similarly, stored samples from healthy volunteers showed significantly higher levels of hepcidin, (3) additionally, values of both iron and serum parameters that had been measured previously in the fresh samples of the HO-1 patient [11] were similar as measured in the present study (Table 2), indicating that the stored serum samples were well preserved, and (4) moreover, both patient serum samples collected at different sampling points consistently showed low hepcidin levels. Together, these observations provide a strong argument that the HO-1 deficiency led to decreased hepcidin synthesis. The ferritin values however were higher in the current measurements compared to the previous ones [11], which is likely due to different equipments used in the two laboratories, as well as to the worldwide variability and a lack of standardization in ferritin assays. Thus despite increased iron stores and inflammation, the patient has very low hepcidin levels.
HO-1-activity was inducible in human hepatoma cells, and promoted intracellular labile iron accumulation
Because HO-1 deficiency exhibited hepcidin suppression, we questioned whether HO-1 could directly modulate HAMP expression in liver cells. We first tested whether HO-1-activity could be induced in human hepatoma cells, and promote intracellular labile iron accumulation.
In HepG2 cells, treatment with 10 μM heme for 6 hrs promoted substantial induction of HO-activity when compared to basal activity levels, whereas exposure to 10 μM SnMP, completely abrogated HO-activity in these cells (data not shown). This confirms that in our in vitro systems, heme activated while SnMP inhibited HO-activity, as previously reported [16, 26].
In HepG2 and Hep3B cells (Fig. 4A), after 6 hrs, induction of HO-1 with heme or CoPP quenched the calcein signal, indicating accumulation of intracellular labile iron. The quenched calcein signal could be returned to basal levels when SnMP was added, demonstrating that HO-activity in human hepatoma cell lines also promotes intracellular iron accumulation. Cells treated with either increasing concentrations of heme (Fig. 4B) or Fe(III)ammoniumcitrate (Fig. 4C) also showed increased levels of intracellular labile iron. In agreement with previous observations using THP-1 cells, our data indicate that HO-1-activity promotes labile iron accumulation in the cells.
Figure 4.
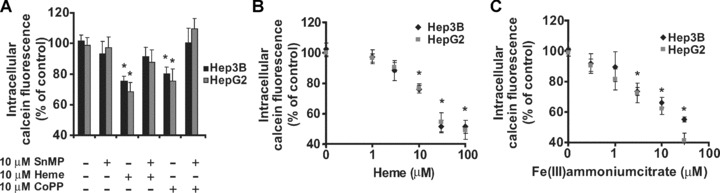
Detection of intracellular labile iron in human hepatoma cells, HepG2 and Hep3B. (A–C) show relative levels of intracellular iron after 6 hrs of indicated treatments. Quenching of calcein fluorescence indicates increased intracellular labile iron in the cells. Each measurement is the mean value ± S.E., n= 3–4, *lower than the corresponding controls (P < 0.05).
HO-1 does not modulate HAMP expression in human hepatoma cells
We next examined whether HO-1 could directly down-modulate HAMP expression in liver cells. To this end, we incubated HepG2 and Hep3B cells with HO-1 modulating agents, and measured HAMP transcript levels.
Incubation with the specific HO-activity inhibitor [16, 26], SnMP, for 6 hrs modulated neither the amount of HO-1 nor HAMP transcripts (Table 3). Likewise, prolonged incubation (i.e. 24 and 48 hrs, data not shown) did not affect transcript levels of both genes.
Table 3.
Transcript levels of HAMP and HO-1 in human hepatoma cells after 6 hrs of specified treatments
| Treatment | Relative HAMP expression | Relative HO-1 expression | ||
|---|---|---|---|---|
| Hep3B | HepG2 | Hep3B | HepG2 | |
| Control | 1 | 1 | 1 | 1 |
| 10 μmol/l SnMP | 1.2 ± 0.2 | 1.1 ± 0.2 | 1.7 ± 0.2 | 1.3 ± 0.3 |
| 20 μmol/l SnMP | 0.9 ± 0.3 | 1.8 ± 0.5 | 1.6 ± 0.8 | 1.9 ± 0.2 |
| 10 μmol/l CoPP | 0.8 ± 0.2 | 1.2 ± 0.4 | 65 ± 24* | 62 ± 15* |
| 10 μmol/l CoPP + 10 μmol/l SnMP | 0.7 ± 0.2 | 0.8 ± 0.3 | 62 ± 13* | 74 ± 14* |
| 10 ng/ml IL-6 | 72 ± 21* | 22 ± 7.2* | 3.4 ± 0.9 | 5.4 ± 2.1* |
| 10 ng/ml IL-6 + 10 μmol/l SnMP | 65 ± 11* | 20.4 ± 5.9* | 2.2 ± 1.1 | 5.2 ± 1.1* |
| 10 μmol/l heme | 0.4 ± 0.2 | 0.6 ± 0.3 | 75 ± 12 * | 69 ± 23* |
| 10 μmol/l heme + 10 μmol/l SnMP | 6.8 ± 2.1* | 6.4 ± 4.1 | 89 ± 22 * | 87 ± 14* |
| 10 μmol/l Fe(III)amn.cit. | 0.8 ± 0.2 | n.d. | 14.3 ± 1.5* | n.d. |
| 10 μmol/l Fe(III)amn.cit. + 10 μmol/l SnMP | 1.6 ± 0.4 | n.d. | 18.6 ± 3.9* | n.d. |
HO-1, heme oxygenase-1; SnMP, tin mesoporphyrin; CoPP, cobalt protoporphyrin; IL-6, interleukin-6; Fe(III)amn.cit., Fe(III)ammoniumcitrate. Each measurement is the mean value ± S.E., n= 3–4, n.d. = not determined
Higher than the corresponding controls (P < 0.05).
CoPP increased HO-1 transcripts in both cell lines, however HAMP expression was not changed. Moreover, inhibition of HO-activity using SnMP in the presence of CoPP did not alter HAMP transcription (Table 3). These results indicate no direct modulatory effects of HO-1 levels and HO-activity on HAMP expression.
In the presence of IL-6, both HO-1 and HAMP transcripts were up-regulated (Table 3). Because IL-6 could regulate both genes directly at transcriptional level [28–30], the observed up-regulation is likely independent from each other. Furthermore, when HO-activity was inhibited, IL-6-induced HAMP expression was not affected. This further confirms the absence of direct modulatory effects of HO-activity on HAMP expression in hepatoma cells.
In contrast, it was observed that upon HO-1 induction by heme, HAMP was slightly decreased, although this was not significant (Table 3). This effect may be attributed to increased levels of intracellular labile iron [31, 32] from heme degradation by HO-1 in hepatoma cells (Fig. 4). Similarly, after iron treatment (Table 3), although HO-1 is up-regulated, HAMP expression was not changed. In this iron-enriched condition, when HO-activity was inhibited by co-exposure to SnMP, HAMP expression stayed low (Table 3). On the other hand, in the presence of both heme and SnMP, the unmetabolized heme up-regulated HO-1, and to a lesser extent, enhanced HAMP expression. The latter observation however may not be relevant in vivo, because this requires complete inhibition of HO-activity, whereas in vivo, other pathways of heme degradation including the HO-2 pathway [2] are present. Taken together, these cellular data show lack of direct modulatory effects of HO-1 on cellular HAMP expression in vitro.
Anemia in HO-1 deficiency increases erythropoietic activity that attenuates hepcidin synthesis
Because no direct modulation by HO-activity on HAMP expression was found in vitro, we questioned why hepcidin levels were so low despite the presence of chronic inflammation and iron accumulation in the HO-1-deficient patient. Because hepcidin expression can be down-regulated when an elevated erythropoietic drive is present [10, 33–35], we postulated that this hepcidin suppression in the HO-1-deficient patient could be the result of increased erythropoietic activity. To verify this, we measured sTfR, a measure of erythropoietic activity in the bone marrow [36], in the patient sera. sTfR levels were exceptionally high (19.4 mg/l from the first taken serum, and 34.1 mg/l from the second drawn serum, reference values are 0.76–1.76 mg/l) (Table 2). Increased sTfR levels in the two samples correlated well with decreased Hb levels, erythrocyte counts and the increased levels of the hemolytic indices AST and LDH (Table 2).
Discussion
HO-1 is not only vital for iron recycling by liberating iron from heme and haemoproteins, it is also crucial for the resolution of oxidative stress and inflammatory conditions [1, 16, 37, 38]. HO-1 deficiency in vivo resulted in anaemia and hepatic and renal haemosiderosis [11, 16, 38–41]. The deficiency also promotes severe chronic inflammation [11, 16, 38–41] as shown by increased CRP, IL-6 and haptoglobin (Table 2). The serum levels of haptoglobin are usually very low during intravascular haemolysis, because haptoglobin binds to the free haemoglobin in the circulation which then will be rapidly cleared out by the reticuloendothelial system. In the HO-1 deficiency, markedly elevated haptoglobin levels are likely to be originated from the more dominant effect of inflammation than the observed haemolysis. Moreover, it was observed that the Kupffer cells of the HO-1-deficient patient had diminished haptoglobin-receptor levels (A. Yachie, unpublished observation). Finally, due to the asplenic condition, the clearance of haptoglobin-haemoglobin complex may also be prolonged in this patient. The circulating toxic unmetabolized heme may further enhance oxidant-mediated cellular damage [42, 43], inflammation [16, 37, 38] and haemolysis [11]. Similarly to the HO-1-deficient patient, accelerated hepatic iron loading has also been documented when Ho-1 KO mice were challenged with stress stimuli [39–41]. Together these data suggest that HO-1 is crucial for both cell protection against oxidative and inflammatory injury as well as for maintaining iron homeostasis.
Our experiments were aimed at resolving whether distortion of iron homeostasis in HO-1 deficiency is mediated by hepcidin. As demonstrated in hepatoma cells, direct modulation of HO-1 expression levels and HO-activity did not affect hepcidin expression, suggesting that HO-1 is not a direct upstream regulator of hepcidin expression.
To our surprise we observed very low serum hepcidin levels in the HO-1-deficient patient despite the presence of chronic inflammation and iron accumulation, both strong inducers of hepcidin. However, the observed hepcidin suppression is likely crucial as it provides bioavailable iron for erythropoiesis to compensate for the hemolysis and anemia (Fig. 5). Indeed, extremely high sTfR levels were measured, confirming the presence of increased erythropoietic activity. In agreement with our findings, in mice models of hemolysis, iron loading and inflammation are sustained, whereas production of hepcidin is suppressed [44]. This is further corroborated in a rat model of hemolysis [45]. The patient’s decreased serum hepcidin levels are thus likely to be the result of increased erythroid expansion that, by analogy with growth differentation factor-15 exclusively present in β-thalassaemia [35] through the systemic release of a thus far unknown factor, down-regulates hepatocyte hepcidin production. In addition, a down-regulatory effect of the anemia-associated tissue hypoxia on liver hepcidin expression may also contribute to the low hepcidin levels [46, 47].
Figure 5.
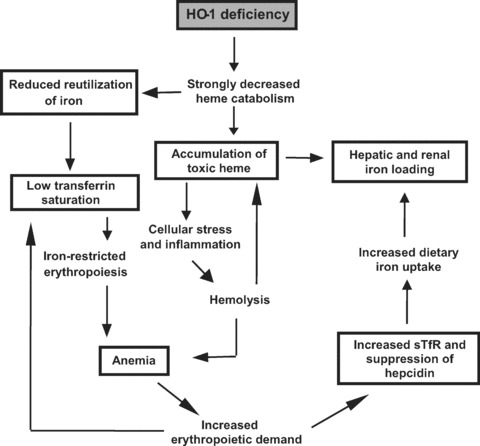
Proposed pathogenesis of heme oxygenase-1 deficiency. The figure illustrates the reported findings (in boxes) combined with current knowledge showing a hypothetical sequence of events initiated by HO-1 deficiency leading to severe dysregulation of iron metabolism. HO-1 deficiency promotes a substantial decrease in heme catabolism. This leads to iron-restricted erythropoiesis and stress-induced hemolysis, and both result in anemia. The anemia activates the body machinery of erythropoiesis, leading to induction of sTfR and suppression of hepcidin, necessary to fulfil iron demand for the accelerated marrow erythropoietic activity. The erythropoietic drive subsequently lowered serum iron and transferrin saturation. Suppression of hepcidin however promotes further distortion of iron homeostasis.
We further investigated whether HO-1 could directly modulate ferroportin expression. Surface expression of ferroportin [5] was increased in THP-1 monocytic cells when HO-1 expression was induced in the presence of sufficient heme substrate. When HO-activity was inhibited by SnMP, HO-mediated ferroportin expression was abrogated. This induction of ferroportin by HO-activity may explain previously-reported HO-1-induced iron efflux [14, 15]. However, HO-mediated ferroportin expression appeared to be regulated by the HO-derived effector molecule, iron, because deferoxamine, an iron chelator, could inhibit the HO-activity-induced ferroportin. Thus, these findings indicate that iron reutilization is affected in HO-1 deficiency [13], due to failure in heme catabolism, and not to the absence of HO-1 as a regulator of cellular iron homeostasis [14] nor as being part of a putative iron exporter [15] as previously suggested. The HO-derived iron-induced ferroportin protein expression is possibly regulated at the transcriptional level via its iron responsive element [48].
Under normal circumstances, HO-activity promotes heme catabolism and thereby facilitates iron recycling back to the plasma as iron-bound transferrin to exert its regulatory function via the hepatocyte transferrin receptors [49]. The decreased iron recycling, because of HO-1 deficiency, and subsequently, lower serum iron-transferrin levels may, in part, have contributed to the observed low hepcidin levels. Both decreased recycling of iron from heme and fast consumption of bioavailable iron from the circulation by the bone marrow for the increased erythropoiesis activity may therefore have promoted low levels of transferrin saturation in this patient (Fig. 5).
During hemolysis, clearance of plasma heme and heme-containing proteins is carried out by the proximal tubular cells of the kidneys. This event is deleterious for the kidneys as exemplified by the extent of iron deposition in the proximal tubuli [11] and the tubular atrophia [12] of the HO-1-deficient patient. Iron also accumulated in the liver, because this organ is capable of effectively incorporating the vast-majority of plasma heme [50]. The loosely bound Fe(III) accumulation detected in the liver and the kidneys of this patient by Prussian blue (Tables 1 and 3) could be originated from heme that was degraded to Fe(III) by other pathways than HO-1, including the HO-2 pathway, which is constitutively present at a low level [2] and the non-CO-forming pathways [50], or from the oxidized free heme [51].
Besides having defective macrophage iron recycling, HO-1 deficiency also exhibited hepatocyte iron loading in the liver (Table 1) [11, 12]. Similarly, Ho-1 KO mice show both hepatocyte and Kupffer iron overload [13], whereas stress stimuli further induce iron loading exclusively in hepatocytes [39]. In this study, we have observed low hepcidin levels in the patient with HO-1 deficiency, which are similar to that of patients with juvenile forms of hereditary hemochromatosis [52–54]. These low concentrations of hepcidin may help explain the presence of hepatocyte iron loading [11, 12]. Interestingly, notwithstanding the low hepcidin levels, and, therefore likely high surface ferroportin expression, in the HO-1-deficient patient, circulating iron levels are still low and iron accumulation is still present in the kidneys and the liver, suggesting that the export of cellular iron for the expanded erythopoiesis demand is still hampered in the patient. This further illustrates the crucial role of HO-1 to provide enough bioavailable iron for erythopogesis. Further studies however are warranted to unravel mechanisms involved during accelerated erythropogesis.
In this manuscript, we have examined the links between HO-1 and the recently found iron regulatory hormone hepcidin and its target molecule, ferroportin, in order to (i) delineate the mechanistic basis of iron regulation and furthermore to (ii) help explain the dysregulation of iron homeostasis in HO-1 deficiency. We provided evidence that HO-1 increases intracellular labile iron levels, which in monocytic cells induces expression of the iron exporter ferroportin. We observed very low hepcidin levels in the HO-1-deficient patient, despite the presence of chronic inflammation and iron accumulation, both inducers of hepcidin. This condition may be relevant to many iron-loading anemia disorders, in which erythroid regulators together with hypoxic conditions dominantly suppress synthesis of the iron hormone hepcidin, despite the presence of stimuli from both inflammatory and iron regulators. Summarizing, our data suggest that the imbalance of iron metabolism in the HO-1-deficient patient is a result of both defective iron recycling of the reticulo-endothelial-system after erythrophagocytosis, and reduced hepatocyte hepcidin expression secondary to anemia-induced expansion of erythropoiesis. These findings support crucial roles of HO-1 and hepcidin in maintaining systemic iron homeostasis.
Acknowledgments
The authors thank Dr. H. Tjalsma, Ms. C. Laarakkers and Ms. R. Roelofs for the discussion and expert technical assistance on SELDI-TOF-MS hepcidin measurement, and Department of Gastroenterology, Radboud University Nijmegen Medical Centre, The Netherlands, for providing cell culture facility. FADTGW was supported by the VENI grant no. 916.56.062 from NWO, The Netherlands.
References
- 1.Wagener FA, Volk HD, Willis D, et al. Different faces of the heme-heme oxygenase system in inflammation. Pharmacol Rev. 2003;55:551–71. doi: 10.1124/pr.55.3.5. [DOI] [PubMed] [Google Scholar]
- 2.Bauer I, Wanner GA, Rensing H, et al. Expression pattern of heme oxygenase isoenzymes 1 and 2 in normal and stress-exposed rat liver. Hepatology. 1998;27:829–38. doi: 10.1002/hep.510270327. [DOI] [PubMed] [Google Scholar]
- 3.Ganz T, Nemeth E. Regulation of iron acquisition and iron distribution in mammals. Biochim Biophys Acta. 2006;1763:690–9. doi: 10.1016/j.bbamcr.2006.03.014. [DOI] [PubMed] [Google Scholar]
- 4.Nemeth E, Tuttle MS, Powelson J, et al. Hepcidin regulates cellular iron efflux by binding to ferroportin and inducing its internalization. Science. 2004;306:2090–3. doi: 10.1126/science.1104742. [DOI] [PubMed] [Google Scholar]
- 5.Donovan A, Lima CA, Pinkus JL, et al. The iron exporter ferroportin/Slc40a1 is essential for iron homeostasis. Cell Metab. 2005;1:191–200. doi: 10.1016/j.cmet.2005.01.003. [DOI] [PubMed] [Google Scholar]
- 6.Swinkels DW, Janssen MC, Bergmans J, et al. Hereditary hemochromatosis: genetic complexity and new diagnostic approaches. Clin Chem. 2006;52:950–68. doi: 10.1373/clinchem.2006.068684. [DOI] [PubMed] [Google Scholar]
- 7.Nemeth E, Rivera S, Gabayan V, et al. IL-6 mediates hypoferremia of inflammation by inducing the synthesis of the iron regulatory hormone hepcidin. J Clin Invest. 2004;113:1271–6. doi: 10.1172/JCI20945. [DOI] [PMC free article] [PubMed] [Google Scholar]
- 8.Kemna EH, Pickkers P, Nemeth E, et al. Time-course analysis of hepcidin, serum iron, and plasma cytokine levels in humans injected with LPS. Blood. 2005;106:1864–6. doi: 10.1182/blood-2005-03-1159. [DOI] [PubMed] [Google Scholar]
- 9.Roy CN, Mak HH, Akpan I, et al. Hepcidin antimicrobial peptide transgenic mice exhibit features of the anemia of inflammation. Blood. 2007;109:4038–44. doi: 10.1182/blood-2006-10-051755. [DOI] [PMC free article] [PubMed] [Google Scholar]
- 10.Pak M, Lopez MA, Gabayan V, et al. Suppression of hepcidin during anemia requires erythropoietic activity. Blood. 2006;108:3730–5. doi: 10.1182/blood-2006-06-028787. [DOI] [PMC free article] [PubMed] [Google Scholar]
- 11.Yachie A, Niida Y, Wada T, et al. Oxidative stress causes enhanced endothelial cell injury in human heme oxygenase-1 deficiency. J Clin Invest. 1999;103:129–35. doi: 10.1172/JCI4165. [DOI] [PMC free article] [PubMed] [Google Scholar]
- 12.Kawashima A, Oda Y, Yachie A, et al. Heme oxygenase-1 deficiency: the first autopsy case. Hum Pathol. 2002;33:125–30. doi: 10.1053/hupa.2002.30217. [DOI] [PubMed] [Google Scholar]
- 13.Poss KD, Tonegawa S. Heme oxygenase 1 is required for mammalian iron reutilization. Proc Natl Acad Sci USA. 1997;94:10919–24. doi: 10.1073/pnas.94.20.10919. [DOI] [PMC free article] [PubMed] [Google Scholar]
- 14.Ferris CD, Jaffrey SR, Sawa A, et al. Heme oxygenase-1 prevents cell death by regulating cellular iron. Nat Cell Biol. 1999;1:152–7. doi: 10.1038/11072. [DOI] [PubMed] [Google Scholar]
- 15.Baranano DE, Wolosker H, Bae BI, et al. A mammalian iron ATPase induced by iron. J Biol Chem. 2000;275:15166–73. doi: 10.1074/jbc.275.20.15166. [DOI] [PubMed] [Google Scholar]
- 16.Wagener FA, Eggert A, Boerman OC, et al. Heme is a potent inducer of inflammation in mice and is counteracted by heme oxygenase. Blood. 2001;98:1802–11. doi: 10.1182/blood.v98.6.1802. [DOI] [PubMed] [Google Scholar]
- 17.de Kok JB, Ruers TJ, van Muijen GN, et al. Real-time quantification of human telomerase reverse transcriptase mRNA in tumors and healthy tissues. Clin Chem. 2000;46:313–8. [PubMed] [Google Scholar]
- 18.Pfaffl MW. A new mathematical model for relative quantification in real-time RT-PCR. Nucleic Acids Res. 2001;29:e45. doi: 10.1093/nar/29.9.e45. [DOI] [PMC free article] [PubMed] [Google Scholar]
- 19.Epsztejn S, Kakhlon O, Glickstein H, et al. Fluorescence analysis of the labile iron pool of mammalian cells. Anal Biochem. 1997;248:31–40. doi: 10.1006/abio.1997.2126. [DOI] [PubMed] [Google Scholar]
- 20.Kartikasari AE, Georgiou NA, Visseren FL, et al. Endothelial activation and induction of monocyte adhesion by nontransferrin-bound iron present in human sera. FASEB J. 2006;20:353–5. doi: 10.1096/fj.05-4700fje. [DOI] [PubMed] [Google Scholar]
- 21.Masereeuw R, Notenboom S, Smeets PH, et al. Impaired renal secretion of substrates for the multidrug resistance protein 2 in mutant transport-deficient (TR-) rats. J Am Soc Nephrol. 2003;14:2741–9. doi: 10.1097/01.asn.0000094083.82845.fa. [DOI] [PubMed] [Google Scholar]
- 22.Kemna EH, Tjalsma H, Podust VN, et al. Mass spectrometry-based hepcidin measurements in serum and urine: analytical aspects and clinical implications. Clin Chem. 2007;53:620–8. doi: 10.1373/clinchem.2006.079186. [DOI] [PubMed] [Google Scholar]
- 23.Smith A, Alam J, Escriba PV, et al. Regulation of heme oxygenase and metallothionein gene expression by the heme analogs, cobalt-, and tin-protoporphyrin. J Biol Chem. 1993;268:7365–71. [PubMed] [Google Scholar]
- 24.Sardana MK, Kappas A. Dual control mechanism for heme oxygenase: tin(IV)-protoporphyrin potently inhibits enzyme activity while markedly increasing content of enzyme protein in liver. Proc Natl Acad Sci USA. 1987;84:2464–8. doi: 10.1073/pnas.84.8.2464. [DOI] [PMC free article] [PubMed] [Google Scholar]
- 25.Shan Y, Lambrecht RW, Donohue SE, et al. Role of Bach1 and Nrf2 in up-regulation of the heme oxygenase-1 gene by cobalt protoporphyrin. FASEB J. 2006;20:2651–3. doi: 10.1096/fj.06-6346fje. [DOI] [PubMed] [Google Scholar]
- 26.Kappas A, Drummond GS, Henschke C, et al. Direct comparison of Sn-mesoporphyrin, an inhibitor of bilirubin production, and phototherapy in controlling hyperbilirubinemia in term and near-term newborns. Pediatrics. 1995;95:468–74. [PubMed] [Google Scholar]
- 27.di Patti MC, Persichini T, Mazzone V, et al. Interleukin-1beta up-regulates iron efflux in rat C6 glioma cells through modulation of ceruloplasmin and ferroportin-1 synthesis. Neurosci Lett. 2004;363:182–6. doi: 10.1016/j.neulet.2004.04.005. [DOI] [PubMed] [Google Scholar]
- 28.Verga Falzacappa MV, Vujic SM, Kessler R, et al. STAT-3 mediates hepatic hepcidin expression and its inflammatory stimulation. Blood. 2006;109:353–8. doi: 10.1182/blood-2006-07-033969. [DOI] [PubMed] [Google Scholar]
- 29.Wrighting DM, Andrews NC. Interleukin-6 induces hepcidin expression through STAT3. Blood. 2006;108:3204–9. doi: 10.1182/blood-2006-06-027631. [DOI] [PMC free article] [PubMed] [Google Scholar]
- 30.Tron K, Samoylenko A, Musikowski G, et al. Regulation of rat heme oxygenase-1 expression by interleukin-6 via the Jak/STAT pathway in hepatocytes. J Hepatol. 2006;45:72–80. doi: 10.1016/j.jhep.2005.12.019. [DOI] [PubMed] [Google Scholar]
- 31.Gehrke SG, Kulaksiz H, Herrmann T, et al. Expression of hepcidin in hereditary hemochromatosis: evidence for a regulation in response to the serum transferrin saturation and to non-transferrin-bound iron. Blood. 2003;102:371–6. doi: 10.1182/blood-2002-11-3610. [DOI] [PubMed] [Google Scholar]
- 32.Nemeth E, Valore EV, Territo M, et al. Hepcidin, a putative mediator of anemia of inflammation, is a type II acute-phase protein. Blood. 2003;101:2461–3. doi: 10.1182/blood-2002-10-3235. [DOI] [PubMed] [Google Scholar]
- 33.Vokurka M, Krijt J, Sulc K, et al. Hepcidin mRNA levels in mouse liver respond to inhibition of erythropoiesis. Physiol Res. 2006;55:667–74. doi: 10.33549/physiolres.930841. [DOI] [PubMed] [Google Scholar]
- 34.Kattamis A, Papassotiriou I, Palaiologou D, et al. The effects of erythropoietic activity and iron burden on hepcidin expression in patients with thalassemia major. Haematologica. 2006;91:809–12. [PubMed] [Google Scholar]
- 35.Tanno T, Bhanu NV, Oneal PA, et al. High levels of GDF15 in thalassemia suppress expression of the iron regulatory protein hepcidin. Nat Med. 2007;13:1096–101. doi: 10.1038/nm1629. [DOI] [PubMed] [Google Scholar]
- 36.Beguin Y. Soluble transferrin receptor for the evaluation of erythropoiesis and iron status. Clin Chim Acta. 2003;329:9–22. doi: 10.1016/s0009-8981(03)00005-6. [DOI] [PubMed] [Google Scholar]
- 37.Willis D, Moore AR, Frederick R, et al. Heme oxygenase: a novel target for the modulation of the inflammatory response. Nat Med. 1996;2:87–90. doi: 10.1038/nm0196-87. [DOI] [PubMed] [Google Scholar]
- 38.Koizumi S. Human heme oxygenase-1 deficiency: a lesson on serendipity in the discovery of the novel disease. Pediatr Int. 2007;49:125–32. doi: 10.1111/j.1442-200X.2007.02353.x. [DOI] [PubMed] [Google Scholar]
- 39.Poss KD, Tonegawa S. Reduced stress defense in heme oxygenase 1-deficient cells. Proc Natl Acad Sci USA. 1997;94:10925–30. doi: 10.1073/pnas.94.20.10925. [DOI] [PMC free article] [PubMed] [Google Scholar]
- 40.Wiesel P, Patel AP, DiFonzo N, et al. Endotoxin-induced mortality is related to increased oxidative stress and end-organ dysfunction, not refractory hypotension, in heme oxygenase-1-deficient mice. Circulation. 2000;102:3015–22. doi: 10.1161/01.cir.102.24.3015. [DOI] [PubMed] [Google Scholar]
- 41.Nath KA, Haggard JJ, Croatt AJ, et al. The indispensability of heme oxygenase-1 in protecting against acute heme protein-induced toxicity in vivo. Am J Pathol. 2000;156:1527–35. doi: 10.1016/S0002-9440(10)65024-9. [DOI] [PMC free article] [PubMed] [Google Scholar]
- 42.Balla J, Vercellotti GM, Jeney V, et al. Heme, heme oxygenase and ferritin in vascular endothelial cell injury. Mol Nutr Food Res. 2005;49:1030–43. doi: 10.1002/mnfr.200500076. [DOI] [PubMed] [Google Scholar]
- 43.Maruhashi K, Kasahara Y, Ohta K, et al. Paradoxical enhancement of oxidative cell injury by overexpression of heme oxygenase-1 in an anchorage-dependent cell ECV304. J Cell Biochem. 2004;93:552–62. doi: 10.1002/jcb.20170. [DOI] [PubMed] [Google Scholar]
- 44.De FL, Daraio F, Filippini A, et al. Liver expression of hepcidin and other iron genes in two mouse models of beta-thalassemia. Haematologica. 2006;91:1336–42. [PubMed] [Google Scholar]
- 45.Frazer DM, Inglis HR, Wilkins SJ, et al. Delayed hepcidin response explains the lag period in iron absorption following a stimulus to increase erythropoiesis. Gut. 2004;53:1509–15. doi: 10.1136/gut.2003.037416. [DOI] [PMC free article] [PubMed] [Google Scholar]
- 46.Peyssonnaux C, Zinkernagel AS, Schuepbach RA, et al. Regulation of iron homeostasis by the hypoxia-inducible transcription factors (HIFs) J Clin Invest. 2007;117:1926–32. doi: 10.1172/JCI31370. [DOI] [PMC free article] [PubMed] [Google Scholar]
- 47.Silvestri L, Pagani A, Camaschella C. Furin mediated release of soluble hemojuvelin: a new link between hypoxia and iron homeostasis. Blood. 2007;111:924–31. doi: 10.1182/blood-2007-07-100677. [DOI] [PubMed] [Google Scholar]
- 48.McKie AT, Marciani P, Rolfs A, et al. A novel duodenal iron-regulated transporter, IREG1, implicated in the basolateral transfer of iron to the circulation. Mol Cell. 2000;5:299–309. doi: 10.1016/s1097-2765(00)80425-6. [DOI] [PubMed] [Google Scholar]
- 49.Lin L, Valore EV, Nemeth E, et al. Iron transferrin regulates hepcidin synthesis in primary hepatocyte culture through hemojuvelin and BMP/ Blood. 2007;110:2182–9. doi: 10.1182/blood-2007-04-087593. [DOI] [PMC free article] [PubMed] [Google Scholar]
- 50.Bissell DM, Guzelian PS. Degradation of endogenous hepatic heme by pathways not yielding carbon monoxide. Studies in normal rat liver and in primary hepatocyte culture. J Clin Invest. 1980;65:1135–40. doi: 10.1172/JCI109767. [DOI] [PMC free article] [PubMed] [Google Scholar]
- 51.Ponka P. Cell biology of heme. Am J Med Sci. 1999;318:241–56. doi: 10.1097/00000441-199910000-00004. [DOI] [PubMed] [Google Scholar]
- 52.Papanikolaou G, Samuels ME, Ludwig EH, et al. Mutations in HFE2 cause iron overload in chromosome 1q-linked juvenile hemochromatosis. Nat Genet. 2004;36:77–82. doi: 10.1038/ng1274. [DOI] [PubMed] [Google Scholar]
- 53.van Dijk BA, Kemna EH, Tjalsma H, et al. Effect of the new HJV-L165X mutation on penetrance of HFE. Blood. 2007;109:5525–6. doi: 10.1182/blood-2006-11-058560. [DOI] [PubMed] [Google Scholar]
- 54.Papanikolaou G, Tzilianos M, Christakis JI, et al. Hepcidin in iron overload disorders. Blood. 2005;105:4103–5. doi: 10.1182/blood-2004-12-4844. [DOI] [PMC free article] [PubMed] [Google Scholar]
- 55.Scharstuhl A, Mutsaers HAM, Pennings SWC, et al. Curcumin-induced fibroblast apoptosis and in vitro wound contraction are regulated by antioxidants and heme oxygenase: implications for scar formation. J Cell Mol Med. 2009:712–25. doi: 10.1111/j.1582-4934.2008.00339.x. [DOI] [PMC free article] [PubMed] [Google Scholar]