

Abstract
In spite of growing evidence linking vitamin D3 levels to mental health disorders, little is known about its direct targets in the brain. This study set out to investigate targets of vitamin D3 in a human brain stem cell line. We employed arrays with antibodies directed against more than 600 structural and signalling proteins, including phospho-variants. Over 180 proteins responded to vitamin D3, such as cyclin-dependent protein-serine kinase 1/2, epidermal growth factor receptor-tyrosine kinase, protein kinase A, protein-serine kinase Bγ and protein-serine kinase Cα. PEA-15 (phosphoprotein enriched in astrocytes-15 kD, also known as PED), known to be involved in various anti-proliferative and anti-apoptotic effects, was strongly up-regulated. In silico promoter analysis revealed conserved binding sites for vitamin D3 receptor, suggesting a strong vitamin D3 dependency of the PEA-15 promoter. PEA-15 up-regulation by vitamin D3 could be confirmed by Western blot in two different cell lines. Analysis of mRNA and protein phosphorylation status of PEA-15 suggests that increased PEA-15 promoter activity and increased protein stabilization contribute to the overall rise of PEA-15 protein. In a functional test of this novel pathway, we demonstrated that vitamin D3 was able to rescue cells from TRAIL-induced apoptosis through regulation of the PEA-15 expression and function. Summarized, our study presents novel targets of vitamin D3 relevant for apoptosis and cell proliferation, and thus strongly supports a function of vitamin D3 in the brain that impacts on processes highly relevant for major neurological disorders.
Keywords: vitamin D3, brain, signalling, apoptosis, PED/PEA-15, human neuronal stem cells, protein antibody array
Introduction
The vitamin D3 receptor (VDR) is a member of the nuclear receptor superfamily of ligand-activated transcription factors and was first identified as a key player maintaining calcium and phosphate homeostasis [1]. VDR is activated upon binding of its ligand calcitriol (1,25(OH)2 vitamin D3, throughout the text referred to as ‘vitamin D3’). This leads to homodimerization of VDR or heterodimerization with other nuclear receptors, binding to vitamin D3 responsive elements (VDREs) and activation of the transcription of VDR target genes [2–5].
There is accumulating evidence that actions of VDR are not confined to processes related to calcium homeostasis and skeletal development, but extend to cell survival, differentiation [6, 7], proliferation [8, 9] and cell death [10]. VDR expression in the brain was first evidenced by autoradiographic hormone-binding studies in the 1980s, together with the report that effects of sunlight or equivalent artificial light on behavioral processes could at least partially be mediated through vitamin D3-endocrine system [11, 12]. Prenatal vitamin D3 deficiency was demonstrated to impair brain development in rats [13] and cause subtle alterations in their learning and memory abilities [14]. Together with dexamethasone, vitamin D3 down-regulated microglial activation in the rat hippocampus, thus reversing various neuroinflammatory age-related changes [15]. Furthermore, a low vitamin D3 status is associated with low mood and impaired measures of cognitive performance in humans [16], and could possibly contribute to the aetiology of schizophrenia [17, 18]. Recent findings suggest that regular use of cod liver oil (major natural source of vitamin D3) decreases depressive symptoms in the general population [19]. In addition, genetic variance in the VDR gene apparently influences the susceptibility to age-related changes in cognitive functioning and in depressive symptoms [20].
Although there is growing evidence linking vitamin D3 levels to mental health [21–23], little is known about its direct effects, genetic targets and modes of action in the brain. With this study, we aimed to search for signalling pathways affected by vitamin D3 in the human CNS. As a model, we chose the human neuronal stem cell line HNSC.100, derived from a 10–10.5 weeks gestational age human Caucasian embryo and immortalized by v-myc expression [24]. These cells can be differentiated (by addition of CNTF) to up-regulate markers of three lineages (astrocytes ≥ 85%, neurons 10–15% and oligodendrocytes ≤ 1%; [24, 25]).
We first employed antibody microarrays (featuring over 600 different antibodies) to detect proteins that were changed in their expression and/or activation upon treatment with vitamin D3. The most prominent candidates were then further tested by Western blot analysis. Several structural and signalling targets of vitamin D3 were detected, with particularly strong up-regulation of PEA-15 (Phosphoprotein Enriched in Astrocytes-15 kD, also known as PED). This was highly interesting, because PEA-15 is a major phosphoprotein and an endogenous substrate for protein kinase C in astrocytes. It contains the death effector domain (DED) and is predominantly expressed in the central nervous system [26]. Among other functions, PEA-15 regulates the sub-cellular localization of ERK MAP kinase [27] and is linked to various anti-apoptotic and anti-proliferative effects [28–31]. For example, PEA-15 expression protected astrocytes from PEA-15 knockout mice from TNF-induced apoptosis [32] and transfection of PEA-15 cDNA in TRAIL (TNF-related apoptosis inducing ligand)–sensitive glioma cells rendered these cells resistant to TRAIL-induced apoptosis [33].
These important features of PEA-15 prompted us to characterize its up-regulation further and to examine the effects of vitamin D3 on processes known to be mediated by PEA-15, such as TRAIL-induced apoptosis. We revealed that (i) the promoter of PEA-15 contains a conserved VDR response element, (ii) vitamin D3 leads to an up-regulation of the mRNA of PEA-15, which precedes the rise in protein level, (iii) vitamin D3 increases the level of phosphorylated PEA-15, possibly via AKT1, (iv) vitamin D3 treatment significantly rescued A549 cells from TRAIL-induced apoptosis and (v) this effect was strongly dependent on the presence of PEA-15, as revealed by RNAi experiments. In summary, this study provides insight into novel targets of vitamin D3 in HNSC.100 human brain cells and defines a novel pathway of vitamin D3 that counteracts apoptosis via up-regulation of PEA-15.
Materials and methods
Cell culture and treatments
The human neuronal stem cell line (HNSC.100) was propagated in DMEM:F-12 (1:1) medium supplemented with 0.5% FCS, 1% N2 (Invitrogen, Karlsruhe, Germany), 1% BSA (Sigma, Taufkirchen, Germant), 1% penicillin/streptomycin (Invitrogen) and human recombinant growth factors EGF and FGF-β (Tebu Biochem, Offenbach, Germany, 20 nM each). For differentiation, mitogens were removed and replaced with CNTF (100 nM) for 2–3 weeks. Differentiated HNSC.100 were treated for 24 hrs with ethanol vehicle (Sigma), or 10−7 M vitamin D3 (Biomol, Hamburg, Germany) and lysates prepared with ice-cold lysis buffer (20 mM MOPS, pH 7.2, 2 mM EGTA, 3.5 mM EDTA, 30 mM sodium fluoride, 60 mM glycerophosphate pH 7.2, 20 mM sodium pyrophosphate, 1 mM sodium orthovanadate, 1 mM phenylmethylsulfonylfluoride, 3 mM benzamidine, 5 μM pepstatin A, 10 μM leupeptin, 1% Triton X-100).
Transfection and siRNA design
To knock-down PEA-15, two siRNA duplexes were designed (21 nt double-stranded RNA containing 19 base pairs and 3’ T- overhanging ends) using the Dharmacon siDesign Center software (UCACUAUGGUGGUUGACUATT and UGCAAGACCUGACCAACAATT, synthesized by Invitrogen). Transfections were performed with Lipofectamine according to the manufacturer’s instructions (Gibco).
Antibody protein arrays
Over 600 antibodies (≥350 pan- and ≥280 phospho-site-specific, specification available upon request) were deposited in adjacent, duplicate spots on the glass slides (Kinexus Bioinformatics proprietary methodology). To ensure the most reliable comparison possible, both samples (control and treatment) were labelled with the same fluorescent dye (unlike DNA, proteins display strong individual differences in their relative affinities for dyes) and incubated on the same microarray (details available at http://www.kinexus.ca). Unbound dye-labelled lysate proteins were washed away and captured proteins quantified (Kinexus KAM-1.1 software). Analysis of the fluorescence signal strength for each target protein was provided in duplicates (Table 3) and includes the (average) percent change from the control sample, the percent range in error and fold-changes.
Table 3.
Selected protein targets for validation by conventional Western blot*
| Protein name | %CFC |
|---|---|
| CDK2 | 101.83 |
| EGFR | 50.89 |
| GSK3a/b | −61.19 |
| GSK3a/b (S21/S9) | −59.81 |
| GSK3a/b (Y279/ Y216) | −43.04 |
| MAPK14 | −18.77 |
| p38a MAPK (T180 + Y182) | −62.98 |
| PEA-15 (PED15) (S116) | 953.61 |
| PI3K p110 delta | 75.96 |
| PKA | 49.52 |
| PKBg (Akt3) | 60.60 |
| PKCa | 59.75 |
In cases where the antibodies were directed against the phosphorylated form of the protein, the site of phosphorylation is given in parentheses after the protein name.
Western blot quantification
For validation, 500 μg of protein lysate derived from HNSC.100 was subjected to Western blot expression analysis. This analysis combines proprietary methodology (Kinexus Bioinformatics Corporation, Vancouver, BC, Canada) with analytical techniques, including SDS-PAGE gel electrophoresis, immunoblotting and enhanced chemoluminescence (ECL) protein visualization. First, proteins were separated by conventional gel electrophoresis based on their molecular weights, followed by detection with highly validated panel of human antibodies (the same as applied on the KAM1.1 chip).
Quantification of the bands was performed with a highly sensitive imaging system with a 16-bit camera in combination with the quantification software Immuno-Reactivity Identification System (IRIS) converting the light signals from the sample into digital data. From this, an intensity profile for the band is generated from summing each pixel’s intensity for that band (only the bands whose clustered pixels were higher than the intensity of the pixels that make up the background of the image were considered for quantification). The raw data (a resulting trace quantity for each band scanned at the maximum scan time) was normalized to the average of all signals detected on the immunoblots of the screen. This was accomplished by summing the trace quantity of all the bands detected (known and unknown) on each immunoblot, finding the average total intensity per screen in any given normalization group, and then using a coefficient or scaling factor to multiply each trace quantity in each sample (this procedure helps to safeguard against inaccuracies in protein determination, protein loading and the inconsistencies as when normalizing the results to common internal references, which often vary significantly between samples). Therefore, the normalization was based on the same principle, but utilizing many proteins as references instead of one internal standard, possibly giving a more conservative estimate of the expression changes occurring. Data are listed as percent change from control (%CFC).
For the Western blots in Figs 4–6, cells were lysed as described earlier. Fifty micrograms of cell extract were resolved on 15% SDS–polyacrylamide and transferred to Hybond-C extra nitrocellulose. Membranes were blocked for 1 hr with 5% non-fat dry milk in TBS containing 0.05% Tween-20 incubated with primary antibodies (directed against: total AKT, pAKT (S473), total PEA-15, pPEA-15 (S116) and β-actin as indicated in the figures) and visualized by chemiluminescence [28].
Figure 4.

Conserved transcription factor binding sites in the promoter of PEA-15 and up-regulation of PEA-15 mRNA and protein. (A) Several transcription factor binding motifs were identified, including those for VDR, NFκB, EGRF, EKLF and SP1. (B) Effect of vitamin D3 on PEA-15 mRNA levels. A549 cells were treated with vitamin D3 (10−7 M), and the mRNA levels were determined by real-time PCR at the times indicated. (C) Verification of induction of total PEA-15 after 12 hrs by Western blot.
Figure 6.
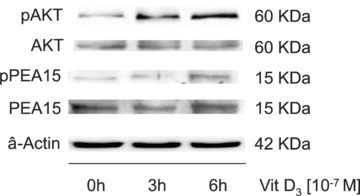
Effect of vitamin D3 on AKT and PEA-15. A549 cells were treated with vitamin D3 and harvested at the times indicated. Western blot analysis was performed to detect the levels of total AKT (AKT), phosphorylated AKT (pAKT), total PEA-15, (PEA15), phosphorylated PEA-15 (pPEA15) and β-actin as loading control.
Real-time PCR
Total RNA was extracted from A549 cells using the TRIZOL reagent protocol (Invitrogen). Quality and quantity of the RNA were determined by measuring the absorbance at 260 and 280 nm, and by 1% agarose gel electrophoresis under denaturing conditions. RNA (1 μg) from each sample was reverse transcribed and one-step RT-PCR was performed by using SuperScript® III First-Strand system (Invitrogen) according to manufacturer’s instructions. Primers for PEA-15 were 5′-GCAGTGCCTGGTTTAGCTTC-3′ (forward), 5′-TACGGGTTAGCTTGGTGTCC-3′ (reverse) and were synthesized commercially (PRIMM, Milan, Italy). Real-time PCR was performed by using iQ™ SYBR® Green Supermix (BIO-RAD, Munich, Germany). Reactions were performed in triplicate and β-Actin used as an internal reference cycling (conditions are available upon request).
Proliferation assays and cell death
Proliferation was evaluated with the CellTiter 96® AQueous One Solution Cell Proliferation Assay (Promega, Madison, WI). A549 (lung carcinoma) cells (2 × 10⁵) were plated in 96-well plates (triplicates), stimulated with ligands and incubated at 37°C (at 5% CO2). Cell death was induced by using SuperKillerTRAIL™ (Alexis Biochemicals, Lausanne, Switzerland) for 24 hrs at 100 ng/ml. Metabolically active cells were detected by adding 20 μl of methyl tetrazolium salt (MTS) to each well. After 2 hrs of incubation, the plates were analysed on a Multilabel Counter (BIO-RAD) according to the manufacturer’s instructions. Apoptosis was measured by FACS (propidium iodide assay). The cells (2 × 10⁵) were washed with PBS and re-suspended in 200 μl buffer containing 0.1% sodium citrate, 0.1% Triton X-100 and 50 μg/ml propidium iodide (Sigma). Following incubation at 4°C for 30 min. in the dark, nuclei were analysed with a Becton Dickinson FACScan flow cytometer. Cellular debris was excluded from analyses by raising the forward scatter threshold, and the DNA content of the nuclei registered on a logarithmic scale.
Gene ontology sorting
The Gene Ontology data annotation (version 161) http://www.geneontology.org; http://www.ebi.ac.uk/GOA/) was used to classify and characterize the genes that resulted from the antibody microarray analysis. Regulated genes were imported into BiblioSphere software (Version 7.13; Genomatix, Munich, Germany) and mapped to Gene Ontology (GO) trees in order to identify their biological function. In addition, the number of genes discovered as regulated by vitamin D3 in a certain class was related to the total number of genes to which antibodies were spotted on the chip.
Computational promoter analysis
To identify conserved transcription factor binding sites for PEA-15, promoter sequences from three different species (Homo sapiens, Mus musculus, Rattus norvegicus) were first extracted by use of ElDorado program in the Genomatix software suite. The proximal promoter regions used were generally defined as about 500 nt upstream and 100 nt downstream of the transcriptional start side (TSS). Promoter sequences of the three different species were then compared by alignment with the help of DiAlign to evaluate overall promoter similarity. To find transcription factor–binding sites in the input sequences arranged by defined order, orientation and certain distance range between adjacent binding sites, the FrameWorker program (Genomatix) has been applied. For the promoter analysis position weight, matrices according to Matrix Family Library Version 7.0 (October 2007) were used.
Results
Proteomic search indicates numerous targets of vitamin D3 in brain-derived cells
To further elucidate the actions of vitamin D3 in human brain–derived cells, we started out by using antibody microarrays. They have the advantage of detecting the functional entity (protein) directly and also the added benefit of detecting protein isoforms, including in some cases phosphorylation isoforms. The antibody array used in our study (Kinexus) features more than 600 antibodies (≥350 pan-specific and ≥250 phospho-site-specific) deposited in duplicate spots.
As a model, we used the human neuronal stem cell line HNSC.100 [24]. Because of the sTable expression of v-myc, it can be perpetuated in the presence of the mitogens FGF-2 and EGF. Upon removal of the mitogens and in the presence of CNTF, cells undergo spontaneous morphological differentiation [24, 25]. After 2 weeks of differentiation, cultures were exposed to vitamin D3 for 24 hrs (10−7 M, Fig. 1A). Lysates of treated and untreated cells were then applied to the antibody array (Fig. 1B, complete list of antibody target proteins are referenced in supplementary Table 1).
Figure 1.

Procedure of the proteomic search for vitamin D3-regulated targets. HNSC.100 brain stem cells were cultivated and differentiated and treated with vitamin D3 for 24 hrs, and proteins were extracted from treated and untreated cells. After labelling proteins were bound to the antibody chips, which were then processed to yield candidate targets for further validation and characterization.
More than 180 antibodies indicated altered expression and/or phosphorylation after vitamin D3 treatment, as compared with the vehicle-treated control (Table 1). Using Gene Ontology (GO, via BiblioSphere), we analysed regulated targets according to their functional classes and calculated, which percentage of proteins represented on the chip for any given category was regulated by the treatment. As summarized in Table 2, a high percentage of regulated proteins was found in the categories neuron development, neurogenesis, neurological processes and organelle organization and biogenesis (55.5%, 58.3%, 75.0% and 51.1% of the targets corresponding to the respective category). Like in the case of RNA microarrays, it is important to test some of these screening results by independent methods. Therefore, several candidates were selected (Table 3) according to their percentage change from the control (%CFC with respective error range) for validation by conventional Western blot.
Table 1.
List of vitamin D3-regulated proteins*
| Protein name | %CFC | Protein name | %CFC | Protein name | %CFC | Protein name | %CFC |
|---|---|---|---|---|---|---|---|
| Abl (Y412) | 48.39 | JIK [TAO3] | −53.38 | PKBa (Akt1) (S473) | −56.65 | Rb (T821) | −47.07 |
| ACK1[ACK] | 49.40 | JNK | −60.27 | PKBa (Akt1) (S473) | 1.37 | Rb (T826) | −48.51 |
| AIF | 58.18 | Jun (S63) | −64.43 | PKBa (Akt1) (S473) | 47.91 | Rb (S780) | −61.39 |
| Alk | 59.02 | MAPKAPK2 (T222) | −48.57 | PKBa (Akt1) (T308) | 44.07 | Ret (S696) | −50.89 |
| ANKRD3 | 52.82 | MEK1[MAP2K1] (T385) | 160.80 | PKBg (Akt3) | 60.60 | RIPK | −54.19 |
| Arrestin b1 (S412) | 49.79 | MEK7[MAP2K7] | 39.93 | PKBg (Akt3) | 104.38 | Rb (T356) | −39.08 |
| ASK1[MAP3K5] | 42.07 | MEKK1[MAP3K1] | 42.01 | PKCa | 59.75 | ROKa[ROCK2] | −52.16 |
| Bad (S99) | 76.14 | MKP1 | −37.80 | PKCa/b2 (T638/T641) | −54.75 | ROR2 | −41.76 |
| Bak | 69.32 | Mnk1 (T209 + T214) | −52.98 | PKCb2 | 74.40 | RSK2 | −43.86 |
| Bcl-xS/L | 62.51 | Mnk2 | −65.50 | PKCd (S664) | 70.96 | RSK1/2 (S380/S386) | 78.34 |
| Bid | 68.12 | Mos | −44.47 | PKCd (Y313) | 87.09 | RSK1/2 (S221/S227) | −59.42 |
| Btk | 115.73 | MRLC2 (S18) | −49.26 | PKCe (S729) | 111.75 | RSK1/2 (S363/S369) | −41.89 |
| CAS | 69.55 | Msk1 (S376) | −69.50 | PKCe (S729) | 55.77 | RSK1/2 (S380/S386) | −44.83 |
| Catenin b | 55.47 | MST1 | −57.57 | PKCg | 87.89 | S6Ka [p70 S6Ka] | −42.53 |
| CDK2 | 101.83 | MST1 | −46.41 | PKCg (T514) | 76.71 | SIRPa1 | −42.01 |
| CDK1/2 (Y15) | 104.61 | MYPT1 (T696) | −48.44 | PKCg (T674) | 79.58 | STAT1 (S727) | −53.87 |
| CDK10 | 92.90 | Nek2 | −53.10 | PKCq (S676) | 68.89 | STAT1 (Y701) | −51.38 |
| Chk1 | 68.90 | Nek2 | −62.32 | PKCq (S695) | 116.97 | STAT3 (S727) | −45.76 |
| Crystallin aB (S19) | 49.62 | Nek2 | −50.27 | PKD (PKCm) | 52.85 | STI1 | 41.78 |
| Crystallin aB (S45) | 60.01 | Nek7 | −49.49 | PKD (PKCm) (S910) | −63.08 | STK33 | 85.79 |
| DNAPK | 56.89 | NFkappaB p50 | −44.64 | PKM2 | 62.55 | Syk | 102.15 |
| Dok2 (Y142) | 96.20 | NFkB p65 (Rel A) (S276) | −47.40 | PKN | 45.04 | Synapsin 1 (S9) | 79.19 |
| EGFR | 50.89 | Nip1 | −46.25 | Plk1 | 72.54 | TAK1 | 25.86 |
| EGFR | 53.24 | NME6 | −48.11 | PP1/Ca (T320) | 56.56 | Tau (S738) | 59.37 |
| EGFR (Y1068) | 53.23 | NME7 | −53.78 | PP2Cab | 45.78 | Tau (S518) | 25.20 |
| eIF2a (S51) | 66.64 | NR1 (S896) | −68.80 | PP5C | 94.37 | Tau (S530) | 58.44 |
| eIF2Be (S540) | 61.39 | p16 INK4 | −50.85 | PP6C | 49.63 | Tau (S578) | 93.33 |
| Erk4 | −48.65 | p18 INK4c | −45.99 | PRAS40 (T246) | 41.71 | Tau (S712) | −50.11 |
| Erk6[p38g] | 54.02 | p35 | −41.17 | PRK1/2[PKN1/2] (T774) | −53.59 | Tau (T547) | 64.83 |
| FAK (Y576) | 54.89 | p38a MAPK | −48.49 | PRKWNK4 | −53.20 | TBK1 | 127.12 |
| FAK (Y577) | −56.74 | p38a MAPK (T180 + Y182) | −62.98 | Progesterone Receptor (S294) | −50.71 | Tlk1 | 130.92 |
| GCK | 52.03 | p53 (S392) | −45.00 | PTEN | −51.11 | TRADD | 95.57 |
| GFAP (S8) | −49.22 | PAK1/2/3 (S144/S141/S154) | −52.47 | PTEN (S370) | −41.89 | TrkA | 81.99 |
| GRK3[BARK2] | −35.17 | PARP1 | −48.38 | PTEN (S380 + S382 + S385) | −57.24 | TTK | 105.00 |
| GSK3a/b (S21/S9) | −59.81 | Pax2 (S394) | −41.20 | PTP1B | −58.39 | Tyk2 | 78.70 |
| GSK3a/b (Y279/ Y216) | −43.04 | Paxillin 1 (Y118) | −61.03 | PTP1C | −55.86 | TH (S19) | 122.06 |
| hHR23B | −52.41 | Paxillin 1 (Y118) | 56.45 | PTP1D | −57.37 | TH (S71) | 73.38 |
| Histone H2A.X (S139) | −75.10 | Paxillin 1 (Y31) | −47.29 | PKR | −43.59 | VEGFR2[KDR] (Y1054) | 62.03 |
| Hpk1 | 58.84 | PCTK1[PCTAIRE1] | −44.85 | PTP-PEST | −98.46 | Vimentin (S33) | 87.10 |
| Hsp27 (S78) | 177.00 | PDK1 (S244) | −41.46 | Pyk2 (Y579) | −43.64 | Vrk1 | 117.51 |
| Hsp60 | 133.04 | PEA-15 (PED15) (S116) | 953.61 | Rad17 (S645) | −53.78 | Wee1 | 44.52 |
| IKKa/b (S180) | −50.72 | PI3K p110 delta | 75.96 | Raf1 | −51.29 | XIAP | 55.94 |
| IKKb | −56.26 | PKA | 49.52 | Rb (S612) | −50.50 | ZAP70 (Y315+Y319) | 48.60 |
| IRAK4 | −50.42 | PKA Cb (S338) | 55.65 | Rb (S807) | −58.72 | ZAP70 (Y319) | 51.94 |
| JAK2 | −62.42 | PKBa (Akt1) (T308) | 75.72 | Rb (S807 + S811) | −67.14 | ZIPK | 44.78 |
Listed are the results of antibody microarray analysis (duplicate spots, complete list). In cases where the antibodies were directed against the phosphorylated form of the protein, the site of phosphorylation is given in parentheses after the protein name. %CFC, percent change from control.
Table 2.
Gene Ontology data sorting*
| Gene ontology classes of vitamin D3 targets | Percentage of regulated proteins per GO class |
|---|---|
| Cell cycle | 36.6 |
| Cell differentiation | 44.2 |
| Cellular development | 42.8 |
| Cellular communication | 38.8 |
| General regulation of biological processes | 38.6 |
| Intracellular signalling cascade | 40.1 |
| MAPKKK cascade | 37.9 |
| NS development | 41.9 |
| Phosphorylation | 40.2 |
| Primary metabolic processes | 38.5 |
| Programmed cell death | 38.7 |
| Protein modification | 42.0 |
| Regulation of programmed cell death | 32.9 |
| Response to stimulus | 42.5 |
| Signal transduction | 38.0 |
| Intracellular transport | 61.9 |
| Neurogenesis | 58.3 |
| Neurological processes | 75.0 |
| Neuron development | 55.5 |
| Organelle organization and biogenesis | 51.1 |
Results of the antibody array were sorted using Gene Ontology (http://www.geneontology.org, http://www.ebi.ac.uk/GOA/). The percentage of regulated proteins was calculated as the proportion of affected proteins from the total number of proteins for the given category.
Western blot validation
Independent samples of differentiated HNSC.100 cells were lysed in SDS-PAGE sample buffer as described (Materials and Methods) and resolved on a SDS-PAGE gel followed by electrophoretic transfer to a nitrocellulose membrane. Membranes were probed with antibodies identical to those used on the protein array (Kinexus), visualized with the ECL detection system and quantified by using IRIS identification software (Fig. 2). For approximately 40% of examined targets, changes measured by the antibody microarray could be reproduced by Western blot, such as CDK1/2, EGFR, PKA, Akt3 and PKCα. GSK3α/β yielded partially conflicting results (down-regulated −59.8% and −43.04% on the array and −28% and −10% on Western blot), as well as PI3K/p100 delta (up-regulated 75.9% on the array and down-regulated 17% in the Western blot). Notably, the phosphorylated form of PEA-15 remained the most strongly vitamin D3-regulated protein after the Western blot validation (Figs 2 and 3). This confirms the responsiveness of PEA-15 to vitamin D3, although the two methods indicated different degrees of up-regulation (953% antibody array versus 268% Western blot up-regulation).
Figure 2.

Western blot testing of candidate targets of vitamin D3. Differentiated HNSC.100 cells were treated with vitamin D3 or vehicle for 24 hrs, and Western blots were performed with cell lysates.
Figure 3.

Quantification of the changes in protein level induced by vitamin D3 for the selected proteins. Quantification of the bands shown in Fig. 2 was performed with an imaging system in combination with the quantification software IRIS (Immuno-Reactivity Identification System, see Materials and Methods).
PEA-15 promoter analysis and mRNA induction by vitamin D3
Given the strong response of PEA-15 to vitamin D3 indicated by two independent samples/methods and its prominent expression in the CNS (particularly abundant in astrocytes [31]), we focussed our further experiments on this candidate. First, we searched by bioinformatics tools for VDR-binding sites in the PEA-15 promoter of the human, mouse and rat genomes. The sequence upstream of the transcription site contains several transcription factor binding motifs, including those for NFκB, EGRF, EKLF and SP1 (Fig. 4A). One of these sites is conserved between human, mouse and rat promoter, thus strongly indicating a functional vitamin D3– dependency of the PEA-15 gene promoter.
To experimentally test the up-regulation of the PEA-15 gene promoter by vitamin D3, we treated cells with vitamin D3 and measured the mRNA of PEA-15 by real-time PCR. We observed indeed a rise of the PEA-15 mRNA already after 3 and 6 hrs (Fig. 4B). Using an antibody that recognizes PEA-15 irrespective of its phosphorylation status we also detected an up-regulation of the total amount of PEA protein after 12 hrs (Fig. 4C).
Vitamin D3 regulates PEA-15 function
We next investigated whether the effect of vitamin D3 on PEA-15 expression changes cellular processes that depend on the function of PEA-15. Numerous studies suggest the involvement of PEA-15 in a broad range of anti-apoptotic processes in cultured cells [32–35]. TRAIL (tumour necrosis factor apoptosis-inducing ligand) is an efficient inducer of apoptosis and in TRAIL-sensitive cells; transfection of PEA-15 cDNA resulted in cell resistance, whereas inhibition of PEA-15 expression changed the TRAIL-resistant phenotype to sensitive [29, 33]. Given that normal astrocytes are generally TRAIL-resistant [33], we chose the TRAIL-sensitive cell line A549 to examine VDR and PEA-15 expression in the presence and absence of vitamin D3.
First, we verified by Western blot that A549 cells express VDR, indeed (data not shown). To test whether vitamin D3 influences TRAIL-induced apoptosis, we pre-treated A549 cells with vitamin D3 (10−7 M, as in the previous experiments) for 12 hrs before apoptosis was induced with TRAIL (100 ng/ml for the next 24 hrs). Cell nuclei were visualized with propidium iodide and subjected to FACS analysis to monitor late-stage apoptosis, and MTS proliferation assays were performed to measure cell viability. Treatment with vitamin D3 alone did not have a significant effect on apoptosis, as compared with vehicle-treated cells (Fig. 5A, right panel, grey bar), whereas treatment with TRAIL resulted in approximately 50% apoptotic cells, as expected (Fig. 5A, right panel, black bar). Notably, cells pre-treated with vitamin D3 prior to TRAIL administration exhibited markedly decreased levels of TRAIL-induced apoptosis (Fig. 5A, right panel, dark grey bar). MTS assays paralleled the observed changes, indicating that a decrease in cell proliferation/viability induced by TRAIL could be significantly reverted by pre-treating cells with vitamin D3 (Fig. 5A, left panel).
Figure 5.

Effect of vitamin D3 on TRAIL-induced apoptosis and cell survival in A549 cells. (A) Cells were treated with vehicle, vitamin D3 and TRAIL in the combinations indicated. Metabolic activity (as a measure of cell viability and apoptosis [FACS analysis] were determined. (B) Same treatment as in (A), but in the presence of RNAi directed against PEA-15. Data represent mean values + S.E.M. of three independent experiments performed in triplicates each. Panel below (B), verification of the efficacy of the siRNA directed against PEA-15 by Western blot using an antibody detecting total PEA-15.
To answer the crucial question of whether the effect of vitamin D3 is dependent on PEA-15, we silenced the PEA-15 gene with siPEA RNA, prior to treating cells with vitamin D3 and TRAIL (reduced PEA-15 expression level are documented below the graphs of Fig. 5B). Interestingly, the attenuating effect of vitamin D3 on the actions of TRAIL in apoptosis and cell viability was completely abolished in PEA-15 silenced cells (Fig. 5B, dark grey bars). These data suggest that PEA-15 is mediating the effects of vitamin D3 in cell survival.
Vitamin D3 increases phosphorylation of AKT1 and PEA-15
The strong up-regulation observed using an antibody directed against PEA-15 phosphorylated at serine 116 raised the question of whether the increase in the level of total protein is achieved in part by increasing protein stability. It has been reported that PEA-15 is phosphorylated by protein kinase Bα/AKT1, which leads to stabilization of the protein [36]. Therefore, we used Western blot analysis to measure the levels of phosphorylated AKT1, total AKT1, phosphorylated PEA-15 and total PEA-15 after treatment of the cells with vitamin D3. Phosphorylation of AKT1 is a measure of the activity of this kinase [37]. We observed an activation of AKT1 3 and 6 hrs after addition of vitamin D3, whereas the level of total AKT1 protein was unchanged (Fig. 6). Interestingly, 6 hrs after addition of vitamin D3, we found an increase in phosphorylation of PEA-15 but no change in the level of total PEA-15 yet (Fig. 6), which rises only after 12 hrs (Fig. 4). These data support the view that vitamin D3 uses two mechanisms to increase the function of PEA-15, stimulation of gene transcription and stabilization of the protein through phosphorylation, possibly via activation of AKT1.
Discussion
In this study we searched for vitamin D3-regulated targets in the proteome of human brain–derived cells. Several expression changes indicated by the antibody array paralleled the ones described previously by other authors. Among them are up-regulation of EGFR [38–40], down-regulation of activated p38 MAPK [41], up-regulation of tyrosine hydroxylase [42] and down-regulation of GSK3β mRNA in differentiated HIB5 rat hippocampal cells (own unpublished observations). Although this congruence with other published data in general attests to the reliability of the array, we also observed inconsistencies for some of the proteins examined on the array, for example, AKT1 or paxillin 1. We do not know whether the reason for this is accidental variation or due to unknown differences in the spotted antibodies, which are supposed to recognize the same modified protein. In any case, this reinforces the notion that results of screening methods such as mRNA or protein microarrays should be validated by independent methods.
Up-regulation of PEA-15 was the most prominent feature on the antibody array. We investigated this up-regulation further and conclude from our experiments with different cell lines that vitamin D3 leads to an increase in promoter activity of PEA-15 already after 3–6 hrs (Fig. 4B), and with a little delay to an increase in protein phosphorylation after 6 hrs (Fig. 6), most likely via activation of AKT1, which is known to phosphorylate PEA-15 [36]. The increase in mRNA and the protein stabilization through phosphorylation in combination lead to an increase in total PEA-15 protein level after 12 hrs (Fig. 4B). On the microarray, five antibodies were directed against activated (i.e. phosphorylated) AKT1. Most of them actually indicated the increased activation of AKT1, but one of them detected less phosphorylated AKT1 (see paragraph above).
A bioinformatics search revealed a conserved VDR-binding site in the promoter of PEA-15, in line with a direct regulation of the promoter activity by VDR. In addition, we identified a conserved Sp1 binding site. Considering the finding of a functional VDR/SP1 complex [43], this SP1 site could contribute further to the VDR dependency of PEA-15. PEA-15 is also on the list of about 50 differentially expressed genes in the mouse brain revealed by two-dimensional gel electrophoresis in a model of developmental vitamin D deficiency [44]. Although this finding was not discussed or followed-up, it is in line with the vitamin D dependency of PEA-15 outlined in our study.
Significant knowledge about the function of PEA-15 has already been accumulated, such as its anti-apoptotic and anti-proliferation features [32, 34, 45, 46]. The interaction of PEA-15 with DED containing molecules such as FADD and caspase-8 in the death inducing signalling complex is considered to play an important role in the inhibition of cell death–induced activation of TNFR1 [45]. The mechanism of the anti-proliferative action of PEA-15 involves binding to the extracellular signal receptor-activated kinases (ERK1/2) and their export out of the nucleus [47]. This shift of ERK activity from nuclear to cytosolic targets then results in attenuated cell proliferation [46]. Our finding of increased AKT1 activity after vitamin D3 exposure not only provides a potential mechanism for activation of PEA-15 but also adds another pathway through which vitamin D3 exerts anti-apoptotic effects. AKT1 has been established as a central node promoting cell survival downstream of growth factors, oncogenes and cell stress [48].
Important for understanding the function of PEA-15 in the brain was its immunohistochemical mapping in the mouse brain [31]. Although early in vitro studies suggested its expression mainly in astrocytes [26], immunostaining revealed that PEA-15 was expressed in defined astrocyte sub-populations as well as neurons throughout the brain [31]. Interestingly, it is also expressed in areas known for neurogenesis in the murine embryonic and adult brain [31, 49, 50]. Therefore, vitamin D3 impact on PEA-15 expression and function described in this study may be important in this context to contain further proliferation and allow differentiation.
Our discovery that PEA-15 is strongly responsive to vitamin D3 potentially links vitamin D3 to any of the actions of PEA-15. Although extensive work needs to be done to test the degree of overlapping activities, we already showed in this work that vitamin D3 significantly affected apoptosis and cell survival in A549 cells in a PEA-15-dependent manner. The differentiation-inducing and anti-proliferative effects of vitamin D3 in various tissues are well described [51–54]. Therefore, we propose that the pathway revealed in this study contributes to these effects and constitutes the molecular basis for these actions of vitamin D3. This probably also applies to the positive effects of vitamin D3 in cancer [55, 56], most recently highlighted by a widely noticed study outlining positive effects of sun exposure via improving the vitamin D3 status [57].
Since VDR activity was reported to be induced by stress [58], it is tempting to speculate that up-regulation of PEA-15 by VDR plays a role in the stress response in the brain. It could, for example, contribute to the suppression of neurogenesis by stress [59] as well as counteracting the damage stress is executing on some brain cells [60], in particular because PEA-15 is found in brain areas sensitive to stress [61]. In this respect, it is interesting to note that in the ventral tegmental area AKT1, another target of vitamin D3 we could confirm in this study, has very recently been shown to be involved in the regulation of vulnerability to social defeat and of depression-related behaviours in rats [62].
With respect to brain function in general, numerous studies indicated the importance of regulating apoptosis for normal brain development and function [63, 64]. Thus, the positive role of vitamin D3 reported for brain development [22, 65] and mental health [16, 20] may operate at least in part through its effect on apoptosis via inducing PEA-15.
Acknowledgments
This study was supported by a Young Investigator Award of the National Alliance for Research on Schizophrenia and Depression (NARSAD) to D.O. and by funds from Associazione Italiana Ricerca sul Cancro, AIRC and MIUR-FIRB (RBIN04J4J7) to G.C. We thank A. Martinez-Serrano for kindly providing HSCN.100 cells.
Supporting Information
Table S1. Antibody array ? full list.
Please note: Wiley-Blackwell are not responsible for the content or functionality of any supporting materials supplied by the authors. Any queries (other than missing material) should be directed to the corresponding author for the article.
Supporting info item
Supporting info item
References
- 1.Jones G, Strugnell SA, DeLuca HF. Current understanding of the molecular actions of vitamin D. Physiol Rev. 1998;78:1193–231. doi: 10.1152/physrev.1998.78.4.1193. [DOI] [PubMed] [Google Scholar]
- 2.Holick MF. Evolution and function of vitamin D. Recent Results Cancer Res. 2003;164:3–28. doi: 10.1007/978-3-642-55580-0_1. [DOI] [PubMed] [Google Scholar]
- 3.Carlberg C. Current understanding of the function of the nuclear vitamin D receptor in response to its natural and synthetic ligands. Recent Results Cancer Res. 2003;164:29–42. doi: 10.1007/978-3-642-55580-0_2. [DOI] [PubMed] [Google Scholar]
- 4.Norman AW, Okamura WH, Bishop JE, et al. Update on biological actions of 1alpha,25(OH)2-vitamin D3 (rapid effects) and 24R,25(OH)2-vitamin D3. Mol Cell Endocrinol. 2002;197:1–13. doi: 10.1016/s0303-7207(02)00273-3. [DOI] [PubMed] [Google Scholar]
- 5.McDonnell DP, Mangelsdorf DJ, Pike JW, et al. Molecular cloning of complementary DNA encoding the avian receptor for vitamin D. Science. 1987;235:1214–7. doi: 10.1126/science.3029866. [DOI] [PubMed] [Google Scholar]
- 6.Palmer HG, Gonzalez-Sancho JM, Espada J, et al. Vitamin D(3) promotes the differentiation of colon carcinoma cells by the induction of E-cadherin and the inhibition of beta-catenin signaling. J Cell Biol. 2001;154:369–87. doi: 10.1083/jcb.200102028. [DOI] [PMC free article] [PubMed] [Google Scholar]
- 7.Liu M, Lee MH, Cohen M, et al. Transcriptional activation of the Cdk inhibitor p21 by vitamin D3 leads to the induced differentiation of the myelomonocytic cell line U937. Genes Dev. 1996;10:142–53. doi: 10.1101/gad.10.2.142. [DOI] [PubMed] [Google Scholar]
- 8.Hershberger PA, Modzelewski RA, Shurin ZR, et al. 1,25-Dihydroxycholecalciferol (1,25-D3) inhibits the growth of squamous cell carcinoma and down-modulates p21 (Waf1/Cip1) in vitro and in vivo. Cancer Res. 1999;59:2644–9. [PubMed] [Google Scholar]
- 9.Yang L, Yang J, Venkateswarlu S, et al. Autocrine TGFbeta signaling mediates vitamin D3 analog-induced growth inhibition in breast cells. J Cell Physiol. 2001;188:383–93. doi: 10.1002/jcp.1125. [DOI] [PubMed] [Google Scholar]
- 10.Mathiasen IS, Sergeev IN, Bastholm L, et al. Calcium and calpain as key mediators of apoptosis-like death induced by vitamin D compounds in breast cancer cells. J Biol Chem. 2002;277:30738–45. doi: 10.1074/jbc.M201558200. [DOI] [PubMed] [Google Scholar]
- 11.Stumpf WE, Sar M, Clark SA, et al. Brain target sites for 1,25-dihydroxyvitamin D3. Science. 1982;215:1403–5. doi: 10.1126/science.6977846. [DOI] [PubMed] [Google Scholar]
- 12.Stumpf WE, Privette TH. Light, vitamin D and psychiatry. Role of 1,25 dihydroxyvitamin D3 (soltriol) in etiology and therapy of seasonal affective disorder and other mental processes. Psychopharmacology. 1989;97:285–94. doi: 10.1007/BF00439440. [DOI] [PubMed] [Google Scholar]
- 13.Eyles D, Brown J, Mackay-Sim A, et al. Vitamin D3 and brain development. Neuroscience. 2003;118:641–53. doi: 10.1016/s0306-4522(03)00040-x. [DOI] [PubMed] [Google Scholar]
- 14.Becker A, Eyles DW, McGrath JJ, et al. Transient prenatal vitamin D deficiency is associated with subtle alterations in learning and memory functions in adult rats. Behav Brain Res. 2005;161:306–12. doi: 10.1016/j.bbr.2005.02.015. [DOI] [PubMed] [Google Scholar]
- 15.Moore M, Piazza A, Nolan Y, et al. Treatment with dexamethasone and vitamin D3 attenuates neuroinflammatory age-related changes in rat hippocampus. Synapse. 2007;61:851–61. doi: 10.1002/syn.20433. [DOI] [PubMed] [Google Scholar]
- 16.Wilkins CH, Sheline YI, Roe CM, et al. Vitamin D deficiency is associated with low mood and worse cognitive performance in older adults. Am J Geriatr Psychiatry. 2006;14:1032–40. doi: 10.1097/01.JGP.0000240986.74642.7c. [DOI] [PubMed] [Google Scholar]
- 17.McGrath J, Eyles D, Mowry B, et al. Low maternal vitamin D as a risk factor for schizophrenia: a pilot study using banked sera. Schizophr Res. 2003;63:73–8. doi: 10.1016/s0920-9964(02)00435-8. [DOI] [PubMed] [Google Scholar]
- 18.McGrath JJ. Myths and plain truths about schizophrenia epidemiology – the NAPE lecture 2004. Acta Psychiatr Scand. 2005;111:4–11. doi: 10.1111/j.1600-0447.2004.00467.x. [DOI] [PubMed] [Google Scholar]
- 19.Raeder MB, Steen VM, Vollset SE, et al. Associations between cod liver oil use and symptoms of depression: the Hordaland Health Study. J Affect Disord. 2007;101:245–9. doi: 10.1016/j.jad.2006.11.006. [DOI] [PubMed] [Google Scholar]
- 20.Kuningas M, Mooijaart SP, Jolles J, et al. VDR gene variants associate with cognitive function and depressive symptoms in old age. Neurobiol Aging. 2009;30:466–73. doi: 10.1016/j.neurobiolaging.2007.07.001. [DOI] [PubMed] [Google Scholar]
- 22.Féron F, Burne TH, Brown J, et al. Developmental Vitamin D3 deficiency alters the adult rat brain. Brain Res Bull. 2005;65:141–8. doi: 10.1016/j.brainresbull.2004.12.007. [DOI] [PubMed] [Google Scholar]
- 23.Garcion E, Wion-Barbot N, Montero-Menei CN, et al. New clues about vitamin D functions in the nervous system. Trends Endocrinol Metab. 2002;13:100–5. doi: 10.1016/s1043-2760(01)00547-1. [DOI] [PubMed] [Google Scholar]
- 24.Villa A, Snyder EY, Vescovi A, et al. Establishment and properties of a growth factor-dependent, perpetual neural stem cell line from the human CNS. Exp Neurol. 2000;161:67–84. doi: 10.1006/exnr.1999.7237. [DOI] [PubMed] [Google Scholar]
- 25.Rubio FJ, Bueno C, Villa A, et al. Genetically perpetuated human neural stem cells engraft and differentiate into the adult mammalian brain. Mol Cell Neurosci. 2000;16:1–13. doi: 10.1006/mcne.2000.0854. [DOI] [PubMed] [Google Scholar]
- 26.Danziger N, Yokoyama M, Jay T, et al. Cellular expression, developmental regulation, and phylogenic conservation of PEA-15, the astrocytic major phosphoprotein and protein kinase C substrate. J Neurochem. 1995;64:1016–25. doi: 10.1046/j.1471-4159.1995.64031016.x. [DOI] [PubMed] [Google Scholar]
- 27.Formstecher E, Ramos JW, Fauquet M, et al. PEA-15 mediates cytoplasmic sequestration of ERK MAP kinase. Dev Cell. 2001;1:239–50. doi: 10.1016/s1534-5807(01)00035-1. [DOI] [PubMed] [Google Scholar]
- 28.Zanca C, Garofalo M, Quintavalle C, et al. PED is overexpressed and mediates TRAIL resistance in human non-small cell lung cancer. J Cell Mol Med. 2008;12:2416–26. doi: 10.1111/j.1582-4934.2008.00283.x. [DOI] [PMC free article] [PubMed] [Google Scholar]
- 29.Garofalo M, Romano G, Quintavalle C, et al. Selective inhibition of PED protein expression sensitizes B-cell chronic lymphocytic leukaemia cells to TRAIL-induced apoptosis. Int J Cancer. 2007;120:1215–22. doi: 10.1002/ijc.22495. [DOI] [PubMed] [Google Scholar]
- 30.Stassi G, Garofalo M, Zerilli M, et al. PED mediates AKT-dependent chemoresistance in human breast cancer cells. Cancer Res. 2005;65:6668–75. doi: 10.1158/0008-5472.CAN-04-4009. [DOI] [PubMed] [Google Scholar]
- 31.Sharif A, Renault F, Beuvon F, et al. The expression of PEA-15 (phosphoprotein enriched in astrocytes of 15 kDa) defines subpopulations of astrocytes and neurons throughout the adult mouse brain. Neuroscience. 2004;126:263–75. doi: 10.1016/j.neuroscience.2004.02.039. [DOI] [PubMed] [Google Scholar]
- 32.Kitsberg D, Formstecher E, Fauquet M, et al. Knock-out of the neural death effector domain protein PEA-15 demonstrates that its expression protects astrocytes from TNFalpha-induced apoptosis. J Neurosci. 1999;19:8244–51. doi: 10.1523/JNEUROSCI.19-19-08244.1999. [DOI] [PMC free article] [PubMed] [Google Scholar]
- 33.Hao C, Beguinot F, Condorelli G, et al. Induction and intracellular regulation of tumor necrosis factor-related apoptosis-inducing ligand (TRAIL) mediated apoptosis in human malignant glioma cells. Cancer Res. 2001;61:1162–70. [PubMed] [Google Scholar]
- 34.Condorelli G, Vigliotta G, Cafieri A, et al. PED/PEA-15: an anti-apoptotic molecule that regulates FAS/TNFR1-induced apoptosis. Oncogene. 1999;18:4409–15. doi: 10.1038/sj.onc.1202831. [DOI] [PubMed] [Google Scholar]
- 35.Song JH, Bellail A, Tse MC, et al. Human astrocytes are resistant to Fas ligand and tumor necrosis factor-related apoptosis-inducing ligand-induced apoptosis. J Neurosci. 2006;26:3299–308. doi: 10.1523/JNEUROSCI.5572-05.2006. [DOI] [PMC free article] [PubMed] [Google Scholar]
- 36.Trencia A, Perfetti A, Cassese A, et al. Protein kinase B/Akt binds and phosphorylates PED/PEA-15, stabilizing its antiapoptotic action. Mol Cell Biol. 2003;23:4511–21. doi: 10.1128/MCB.23.13.4511-4521.2003. [DOI] [PMC free article] [PubMed] [Google Scholar]
- 37.Manning BD, Cantley LC. AKT/PKB signaling: navigating downstream. Cell. 2007;129:1261–74. doi: 10.1016/j.cell.2007.06.009. [DOI] [PMC free article] [PubMed] [Google Scholar]
- 38.McGaffin KR, Chrysogelos SA. Identification and characterization of a response element in the EGFR promoter that mediates transcriptional repression by 1,25-dihydroxyvitamin D3 in breast cancer cells. J Mol Endocrinol. 2005;35:117–33. doi: 10.1677/jme.1.01813. [DOI] [PubMed] [Google Scholar]
- 39.Garach-Jehoshua O, Ravid A, Liberman UA, et al. 1,25-Dihydroxyvitamin D3 increases the growth-promoting activity of autocrine epidermal growth factor receptor ligands in keratinocytes. Endocrinology. 1999;140:713–21. doi: 10.1210/endo.140.2.6520. [DOI] [PubMed] [Google Scholar]
- 40.McGaffin KR, Acktinson LE, Chrysogelos SA. Growth and EGFR regulation in breast cancer cells by vitamin D and retinoid compounds. Breast Cancer Res Treat. 2004;86:55–73. doi: 10.1023/B:BREA.0000032923.66250.92. [DOI] [PubMed] [Google Scholar]
- 41.Nonn L, Peng L, Feldman D, et al. Inhibition of p38 by vitamin D reduces interleukin-6 production in normal prostate cells via mitogen-activated protein kinase phosphatase 5: implications for prostate cancer prevention by vitamin D. Cancer Res. 2006;66:4516–24. doi: 10.1158/0008-5472.CAN-05-3796. [DOI] [PubMed] [Google Scholar]
- 42.Puchacz E, Stumpf WE, Stachowiak EK, et al. Vitamin D increases expression of the tyrosine hydroxylase gene in adrenal medullary cells. Brain Res Mol Brain Res. 1996;36:193–6. doi: 10.1016/0169-328x(95)00314-i. [DOI] [PubMed] [Google Scholar]
- 43.Cheng HT, Chen JY, Huang YC, et al. Functional role of VDR in the activation of p27Kip1 by the VDR/Sp1 complex. J Cell Biochem. 2006;98:1450–6. doi: 10.1002/jcb.20780. [DOI] [PubMed] [Google Scholar]
- 44.Almeras L, Eyles D, Benech P, et al. Developmental vitamin D deficiency alters brain protein expression in the adult rat: implications for neuropsychiatric disorders. Proteomics. 2007;7:769–80. doi: 10.1002/pmic.200600392. [DOI] [PubMed] [Google Scholar]
- 45.Xiao C, Yang BF, Asadi N, et al. Tumor necrosis factor-related apoptosis-inducing ligand-induced death-inducing signaling complex and its modulation by c-FLIP and PED/PEA-15 in glioma cells. J Biol Chem. 2002;277:25020–5. doi: 10.1074/jbc.M202946200. [DOI] [PubMed] [Google Scholar]
- 46.Formstecher E, Ramos JW, Fauquet M, et al. PEA-15 mediates cytoplasmic sequestration of ERK MAP kinase. Dev Cell. 2001;1:239–50. doi: 10.1016/s1534-5807(01)00035-1. [DOI] [PubMed] [Google Scholar]
- 47.Ramos JW, Hughes PE, Renshaw MW, et al. Death effector domain protein PEA-15 potentiates Ras activation of extracellular signal receptor-activated kinase by an adhesion-independent mechanism. Mol Biol Cell. 2000;11:2863–72. doi: 10.1091/mbc.11.9.2863. [DOI] [PMC free article] [PubMed] [Google Scholar]
- 48.Marte BM, Downward J. PKB/Akt: connecting phosphoinositide 3-kinase to cell survival and beyond. Trends Biochem Sci. 1997;22:355–8. doi: 10.1016/s0968-0004(97)01097-9. [DOI] [PubMed] [Google Scholar]
- 49.Tramontin AD, Garcia-Verdugo JM, Lim DA, et al. Postnatal development of radial glia and the ventricular zone (VZ): a continuum of the neural stem cell compartment. Cereb Cortex. 2003;13:580–7. doi: 10.1093/cercor/13.6.580. [DOI] [PubMed] [Google Scholar]
- 50.Gritti A, Bonfanti L, Doetsch F, et al. Multipotent neural stem cells reside into the rostral extension and olfactory bulb of adult rodents. J Neurosci. 2002;22:437–45. doi: 10.1523/JNEUROSCI.22-02-00437.2002. [DOI] [PMC free article] [PubMed] [Google Scholar]
- 51.Lin R, Wang TT, Miller WH, Jr, et al. Inhibition of F-Box protein p45(SKP2) expression and stabilization of cyclin-dependent kinase inhibitor p27(KIP1) in vitamin D analog-treated cancer cells. Endocrinology. 2003;144:749–53. doi: 10.1210/en.2002-0026. [DOI] [PubMed] [Google Scholar]
- 52.van Driel M, Pols HA, van Leeuwen JP. Osteoblast differentiation and control by vitamin D and vitamin D metabolites. Curr Pharm Des. 2004;10:2535–55. doi: 10.2174/1381612043383818. [DOI] [PubMed] [Google Scholar]
- 53.Bikle DD. Vitamin D regulated keratinocyte differentiation. J Cell Biochem. 2004;92:436–44. doi: 10.1002/jcb.20095. [DOI] [PubMed] [Google Scholar]
- 54.Obradovic D, Gronemeyer H, Lutz B, et al. Cross-talk of vitamin D and glucocorticoids in hippocampal cells. J Neurochem. 2006;96:500–9. doi: 10.1111/j.1471-4159.2005.03579.x. [DOI] [PubMed] [Google Scholar]
- 55.Gedikoglu G, Altinoz MA. Differentiation-inducing liposoluble vitamin deficiency may explain frequent secondary solid tumors after hematopoietic stem cell transplantation: minireview. Neoplasma. 2008;55:1–9. [PubMed] [Google Scholar]
- 56.Deeb KK, Trump DL, Johnson CS. Vitamin D signalling pathways in cancer: potential for anticancer therapeutics. Nat Rev Cancer. 2007;7:684–700. doi: 10.1038/nrc2196. [DOI] [PubMed] [Google Scholar]
- 57.Moan J, Porojnicu AC, Dahlback A, et al. Addressing the health benefits and risks, involving vitamin D or skin cancer, of increased sun exposure. Proc Natl Acad Sci USA. 2008;105:668–73. doi: 10.1073/pnas.0710615105. [DOI] [PMC free article] [PubMed] [Google Scholar]
- 58.Qi X, Pramanik R, Wang J, et al. The p38 and JNK pathways cooperate to trans-activate vitamin D receptor via c-Jun/AP-1 and sensitize human breast cancer cells to vitamin D(3)-induced growth inhibition. J Biol Chem. 2002;277:25884–92. doi: 10.1074/jbc.M203039200. [DOI] [PubMed] [Google Scholar]
- 59.Mirescu C, Gould E. Stress and adult neurogenesis. Hippocampus. 2006;16:233–8. doi: 10.1002/hipo.20155. [DOI] [PubMed] [Google Scholar]
- 60.JoÎls M, Karst H, Krugers HJ, et al. Chronic stress: implications for neuronal morphology, function and neurogenesis. Front Neuroendocrinol. 2007;28:72–96. doi: 10.1016/j.yfrne.2007.04.001. [DOI] [PubMed] [Google Scholar]
- 61.Shin JH, Delabar JM, Lubec G. Mass spectrometrical analysis of phosphoprotein enriched in astrocytes of 15 kDa in mouse hippocampi. Amino Acids. 2004;27:339–44. doi: 10.1007/s00726-004-0131-3. [DOI] [PubMed] [Google Scholar]
- 62.Krishnan V, Han MH, Mazei-Robison M, et al. AKT signaling within the ventral tegmental area regulates cellular and behavioral responses to stressful stimuli. Biol Psychiatry. 2008;64:691–700. doi: 10.1016/j.biopsych.2008.06.003. [DOI] [PMC free article] [PubMed] [Google Scholar]
- 63.Roth KA, D’Sa C. Apoptosis and brain development. Ment Retard Dev Disabil Res Rev. 2001;7:261–6. doi: 10.1002/mrdd.1036. [DOI] [PubMed] [Google Scholar]
- 64.Blomgren K, Leist M, Groc L. Pathological apoptosis in the developing brain. Apoptosis. 2007;12:993–1010. doi: 10.1007/s10495-007-0754-4. [DOI] [PubMed] [Google Scholar]
- 65.Eyles D, Brown J, Mackay-Sim A, et al. Vitamin D3 and brain development. Neuroscience. 2003;118:641–53. doi: 10.1016/s0306-4522(03)00040-x. [DOI] [PubMed] [Google Scholar]
Associated Data
This section collects any data citations, data availability statements, or supplementary materials included in this article.
Supplementary Materials
Supporting info item
Supporting info item