

Abstract
The pharmacological action of morphine as a pain medication is mediated primarily through the μ-opioid receptor (MOR). With few exceptions, MOR is expressed in brain regions where opioid actions take place. The basis for this unique spatial expression of MOR remains undetermined. Recently, we reported that DNA methylation of the MOR promoter plays an important role in regulating MOR in P19 cells. In this study, we show that the differential expression of MOR in microdissected mouse brain regions coincides with DNA methylation and histone modifications. MOR expression could be induced by a demethylating agent or a histone deacetylase inhibitor in MOR-negative cells, suggesting that the MOR gene can be silenced under epigenetic control. Increases in the in vivo interaction of methyl-CpG-binding protein 2 (MeCP2) were observed in the cerebellum, in which the MOR promoter was hypermethylated and MOR expression was the lowest among all brain regions tested. MeCP2 is associated closely with Rett syndrome, a neurodevelopmental disorder. We also established novel evidence for a functional role for MeCP2’s association with the chromatin-remodelling factor Brg1 and DNA methyltransferase Dnmt1, suggesting a possible role for MeCP2 in chromatin remodelling during MOR gene regulation. We conclude that MOR gene expression is epigenetically programmed in various brain regions and that MeCP2 assists the epigenetic program during DNA methylation and chromatin remodelling of the MOR promoter.
Keywords: chromatin remodelling, DNA methylation, epigenetic regulation, opioid receptor, MeCP2, laser capture microdissection
Introduction
Morphine and endogenous opioid peptides exert their pharmacological and physiological effects by binding to opioid receptors. Three types of opioid receptors, μ, γ and κ, have been cloned, all belonging to the G protein-coupled receptor superfamily. On agonist binding, these receptors couple to G proteins and effect several signal transduction pathways thought to mediate a broad range of functions and pharmacological effects of endogenous and exogenous opioids [1]. Previous studies suggested that the μ-opioid receptor (MOR) plays a key role in mediating the major clinical effects of analgesics drugs such as morphine, as well as the development of tolerance and physical dependence on prolonged administration [2]. MOR is mainly expressed in the central nervous system, with densities varying greatly in different brain regions displaying different functional roles [3]. The MOR-expressing regions are involved in motivating and rewarding behaviours of opiates and other drugs of abuse.
In eukaryotes, DNA methylation and histone modifications are major epigenetic mechanisms implicated in the regulation of gene transcription. DNA methylation is a prominent feature of vertebrate genomes. This methylation occurs predominantly at cytosine residues in cytosine guanine dinucleotides (CpGs) [4]. Cell-type-specific DNA methylation patterning is one of the epigenetic events generating diverse cell types in the body [5]. Methylation of DNA is essential for mammalian development [6] and is associated with gene silencing in conjunction with histone core modifications, probably through chromatin remodelling [7–9]. Several findings support the premise that hypomethylation of the DNA surrounding the promoter region is a prerequisite for gene activation, whereas heavy methylation leads to gene silencing [10].
Methyl-CpG-binding proteins (e.g. MeCP2) bind preferentially to methylated DNA. MeCP2 is closely related to Rett syndrome, a neurodevelopmental disorder associated with onset of cognitive and motor deterioration at 6–18 months of life [11]. The X-linked MECP2 gene encoding the MeCP2 has mutations in about 80% of classical Rett syndrome patients [12]. MeCP2 recruits a corepressor complex containing Sin3 and histone deacetylase (HDAC) [8, 13], modifying chromatin behaviour and silencing transcriptional activity [14]. MeCP2 is also involved with histone methyltransferase activity [15] and the DNA methyltransferase Dnmt1 [16].
Nucleosome structure regulates the interaction of DNA with most nuclear factors. Chromatin accessibility is a key regulatory step in transcription, replication, DNA repair and recombination. The nuclear factor’s accessibility to DNA can be regulated by different ATP-dependent chromatin-remodelling complexes, which alter DNA-histone contacts by using the energy of ATP hydrolysis [17]. The SWI/SNF family is a well-characterized class of ATP-dependent chromatin-remodelling complexes and is conserved from yeast to human [18]. It disrupts nucleosome structure, increases DNA accessibility and is associated with transcriptional activity [19]. In yeast, SWI/SNF is a large (2 MDa) assembly [20] composed of Brm, Brg1, INI1 and BAF subunits [21] and is highly conserved in eukaryotes. SWI/SNF remodelling can regulate transcription in either direction.
It was reported recently that MeCP2 interacted with a chromatin-remodelling factor (Brm) [22], but a later report presented contradictory results [23]. In the present study, we examine the interaction of MeCP2 with chromatin-remodelling factors. MOR shows unique spatial patterns of expression the brain. To achieve such patterns, the expression of MOR must be strictly regulated. In previous studies, we showed that MOR transcription could be regulated epigenetically in several in vitro cell models. In the present study, we show that MOR mRNA levels in several brain regions can be regulated by epigenetic modifications in the MOR promoter region.
Methods and materials
Cell culture
NS20Y cells were cultured in DMEM supplemented with 10% FBS. Methods for P19 cell culture and differentiation have been described previously [24, 25]. Treatments with 5′-aza-2′-deoxycytidine (5-aza-dC; Sigma) and trichostatin A (TSA; Sigma, St. Louis, MO, USA) and cell harvesting for RNA determination were performed as described previously [25].
Dissection of brain regions and preparation of total RNA
Adult mice of the C57BL6/129Ola strain were decapitated and their brains removed rapidly. Whole brains were dissected into olfactory bulb, striatum, hippocampus, hypothalamus, midbrain, pons/medulla, cerebellum, frontal cortex and posterior cortex (Fig. 5D). Samples from spinal cord were also prepared. Dissected regions were pooled from two to three brains for analyses, and each set of experiments was performed at least three times. The dissected brain samples were frozen immediately in liquid nitrogen and stored at –80°C until analysis. Total RNA was purified from samples using TRI reagent (Molecular Research Center, Cincinnati, OH, USA).
Figure 5.
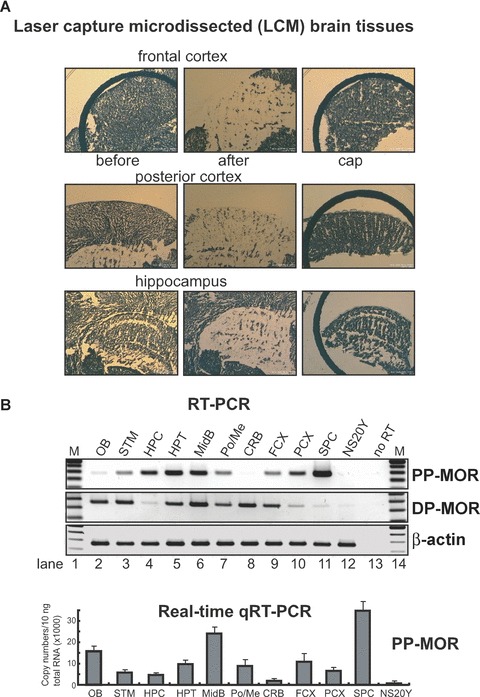
Differential expression of the MOR gene in laser capture microdissection (LCM) brain samples. (A)– Dissected regions (frontal cortex, posterior cortex, and hippocampus) from mouse brain tissue sections are shown before and after sampling, along with captured samples (Cap). (B)– Expression patterns of PP-MOR in specific microdissected brain regions, as determined by RT-PCR using the primers MOR-S1 and MOR-AS1. The results of the real-time qRT-PCR from LCM brain and spinal cord samples are shown graphically below the RT-PCR data. NS20Y cells were included as a control. (C)– Expression of cell type-specific marker genes in brain regions prepared by LCM were analysed by real-time qRT-PCR using PCR primers (Table 1) for glial fibrillary acidic protein (astrocytes), integrin-α M (Itgam; microglia), and microtubule-associated protein 2 (Mtap2; neuronal cells). NS20Y cells were used as a negative control. The results are expressed as described above for the MOR gene.
RNA isolation from laser capture microdissection (LCM) samples
Brains from C57BL6/129Ola mice were snap-frozen in liquid nitrogen and embedded in Tissue-Tek O.C.T. (Sakura Finetek). Serial sections, 10 μm in thickness, were mounted on Superfrost Plus (Fisher Scientific, Pittsburgh, PA, USA). LCM samples were prepared according to the manufacturer’s (Arcturus Engineering) instructions, optimized for preparing and staining LCM samples from frozen tissue. Cryostat sections for LCM were transferred from storage at –80°C and immediately immersed in 75% ethanol at room temperature for 30 sec. Slides were rinsed in H2O, washed in 75%, 95% and 100% ethanol for 30 sec. each and in xylene for 5 min. Slides were air-dried in a laminar flow hood for 5 min. and immediately processed for LCM. LCM was repeated at least three times for each sample and performed with a PixCell II Microscope (Arcturus Engineering) using a 60 mW laser with a 7.5-μm beam at 100–200 mV. Samples of RNA were prepared from 200–400 brain cells (one laser pulse equals approximately one cell). Total RNAs were isolated from the captured LCM cells using TRI reagent (Molecular Research Center, Cincinnati, OH, USA).
RT-PCR and real-time quantitative RT-PCR
Total RNA was isolated using TRI reagent and analysed by RT-PCR using MOR gene-specific primers [25, 26]. RT-PCR was performed with a QIAGEN OneStep RT-PCR kit (QIAGEN, Hilden, Germany) and MOR PCR primers (see Table 1). Similar reactions were performed with primers for β-actin as an internal control [25]. Primers for the neuronal cell marker neurofilament H (NF-H) and glial fibrillary acidic protein (GFAP) have been described previously [25, 27].
Table 1.
List of primers used in this study
| Name | Primer (5′→ 3′) | Location* | Notes |
|---|---|---|---|
| MOR-S1 | CCCTCTATTCTATCGTGTGTGT | +218 | Exon 1†, PP1-S‡ |
| MOR-AS1 | AGAAGAGAGGATCCAGTTGCA | +568 | Exon 2, PP1-AS‡ |
| MOR_E3-S§ | CATCAAAGCACTGATCACGATTCC | +903 | Exon 3, PP2-S‡ |
| MOR_E4-AS§ | TAGGGCAATGGAGCAGTTTCTGC | +1196 | Exon 4, PP2-AS‡ |
| D3-S | CCAGTCCTAATTAATTGCATATGG | −602 | DP1-S‡ |
| P1-AS | CATCCCCAAAGCGCCACTCTCTGAG | −243 | DP1-AS‡ |
| D2-S | GCACATGAAACAGGCTTCTTTCAC | −789 | DP2-S‡ |
| D6-AS | GAGGGTGGGAAGAGAGACTCTAAG | −447 | DP2-AS‡ |
| S-408 | CCAATTTACACTCCTTTACACGGAAGT | −408 | Real-time qPCR primer for MOR |
| AS-285 | GGGCTGTGAGGGATCCAGAGGCTAG | −285 | Real-time qPCR primer for MOR |
| MS-647 | TTTTTAGATATGGGGATGTGGGTA | −647 | MSP# |
| MAS-353 | CTCAAAATCAACCTCCTCAATCTC | −353 | MSP |
| MAS-180 | CCAATATTCTCCTCTACTTATAACC | −180 | MSP |
| MS-376 | GAGATTGAGGAGGTTGATTTTGAG | −376 | MSP |
| MAS-79 | CTCTTCCTCTCACAACTACCCTAAAC | −79 | MSP |
| GFAP-S1 | TGGCCACCAGTAACATGCAA | +725 | Exon 4, NM_010277$ |
| GFAP-AS1 | CAGTTGGCGGCGATAGTCGT | +858 | Exon 5 |
| GFAP-S2 | ATGAGGAGGAAGTTCGAGAAC | +602 | Exon 3/4 |
| GFAP-AS2 | CAGCAATTTCCTGTAGGTGG | +1101 | Exon 6/7 |
| Itgam-S3 | CTGCCTCAGGGATCCGGAAAG | +680 | Exon 7, NM_001082960$ |
| Itgam-AS3 | TGTCTGCCTCGGGGATGACATC | +829 | Exon 8 |
| Itgam-S2 | TCTTGATTGATGGCTCCGGTAG | +458 | Exon 6 |
| Itgam-AS2 | TTCAAAGTTGTCCACTTGGAAC | +957 | Exon 9 |
| Mtap2-S | AAGCACTGATTGGGAAGCACTC | −140 | Exon 5, NM_001039934$ |
| Mtap2-AS | CGTCGGCCATCTTTCAGATCTC | +10 | Exon 6 |
| Mtap2-S2 | TTCCTCAGCTTGTCTCTAAC | −165 | Exon 4 |
| Mtap2-AS2 | GCTTCAGCTGTGACTACTTG | +305 | Exon 7 |
The location (starting at the 5′ end) of each primer is designated relative to +1 (as the ATG start codon).
The exon location of the indicated primer.
Alternative names for the primers used for DP- and PP-mediated transcripts (see Fig. 4).
S and AS in the primer name indicate sense and antisense primers, respectively.
MSP: methylation-specific PCR. ‘M’ as the first capital letter of a primer name indicates a primer specific for methylated MOR DNA.
gb: GenBank accession number.
For real-time quantitative RT-PCR (qRT-PCR), 5 μg of total RNA were treated with DNase I and reverse-transcribed using RT (Roche, Indianapolis, IN, USA) and primers combined with oligo (dT) and random hexamer. One-fortieth of this reaction was used for real-time qRT-PCR analysis of gene expression. Real-time qPCR was performed in an iCycler (Bio-Rad, Hercules, CA, USA) using SYBR Green I (Quantitect SYBR Green PCR kit; QIAGEN). Primer sequences are shown in Table 1. To calculate relative levels of mRNA gene expression, amplification curves of a test sample and standard samples containing 101–108 molecules of the gene of interest (e.g. the MOR expression plasmid pmMUEG [28]) were monitored and the number of target molecules in the test sample were analysed using qCalculator ver. 1.0 software (http://www.gene-quantification.de/download.html#qcalculator) [29], based on the mathematical model of Pfaffl [30]. For cell type-specific marker genes, each template was generated by PCR using the corresponding PCR primers: GFAP-S2 and GFAP-AS2 for GFAP as an astrocyte marker, Itgam-S2 and Itgam-AS2 for integrin-α M (Itgam) as a microglial marker, Mtap2-S2 and Mtap2-AS2 for microtubule-associated protein 2 (Mtap2) as a neuronal cell marker [31]. The template PCR products were around 500 bp sizes. After purifying the products using QIAquick PCR purification Kit (QIAGEN), the templates were diluted serially to make standard samples containing 101–108 molecules. Real-time qRT-PCR was performed as described above. Real-time qRT-PCR primers (Table 1) for GFAP, Itgam and Mtap2 were GFAP-S1 and GFAP-AS1, Itgam-S3 and Itgam-AS3 and Mtap2-S and Mtap2-AS, respectively. The number of target molecules was normalized against that obtained for β-actin, used as an internal control. The specificity of RT-PCR primers was determined using a melt curve after the amplification to show that only a single species of qPCR product resulted from the reaction. Single PCR products were also verified on an agarose gel. The above RT-PCR and real-time qRT-PCR studies were repeated two or three times to obtain statistical significance.
Coimmunoprecipitation and Western blot analysis
Procedures for coimmunoprecipitation and Western blots were performed as described [32]. Briefly, tissues and cells were lysed in a buffer containing 1% Triton X-100, 10 mM Tris, 5 mM EDTA, 50 mM NaCl, 50 mM NaF, supplemented with protease inhibitors (Roche). Approximately 1 mg of each clarified cell lysate was incubated overnight at 4°C with antibodies. Immunoprecipitates were recovered on protein G-Sepharose beads, washed extensively and separated on SDS-PAGE. Proteins were transferred on to Immobilon™-P (Millipore, Billerica, MA, USA) membrane for Western blotting.
Western blot analyses were performed on protein samples extracted from TRI reagent as described [25]. The transfer membrane was incubated with the following primary antibodies and detected using an ECF Western detection kit (Amersham, Piscataway, NJ, USA): anti-MeCP2 (generous gift of Dr. Weidong Wang, NIH), anti-N-cadherin (33–3900; Zymed Lab, South San Francisco, CA, USA), anti-βIII-tubulin (PRB-435P; Covance, Princeton, NJ, USA), anti-Brg1 (07–478; Upstate, Charlottesville, VA, USA), anti-Brm/ Smarca2 (ab15597; Abcam, Cambridge, MA, USA) and anti-β-actin (4967; Cell Signaling, Danvers, MA, USA). The membrane was scanned using a PhosphorImager (Storm 860; Molecular Dynamics, Pittsburgh, PA, USA).
Methylation analysis
Genomic DNA from the NS20Y cells and brain samples were isolated using the TRI reagent and linearized with the restriction enzyme EcoRV. Bisulphite treatment of DNA was performed according to the manufacturer’s recommendations (EZ DNA Methylation-Gold Kit™; Zymo Research, Orange, CA, USA). The resulting bisulphite-modified DNA was amplified by PCR. The primer sequences for the PCR amplification of MOR (i.e. bisulphite sequencing primers) are listed in Table 1. The PCR products were cloned into the pCR2.1-TOPO vector (Invitrogen, Carlsbad, CA, USA). Clones from NS20Y cells containing a correct insert size were analysed for DNA sequencing.
The PCR products were also used for restriction enzyme (RE)-assisted methylation analyses. All the methyl-CpG-sensitive restriction enzymes (BstBI, ClaI, Hpy188I and HpyCH4IV) were purchased from New England Biolabs (Ipswich, MA, USA). After adjusting for similar amounts of each PCR product in the restriction enzyme reactions, the samples were incubated for 1 hr at the recommended temperature. The resulting DNA was loaded onto a 2.5% agarose gel and quantified by Kodak molecular imaging software.
Chromatin immunoprecipitation assay (ChIP)
ChIPs were performed by using a modified protocol from Upstate as reported previously [25, 33, 34]. Following dissection, tissues from three brains were pooled, minced in cold PBS and cross-linked using 1% formaldehyde in PBS for 10 min. The cross-linking was quenched by the addition of glycine to a final concentration of 0.125 M. The samples were washed once with cold PBS and Dounce-homogenized in ChIP lysis buffer (Upstate). After 5 min. on ice, nuclei were sedimented by centrifugation. The pellet was then resuspended in nuclear lysis buffer (Upstate). Following a 5-min. incubation on ice, the lysates were sonicated under conditions yielding fragments ranging from 200 to 500 bp. Insoluble debris was removed by centrifugation, and the supernatants were collected and flash-frozen in liquid nitrogen. Two percentage of each lysate was reserved as the input (i.e. pre-precipitation control), and the residual lysate was subjected to immunoprecipitation. Chromatin samples were pre-cleared at 4°C with recombinant protein G-agarose beads (Upstate) coated with salmon sperm DNA. Pre-cleared lysates (100 μl) diluted in immunoprecipitation buffer (Upstate) were immunoprecipitated overnight at 4°C with 2 μg of antibodies against each of the following: anti-AcH3 (06–599), anti-AcH4 (06–866), anti-H3dmK4 (07–030), anti-H3dmK9 (07–441) (all from Upstate), anti-Dnmt1 (Imgenex; IMG-261A), anti-Dnmt3b (Imgenex; IMG-184A) and anti-MeCP2. All ChIP assays were controlled by performing parallel experiments with either no antibody, with normal rabbit serum, or with non-specific gal4 antibody (sc-577; Santa Cruz) pulldowns. Each immunoprecipitated DNA sample was analysed at least twice by real-time qPCR reactions using the Quantitect SYBR Green PCR kit (QIAGEN).
For reciprocal ChIP (ReChIP), the immunocomplexes were eluted by incubating the samples while rotating with two changes (30 min. each) of 30 μl ReChIP elution buffer (10 mM DTT) at 37°C. One sixth of the eluent volume was reserved as ‘first ChIP assay’. The supernatant was diluted 1:40 in ChIP dilution buffer, antibody against the second protein of interest was added, and the new immunocomplexes were allowed to form by incubating at room temperature for 1 hr on a rocking platform. The immunocomplexes were collected by incubating on a rocking platform with 40 μl of protein G-agarose slurry (Upstate) for 1 hr at room temperature and washing as indicated above. In both cases, the immunocomplexes were eluted twice by adding 250 μl elution buffer (1% SDS in 100 mM NaHCO3) and incubated with rotation for 10 min. at 65°C. After centrifugation, the supernatants were collected and the cross-linking was reversed by adding NaCl to final concentration of 200 mM and incubating for 4 hrs at 65°C. The remaining proteins were digested by adding proteinase K (final concentration 40 μg/ml) and incubation for 1 hr at 45°C. The DNA was recovered by phenol/chloroform/isoamyl alcohol (25/24/1) extraction and precipitated with 0.1 volumes of 5 M lithium chloride and 2 volumes of ethanol, using glycogen as a carrier.
Results
mRNA expression of MOR gene and promoter methylation status
We reported previously [25] that the MOR promoter was hypermethylated in P19 cells (i.e. MOR-negative cells) and hypomethylated in neuronally differentiated P19 cells (MOR-positive cells). In differentiated cells, the interaction of MeCP2 in vivo was reduced in the MOR promoter region relative to undifferentiated P19 cells, coincident with histone modifications that are relevant to active transcription. This suggested that silencing of the MOR gene in P19 cells was mediated through MeCP2 in a methylation-dependent manner at the proximal promoter (PP). These data suggested that DNA methylation was closely linked to the MeCP2-mediated chromatin structure of the MOR gene. The current study was aimed at determining if similar methylation-dependent regulation of the MOR gene occurred in brain tissues in vivo (i.e. tissue microdissected from specific regions of the mouse brain) and in another MOR-negative cells (i.e. the neuroblastoma cell line NS20Y). Initially, the methylation status of the MOR PP and distal promoter (DP) regions in NS20Y cells was examined. Three CpG sites (–569, –388 and –344) in the PP were highly methylated (>73%), whereas other sites were less so (Fig. 1C). Interestingly, higher levels of methylation were observed downstream from the PP transcription initiation site (ppTIS) in NS20Y cells (Fig. 1C) relative to P19 cells (both normal and differentiated) or from mouse brain [25], which showed almost no methylation in the region (see also Fig. 1B; –182 and –178 sites).
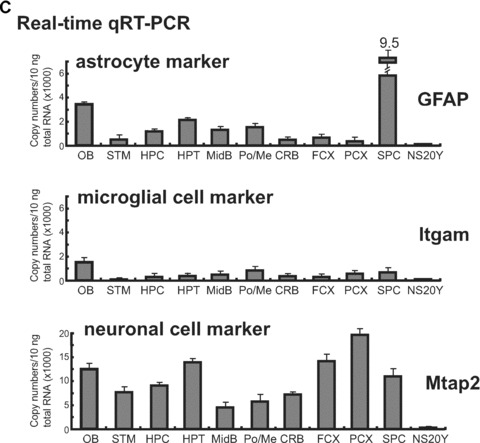
Figure 1.
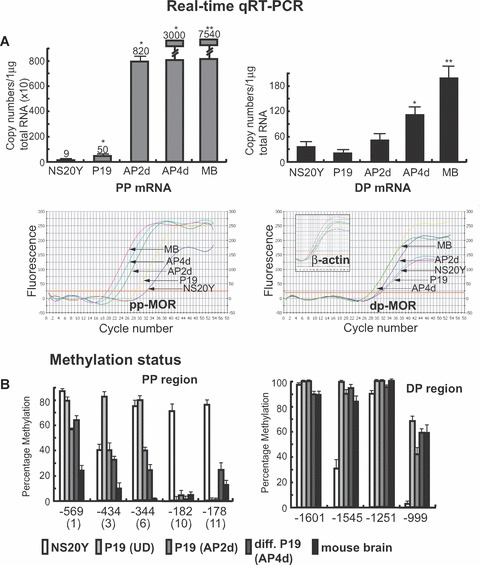
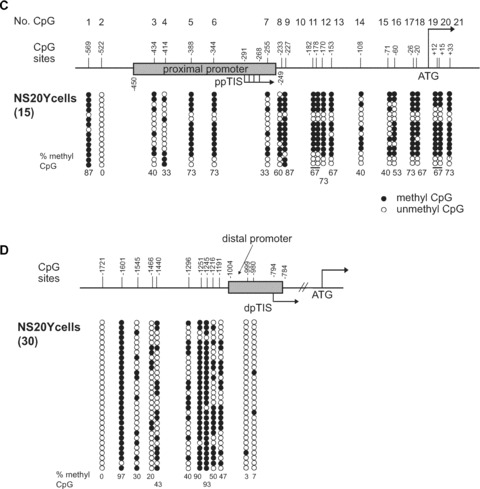
Expression of the μ-opioid receptor (MOR) gene in mouse neuronal cells at different stages of development and in the mouse brain, along with levels of CpG DNA methylation in the MOR promoters. (A). Expression of the MOR gene in the indicated cell types and in whole mouse brain analysed by real-time quantitative RT-PCR (qRT-PCR). PP mRNA: proximal promoter (PP)-derived MOR transcripts; distal promoter (DP) mRNA: DP-derived MOR transcripts. Levels of MOR mRNA were determined in normal (i.e. undifferentiated; P19), intermediate (AP2d) and fully differentiated (AP4d) P19 cells, neuroblastoma cells (NS20Y), and whole mouse brain (MB). The primers used were MOR_E3-S and MOR_E4-AS for PP mRNA and S-408 and AS-285 for DP mRNA (see Table 1). Graphic representations of the real-time qRT-PCR data are presented beneath each quantitative bar graph. *Indicates P < 0.05 compared with NS20Y samples (n≥ 3), **indicates P < 0.05 (for MB) compared with AP4d. The data are representative of three independent experiments. (B) – Cell- or tissue-dependent methylation changes within the MOR promoter. These data summarize the methylation percentages for PP and DP MOR observed in NS20Y cells (panels C and D), and from our previous report [25] for other cell types and brain tissues. Only sites showing significantly different methylation percentages are displayed. The data are representative of three independent experiments. Sequencing data from at least 10 clones for each sample were used to quantify the percentage of methylation in the above-mentioned CpG sites. (C) and (D) – Methylation status of the promoter regions of the MOR gene in NS20Y cells. (C) – The 5′-flanking region of the MOR gene contains 21 methyl CpG sites from –569 to +33 (with the ATG start codon designated as +1). The numbers on top of the figure (No. CpG) are arbitrary designations to indicate each methyl CpG site. ppTIS indicates the transcription initiation sites of the major MOR PP, containing four sites [47]. Methylation-specific PCR (MSP) was performed with primers MS-630 and MAS+65 [36] followed by TA cloning (Invitrogen). Each row of circles represents a single cloned allele, and each circle indicates a single CpG site at a specific location. Fifteen individual clones were analysed for methylation status. Filled and open circles represent the methylated and unmethylated CpG sites, respectively. The percentages of methyl CpG versus unmethylated CpG are indicated for all CpG sites. (D) – Methylation status of the DP of the MOR gene in NS20Y cells. Except as noted, experiments were performed as described for Fig. 1C. For the DP and its upstream region, methylation-specific PCR was performed with the primers MS-1754 and MAS-927 [36]. dpTIS: transcription initiation site of the DP [46].
Expression profiles of two MOR transcripts in various cells types and in mouse brain, along with the methylation status of their MOR gene promoters
We examined the expression profiles of two MOR transcripts in various cell types and in mouse brain. Using real-time qRT-PCR (Fig. 1A), the lowest levels of PP mRNA were observed in NS20Y cells; normal P19 cells expressed approximately five times as much PP mRNA as did the NS20Y cells. In intermediate neuronally differentiated P19 cells (AP2d), the PP message dramatically increased (16-fold higher than in undifferentiated P19 cells). Fully differentiated P19 cells (AP4d) expressed 60 times more PP mRNA than did undifferentiated P19 cells, and mouse brain tissue expressed the message at levels 151 times greater than normal P19 cells. Similarly, although DP-MOR mRNA was also expressed at higher levels in differentiated P19 cells than in undifferentiated cells, and the highest levels were observed in brain tissue, the overall levels of expression were markedly less different than those seen with the PP mRNA (Fig. 1A).
To examine the epigenetic mechanisms that might regulate MOR gene transcription, the methylation status of the DNA in the MOR gene promoter was assessed using bisulphite treatment and sequencing analyses (Fig. 1B). Five CpG sites in the PP region, including three sites upstream of (–569, –434 and –344) and two sites downstream from (–182 and –178) the transcription initiation site (TIS; –268 to approximately –291), were highly methylated in NS20Y cells; two of these sites (–182 and –178) were unmethylated in P19 cells (Fig. 1B). Those two sites (–182 and –178) were also methylated to a lesser degree in AP2d and AP4d cells, or in mouse brain tissue, than in NS20Y cells. Methylation levels of the other three sites (–569, –434 and –344, located in the PP region) correlated with levels of MOR expression in all cell types tested, as well as in mouse brain. NS20Y cells (expressing the lowest levels of MOR) had the highest methylation levels at those three sites, whereas mouse brain tissue (expressing the highest levels of MOR) had the lowest methylation levels. P19 cells at all stages of development showed a similar inverse correlation between MOR expression and methylation levels at those three sites (Fig. 1B). These data suggest that these three sites have an actual role in the regulation of MOR, based on their methylation levels. It is possible that two of the sites (–182 and –178) of the downstream ppTIS must be unmethylated as prerequisite for initiating MOR gene expression, but further investigation is needed to verify this hypothesis. In the DP region (Fig. 1B and D), all four sites were hypermethylated at comparable levels in all cell types and brain tissues, with the exception of two sites (–1545 and –999) in NS20Y cells that were methylated at lower levels (Fig. 1B and D). The degree of methylation in the sites tested did not seem to correlate with the levels of MOR expression in any of the samples.
DNA methylation and histone modification of the MOR promoter are associated with MOR gene transcription
To investigate whether induction of the MOR gene is mediated by DNA methylation or chromatin modification, we treated NS20Y cells with an inhibitor of DNA methylation (5-aza-dC) and a HDAC inhibitor (TSA). Both drugs up-regulated MOR expression in the cells (Fig. 2). Samples treated with as little as 2 μM 5-aza-dC for 3 days showed increased PP-MOR transcripts. Cells treated with 300 nM TSA for 24 hrs also showed an increase in the expression of the PP transcript (Fig. 2A). Similar inductions of the minor DP transcript were observed in both 5-aza-dC- and TSA-treated samples (Fig. 2B). Combined treatment with 100 nM TSA and 1–2 μM 5-aza-dC resulted in enhanced induction of PP-MOR transcript (Fig. 2C). These data suggest that epigenetic mechanisms, such as DNA methylation or histone modification, are involved in MOR gene silencing.
Figure 2.
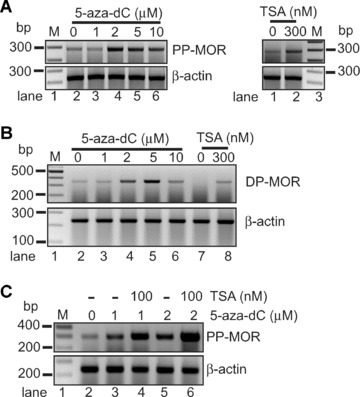
Role of DNA methylation and chromatin modification in MOR gene expression. (A) – Samples were treated with TSA for 24 hrs or 5-aza-dC for 72 hrs to induce maximal effects on MOR levels in NS20Y cells. Primers for proximal promoter-derived MOR transcripts (PP-MOR) were MOR_E3-S and MOR_E4-AS (Table 1), located on exons 3 and 4, respectively, thus eliminating genomic DNA contamination in the RT-PCR reaction. (B) – Primers for distal promoter (DP)-derived MOR transcripts (DP-MOR) were D3-S and P1-AS. (C) – Combining treatment with 100 nM TSA with either 1 μM (lane 4) or 2 μM (lane 6) of 5-aza-dC enhanced the induction of PP-MOR relative to samples treated with 5-aza-dC alone (lanes 3 and 5). Primers for β-actin were used as internal controls (see Table 1).
Analysis of methylation status by methylation-sensitive restriction enzyme assay
Repression of MOR expression in NS20Y cells was alleviated by 5-aza-dC treatment (Fig. 2). Thus, it was important to determine whether the methylation state of the MOR gene promoter could be changed in NS20Y cells treated with 5-aza-dC. The bisulphite technique for methylation analysis is laborious and time-consuming when multiple samples are to be analysed. We therefore developed a methylation-sensitive restriction enzyme assay for methylation analysis of both promoter regions. Although the new method is limited only to CpG sites containing the corresponding restriction enzyme recognition region, it provides an efficient means for analysing several samples in a shorter time and with less work. Briefly, sodium bisulphite is used to convert all unmethylated cytosine nucleotides to thymidine; methylation-specific PCR is then performed. The CpG site is then digested with a methylation-sensitive restriction enzyme (e.g. Hpy188I) that cleaves only at the methylated CpG sites (in this case, –569). Agarose gel electrophoresis revealed both the cleaved shorter band and a band representing the undigested original PCR product. The ratio of the intensity of the undigested band to the digested band increased with 5-aza-dC treatment in a dose-dependent manner (Fig. 3). P19 cells (undifferentiated and fully differentiated) and mouse brain were included as controls. The corresponding methylation percentages revealed that the methylated PP was demethylated in the presence of 5-aza-dC (Fig. 3B). This correlates with the MOR mRNA induction observed by treatment with 5-aza-dC (Fig. 2). Similar experiments performed for the –182 and –178/–170 sites using Hpy188I and HpyCH4IV likewise showed reduced methylation after 5-aza-dC treatment. To confirm these results, standard DNA sequencing was performed on each PCR product pool (Fig. 3C). Two CpG sites (–569 and –434) showed reduced methylation after 5-aza-dC treatment. The CpG site –1601 (recognized by ClaI) in the upstream region of the DP was also demethylated by 5-aza-dC (Supporting Fig. 1), coincident with increased DP-MOR expression (Fig. 2).
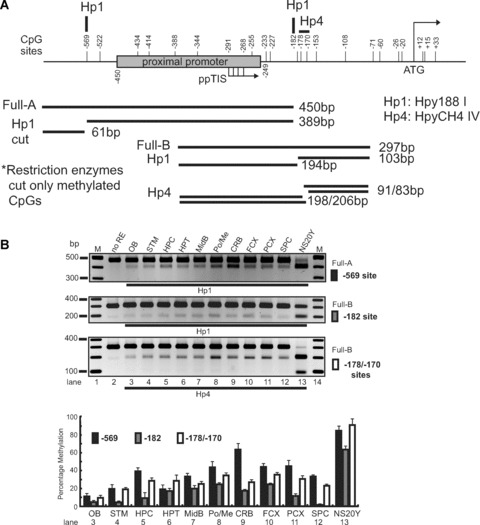
Figure 3.
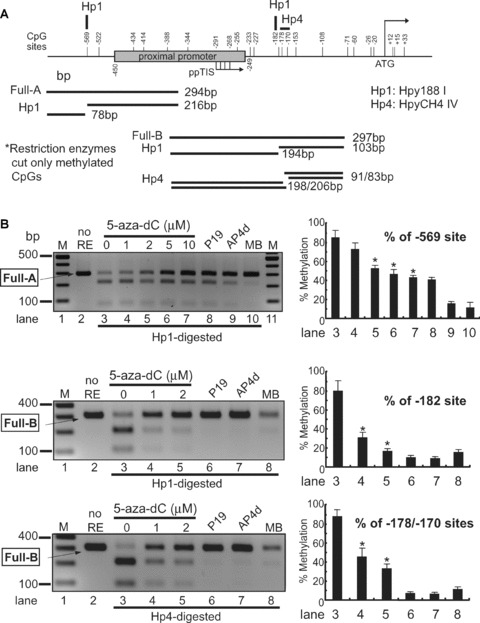
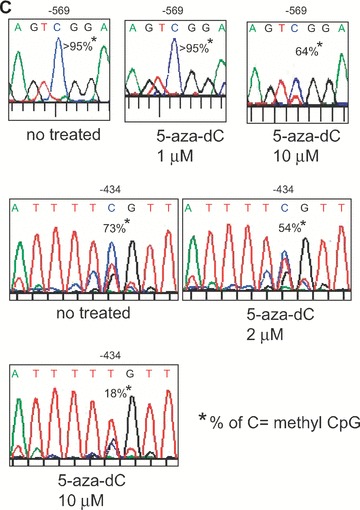
Analysis of DNA methylation by methylation-sensitive restriction enzyme assay. (A) – The proximal MOR promoter, its flanking regions, and the positions of the CpG sites are shown. Methylation-specific PCR products (Full-A) were amplified using MS-647 and MAS-353 primers (Table 1) after sodium bisulphite treatment for genomic DNA. The restriction enzyme Hpy188I (Hp1) recognizes and cuts amplified PCR products that contain the retained C residue at the –569 position. For the –182 and –178/–170 sites, MS-376 and MAS-79 primers were used for the PCR amplification (Full-B) and digested with either Hp1 or HpyCH4IV (Hp4), respectively. The predicted sizes of the methylation-specific PCR products and the digested fragments are shown below. (B) – PCR products (Full-A and Full-B fragments) from NS20Y cells treated with the indicated concentrations of 5-aza-dC, as well as from undifferentiated P19 cells, fully differentiated P19 cells (AP4d), and mouse brain (MB). Intact PCR product (no RE) was used as a control. The graphs to the right of each gel show the percentage of methylation, determined by comparing the intensity of the bands cut by Hp1 or Hp4 relative to the intensity of the unmethylated (i.e. upper, uncut bands). Column numbers in graph indicate the corresponding gel lanes. Data for the graphs are the mean ± S.E.M. from three independent experiments. *Indicates P < 0.05 compared with no 5-aza-dC-treated samples. (C) – Methylation analyses of MOR promoter by automated authentic DNA sequencing. Methylation percentages on two CpG sites (–569 and –434) from the Full-A methylation-specific PCR product were reduced by 5-aza-dC treatment.
Differential expression of PP and DP transcripts in regions dissected from mouse brain
To understand the epigenetic mechanisms regulating the MOR gene in vivo, we first analysed MOR mRNA expression in tissues dissected from specific regions of the mouse brain. Nine such regions (Fig. 4D), as well as the spinal cord and NS20Y cells (as MOR-negative cells) were chosen for analysis of PP and DP transcripts. High levels of expression of the DP transcript were observed in the olfactory bulb, hypothalamus, midbrain and cerebellum, whereas low expression was observed in the striatum, hippocampus and posterior cortex (Fig. 4B). In contrast, PP transcripts (Fig. 4A) showed a quite different expression profile. Highest expression of PP was observed in midbrain, followed by hypothalamus and lower levels in the cerebellum, both the frontal and posterior cortices, and hippocampus. This PP transcript pattern was similar to that reported previously [3]. In order to assure that brain tissue microdissections were performed properly, we used neuron- and astrocyte-specific markers for RT-PCR analyses (Fig. 4E). Genes specific for each cell type were present in all brain regions examined, but the ratios differed between regions, suggesting that the corresponding cell types were distributed differentially in the microdissected tissues.
Figure 4.
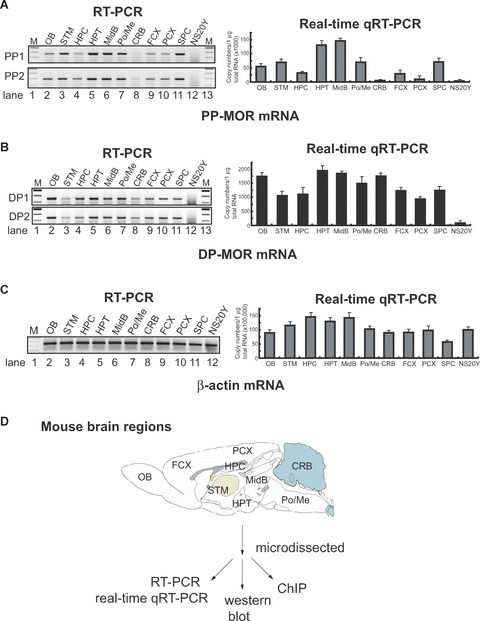
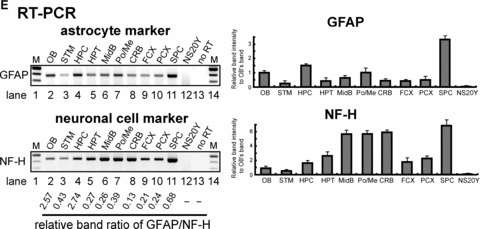
Differential expression of the PP- and distal promoter (DP)-transcripts in regions microdissected from mouse brain. (A) and (B). Mouse brains were dissected into different regions (as shown in Fig. 4D) for the epigenetic study of MOR gene expression: olfactory bulb (OB), striatum (STM), hippocampus (HPC), hypothalamus (HPT), midbrain (MidB), Pons/Medulla (Po/Me), cerebellum (CRB), frontal cortex (FCX), posterior cortex (PCX), spinal cord (SPC). NS20Y cells were used as the MOR-negative control. To reduce PCR errors, two PCR primer sets (PP1 and PP2 for PP-MOR, DP1 and DP2 for DP-MOR; see Table 1) amplifying from different locations for each transcript were used for RT-PCR. For real-time qRT-PCR, only one set of PCR primers was used for each transcript (MOR_E3-S and MOR_E4-AS for PP-MOR, S-408 and AS-285 for DP-MOR). (C) – Results of RT-PCR and real-time qRT-PCR using β-actin primers (Table 1). (D)– Diagram of mouse brain regions (sagittal view) included in this study. Dissected regions from two to three brains were pooled for the indicated experiments. At least three different dissections were performed separately to repeat the RT-PCR and real-time qRT-PCR experiments. Data shown for real-time qRT-PCR are mean ± S.E.M. from the three independent experiments. (E)– Expression of neuronal cell marker [27] neurofilament H (NF-H) and astrocyte marker glial fibrillary acidic protein (GFAP) genes in microdissected brain regions analysed by RT-PCR. Primers for NF-H and GFAP [25] were used for RT-PCR. NS20Y cells and samples with no added RT enzyme were used as negative controls. The intensities of the bands are expressed graphically (right), and the ratio of GFAP to NF-H expression is indicated under the gels.
For a more defined analysis of specific brain regions, we used LCM to isolate each brain region. The images (Fig. 5A) clearly show that brain tissues were captured with minimum contamination from other brain regions. RT-PCR and real-time qRT-PCR performed on the LCM samples (Fig. 5B) showed high levels of PP-MOR expression in spinal cord, midbrain and hypothalamus, whereas lower levels were present in the cerebellum, posterior cortex and hippocampus. The PP-MOR expression profiles of the LCM samples were somewhat similar to those seen in microdissected tissues (Fig. 4A), although the differences in expression seen in the LCM samples were much greater than those observed in the microdissected samples. It is possible that the use of LCM to isolate tissue from specific regions reduces contamination with tissues from adjacent regions that might occur during microdissection. In contrast, the expression of DP-MOR transcripts (Fig. 5B) in LCM samples differed significantly from those observed in the microdissected tissues (Fig. 4B): The levels of DP-MOR in the cerebellum were higher when examined by LCM relative to those of microdissected cerebellar tissue, whereas LCM analysis showed lower levels of DP-MORs in the hippocampus, posterior cortex and spinal cord than did microdissected samples. This suggests that LCM provides a greater level of precision for tissue preparation than does traditional microdissection.
We also performed real-time RT-PCR experiments to detect cell-type-specific markers in brain tissues obtained by LCM (Fig. 5C). The expression of the astrocyte-specific GFAP was very similar to the results seen in microdissected tissues (Fig. 4E), with the exception of the hippocampus. The neuronal cell marker Mtap2 was distributed widely throughout all brain regions, with the highest density occurring in the posterior and frontal cortices, the hypothalamus and the olfactory bulb. Although both NF-H and Mtap2 are specific for neuroal cells, the expression profiles for these genes differed between the microdissected samples (Fig. 4E) and the LCM-derived tissues (Fig. 5C). However, the results obtained by the two methods are not directly comparable, because they do not detect single cell-derived expression of a single gene marker. Indeed, it is likely that these two genes have different expression patterns because NF-H generally is used as axonal marker whereas Mtap2 is used as dendritic marker. PCR with Itgam primers to detect microglial cells showed low levels of expression in all regions, with the exception of the olfactory bulb. Overall, the use of the cell type-specific markers indicates that the use of LCM to prepare specific brain regions was performed appropriately, because the patterns of gene expression were distinctly for each region.
DNA methylation status of the MOR promoter regions in microdissected brain regions
Three CpG sites (–569, –182 and –178) in the MOR of microdissected brain regions were analysed for their methylation by the restriction enzyme-assisted assay. For the first CpG site (–569) of the Full-A fragment, the highest level of methylation occurred in cerebellum, followed by the pons/medulla, frontal cortex, posterior cortex and hippocampus. Lower levels of methylation were observed in olfactory bulb, striatum, hypothalamus, midbrain and spinal cord (Fig. 6). This pattern correlates inversely with the levels of PP expression (Fig. 4A). For the CpG sites downstream from the ppTIS, the methylation percentage of the –182 site was below 20–30% for all regions examined. In contrast, methylation levels of 30–40% were observed for the –178 site in the hippocampus, hypothalamus, midbrain, pons/medulla, cerebellum, frontal and posterior cortices. This supports the notion that CpG sites upstream of the PP have greater potential to regulate MOR transcript levels than those sites downstream from the ppTIS.
Figure 6.
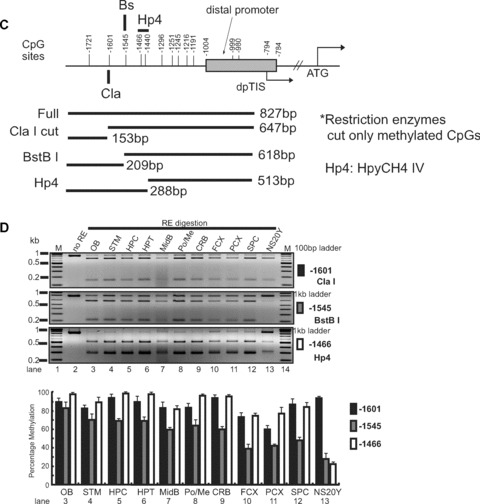
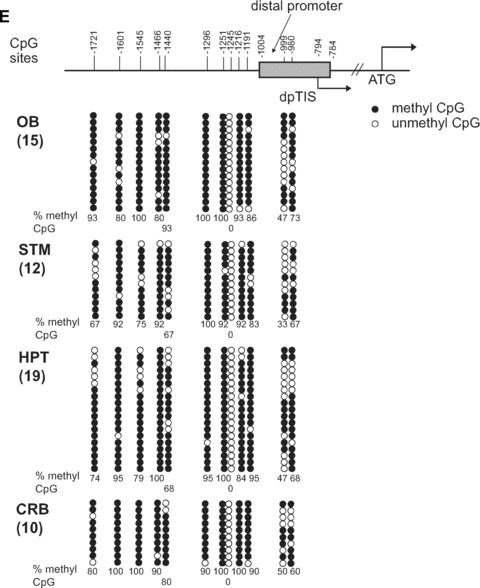
Restriction enzyme (RE)-assisted methylation analysis of the proximal MOR promoter from dissected mouse brain regions. Analyses were performed as described for Fig. 3, except as indicated. (A) – For the –569 CpG site, methylation-specific PCR products were amplified using MS-630 and MAS-180 primers (Table 1), generating the Full-A fragment. Hp1 was used to cut the amplified PCR products. For the –182 and –178/–170 sites, PCR amplification was performed with the MS-376 and MAS-79 primers (Full-B) and samples were digested with either Hp1 or Hp4, respectively. (B) – Methylation-specific PCR products from various regions of the mouse brain. The demethylation of the MOR promoter is expressed graphically below the gel as the mean ± S.E.M. (C) and (D) – RE-assisted methylation analysis of the MOR DP from dissected mouse brain regions. Methylation-specific PCR products were amplified using MS-1754 and MAS-927 primers (Table 1) generating the Full fragment. Several Restriction enzymes (ClaI, BstBI, and HpyCH4IV) were used to detect methylation status, as indicated. The analyses and quantification of methylation were performed as described above. (E)– Methylation status of the DP of the MOR gene in mouse brain regions (olfactory bulb, striatum, hypothalamus, and cerebellum). Except as noted below, experiments were performed as described for Fig. 1D. dpTIS: transcription initiation site of the MOR DP. Methylation-specific PCR was performed with primers MS-1754 and MAS-927 (see Table 1) followed by TA cloning (Invitrogen). The percentages of methyl CpG versus unmethylated CpG are indicated for all CpG sites.
Methylation analyses were similarly performed for the DP region (Fig. 6C and D). Three CpG sites (–1601, –1545 and –1466) were analysed based on the availability of restriction enzyme recognition sites. However, the methylation patterns did not appear to correlate with mRNA expression levels in tested regions. We therefore decided to analyse all the CpG sites in DP-MOR from four tissues (olfactory bulb, striatum, hypothalamus and cerebellum) for methylation using sodium bisulphite conversion and DNA sequencing (Fig. 6E). Overall, CpG sites in the DP were hypermethylated, except for three sites: –999, –980 (ranging from 30% to 70% methylation) and –1245 (no methylation). Although forced demethylation induced by 5-aza-dC (see Supporting Fig. 1) correlated with DP-MOR mRNA expression levels in NS20Y cells (Fig. 2B), methylation status did not correlate with DP-MOR mRNA expression in brain regions; the methylation patterns in most of the regions remained elevated even as the DP-MOR mRNA levels differed.
Interaction of MeCP2 with the MOR promoter is increased in the cerebellum
Direct binding of specific methyl-CpG-binding proteins to methylated DNA is a major mechanism of methylation-induced transcriptional repression [35]. We examined whether the differential MOR transcription levels in dissected brain regions correlated with the methylation of the MOR promoter and/or greater affinity for methyl-CpG-binding proteins. We used a ChIP assay with real-time qPCR to investigate the association of endogenous MeCP2 with MOR promoters (Fig. 7A). The highest levels of PP-MOR association with MeCP2 occurred in the cerebellum. This was consistent with the methylation status (Fig. 6B) and levels of MOR expression in the cerebellum (Figs. 4A and 5B). This represents specific binding of MeCP2 with the MOR promoter, because normal rabbit serum and a non-specific antibody (anti-gal4) failed to immunoprecipitate MOR promoter sequences (Fig. 7B). Also, the release of MeCP2 was specific to the MOR promoter, because the interaction of MeCP2 with the imprinted gene H19 [36] showed slight regional differences (Fig. 7A). As a negative control, we performed ChIP assays with β-actin, which is actively expressed in all brain regions, independent of methylation of its regulatory region. MeCP2 was not associated with the β-actin gene (Fig. 7A).
Figure 7.
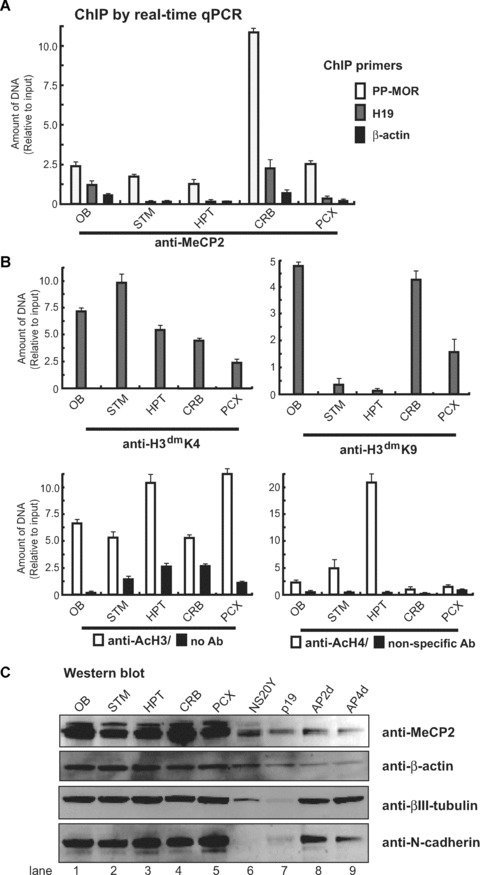
Chromatin immunoprecipitation (ChIP) analysis by real-time qPCR for chromatin modification and MeCP2 interaction. (A) – Primers specific for the MOR PP (S-408 and AS-285), β-actin, and H19 promoter [36] were used to amplify genomic DNA sequences present in each immunoprecipitate by real-time qPCR. Recruitment of MeCP2 to the MOR gene promoter was dramatically increased in the cerebellum (CRB). (B) – Amplification of soluble chromatin before precipitation was used as an input control. Amplification for each antibody was normalized against its input after calculating individual amounts from the real-time qPCR reaction, based on each standard curve (see section ‘Methods and materials’ for details). Parallel controls included ChIP performed without antibody, or non-specific antibody (anti-gal4). (C) – The expression of MeCP2 was assessed by Western blot analysis using MeCP2 antibody in various brain regions, as well as normal (P19), partially (AP2d) and fully differentiated (AP4d) P19 cells. MeCP2 protein levels in neuroblastoma NS20Y cells are also shown. Anti-β-actin was used as a control. Two neuron-specific antibodies (βIII-tubulin and N-cadherin) were used to show the integrity of cells and brain tissues.
The specificity of the antibodies against MeCP2 and the expression levels were shown by Western blotting (Fig. 7C). MeCP2 was expressed differentially in various brain regions (Fig. 7C), with the highest levels in the cerebellum, followed by the olfactory bulb, hypothalamus and posterior cortex; lowest levels of protein expression occurred in the striatum. Because β-actin also showed some degree of differential expression in different brain regions, two neuronal-specific markers (βIII-tubulin and N-cadherin) were used to normalize protein loading. Both proteins were detected at similar densities in all brain regions (Fig. 7C, lanes 1–5). Cells from intermediate (AP2d) and fully differentiated (AP4d) P19 cells also showed expression of the two proteins, whereas little or no expression was seen in NS20Y or undifferentiated P19 cells (lanes 6 and 7).
MOR activation/silencing correlates with histone modifications in brain regions
We examined the possibility that MeCP2 might regulate MOR promoter activation by altering the chromatin architecture of the MOR gene in brain tissue. MeCP2 mediates long-term gene silencing in part by recruiting histone-modifying enzymes such as deacetylases and methyltransferases [8, 13, 15]. ChIP analyses with real-time qPCR revealed that a MOR promoter-associated histone (H3) in the primer PP region (overlapping the PP) was methylated at lysine 9 (H3dmK9; Fig. 7B) in the olfactory bulb and cerebellum. This modification on the H19 gene correlates with gene inactivation [37] and is facilitated by MeCP2 [15]. Furthermore, ChIP analyses of the MOR promoter sequence showed reduced methylation of H3dmK9 in the striatum and hypothalamus, and concurrent increases in dimethylation at lysine 4 (H3dmK4), except in the olfactory bulb. This suggests a significant increase in repressive transcription [38] in the promoter, consistent with the increased MeCP2 in the MOR promoter from the cerebellum. These results suggest that histone code, in a repressive or active state, is established at the PP in brain regions with repressed or active MOR expression.
To further characterize the histone modifications, we repeated the ChIP experiments using antibodies for acetylated histone H3 and acetylated histone H4. Chromatin from brain regions immunoprecipitated with serum against acetylated histone H3 displayed little differential enrichment in the MOR promoter (Fig. 7B). However, the lowest levels of acetylated histone H3 occurred in the cerebellum. Acetylated histone H4 was detected at highest levels in the hypothalamus (consistent with this region expressing more PP-MOR transcript than other regions; Figs 4A and 5B). This suggests that for MOR activation in brain, histones H3 and H4 must be hyperacetylated and H4 hyperacetylation is differentially and uniquely localized to specific brain regions (Fig. 7B).
MeCP2 interacts with chromatin remodelling factor Brg1 and is involved in epigenetic programming of the MOR gene
Because different interactions with MeCP2 and chromatin modifications were observed in different brain regions, we sought to determine if these correlated with the dissociation or association of chromatin-remodelling factors such as Brg1 or Brahma (Brm) (Fig. 8). Interaction of MeCP2 with Brm with respect to transcriptional silencing remains controversial [23]. We used Brm antibody to coimmunoprecipitate MeCP2 protein from mouse whole brain. MeCP2 was not detected in Brm-precipitated samples relative to input (i.e. pre-precipitation samples) or supernatant (SN) controls (Fig. 8A). Likewise, when MeCP2 antibody was used for immunoprecipitation, the Brm band was not detected on Western blots, relative to input or SN controls. MeCP2 interacts with the transcriptional repressor mSin3A for transcriptional silencing [13]. As a control, the MeCP2 antibody was able to successfully pull down the mSin3A protein (Fig. 8A). Surprisingly, Brg1 (another component of the ATPase subunits of the mammalian SWI/SNF complex) was associated with MeCP2 protein (Fig. 8A) as both full-length Brg1 and its isoforms, although the isoforms showed weaker interactions. Indeed, Western blots performed with the same Brg1 antibody as that used in the coimmunoprecipitation experiments showed Brg1 expression in different cells and mouse brain (Fig. 8B). Taken together, these results indicate that the MeCP2 repressor complex is associated with Brg1 rather than Brm, possibly because of a higher binding affinity for Brg1.
Figure 8.
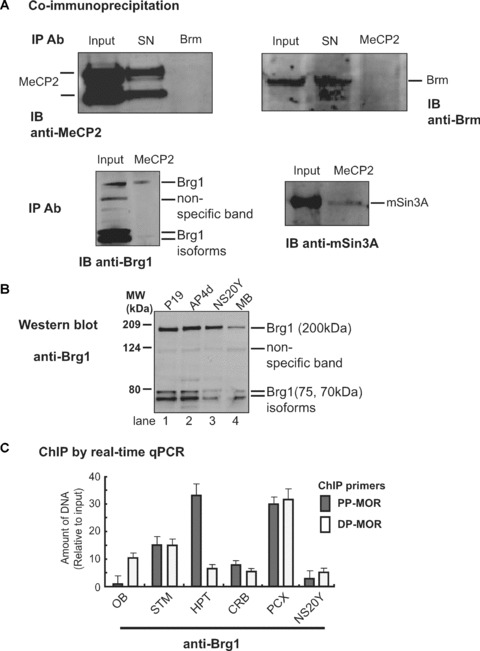
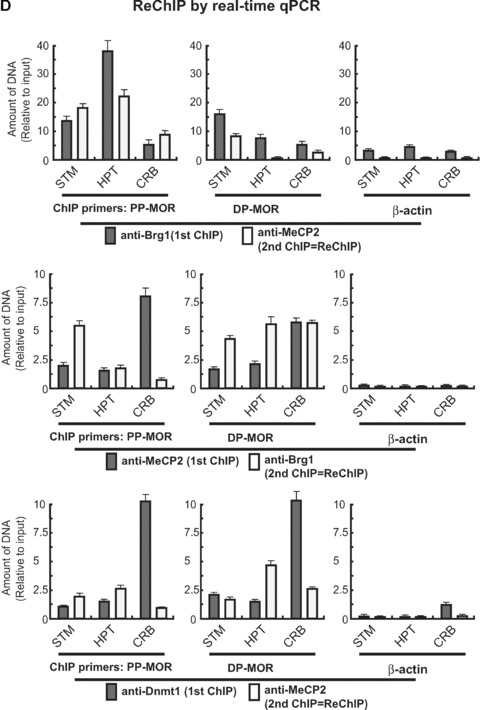
Interaction of MeCP2 with the chromatin-remodelling factor, Brg1. (A) – Antibody against Brm was used to immunoprecipitate and visualize the interaction with MeCP2 (detected with anti-MeCP2 antibody in the Western blot) in mouse brain nuclear extracts. Conversely, MeCP2 antibody was used to detect interactions with Brm (detected with anti-Brm antibody in the Western blot). Using MOR-positive differentiated P19 cells (AP4d), MeCP2 antibody was used to immunoprecipitate Brg1 chromatin-remodelling factor. The interaction of MeCP2 with corepressor was also analysed using mSin3A to validate the coimmunoprecipitation. SN: protein supernatant after immunoprecipitation; IP Ab: immunoprecipitation antibody; IB Ab: immunoblotting antibody. (B) – The expression of Brg1 was assessed by Western blot analysis using anti-Brg1 antibody in different cell types/conditions and mouse brain (MB). Brg1 proteins are indicated with their molecular weights: full-length (200 kD); isoforms (75 and 70 kD), consistent with Upstate antibody information for anti-Brg1 (Upstate, 07–478). (C) – ChIP analysis by real-time qPCR of Brg1 interaction. Primers specific for PP-MOR (S-408 and AS-285; Table 1) and DP-MOR (S-731 and AS-623) [36] were used to amplify by real-time qPCR genomic DNA sequences immunoprecipitated with anti-Brg1 antibody. Five brain regions (OB, STM, HPT, CRB, and PCX) and NS20Y cells were used for the ChIP analysis. (D) – ReChIP analysis by real-time qPCR. The primers specific for PP-MOR, DP-MOR, and β-actin were the same as those used above. Three brain tissues, STM (i.e. a site of intermediate MOR expression), HPT (a high MOR site), and CRB (a non-MOR expressing site) were used for the ReChIP. Data are normalized against the input and are the mean ± S.E.M. from three independent experiments. (Top panel) first antibody: anti-Brg1, second antibody: anti-MeCP2. (Centre panel) First antibody: anti-MeCP2, second antibody: anti-Brg1. (Bottom panel) first antibody: anti-Dnmt1, second antibody: anti-MeCP2.
Using the Brg1 antibody, ChIP analyses assisted with real-time qPCR were performed with dissected brain samples and NS20Y cells to show the effect of endogenous Brg1 on MOR promoter (Fig. 8C). For the PP-MOR region, enhanced interactions with Brg1 were observed in the hypothalamus and posterior cortex, and somewhat less so in the striatum. Lower levels of Brg1 interaction occurred in the cerebellum and olfactory bulb, and NS20Y cells. The enhanced Brg1 interaction on the PP-MOR region from the hypothalamus and striatum correlated with the high levels of PP-MOR expression (Fig. 4A). Likewise, the lower expression of PP-MOR in the olfactory bulb and cerebellum correlated with the decreased Brg1 interaction in the PP-MOR. These data suggest that the chromatin-remodelling factor Brg1 might be involved in PP-MOR activation in brain tissue in vivo. In contrast, there appeared to be no correlation between Brg1 interaction and DP-MOR expression in the tissues tested (Figs. 5B and 8C).
As described above, MeCP2 interacts with Brg1, and the Brg1 was localized to PP-MOR derived from the hypothalamus and striatum containing enhanced MOR expression and hypomethylated PP-MOR promoter. However, the MeCP2 interactions on the PP-MOR from these two regions were very low compared to cerebellum tissue. To resolve this apparent contradiction, we performed ReChIP experiments using antibodies against Brg1 and MeCP2. When PP-MOR was used as the primer, anti-Brg1 as the first antibody and anti-MeCP2 as the second antibody, the high levels of Brg1 interaction in the hypothalamus did not coincide with similar levels of MeCP2 interaction, even though MeCP2 levels in the hypothalamus were slightly higher than those in other tissues (Fig. 8D). Likewise, when the MeCP2 antibody was used first, followed by anti-Brg1, the high levels of MeCP2 seen in the PP-MOR from the cerebellum also did not coincide with the Brg1 interaction. However, Brg1 interaction with PP-MOR in samples precipitated first with anti-MeCP2 was apparently increased in the striatum. Similar assays performed with DP-MOR produced somewhat different, but inconclusive, results. ChIP primers for β-actin used as negative control showed very low interactions with both Brg1 and MeCP2 protein.
Previously, MeCP2 was shown to interact with the DNA methyltransferase, Dnmt1 [16], suggesting that Dnmt1 associates with MeCP2 to perform maintenance methylation in vivo. We performed ReChIP on specific regions of the mouse brain using Dnmt1 antibody followed by MeCP2 antibody (Fig. 8D). Dnmt1 was detected at high levels in the PP-MOR from the cerebellum (as compared to the striatum and hypothalamus), but this did not coincide with MeCP2 interaction. Similar results were observed with DP-MOR.
Based on the results of our studies, we propose the following epigenetic programmed mechanism for the MOR gene (Fig. 9): In specific regions of the brain, the methylation status of the PP results in increased or decreased association of MeCP2 with the MOR gene. This might allow the assembly or disassembly of a transcription repressor complex (assisted by a chromatin-remodelling factor, Brg1), through the deacetylation/acetylation or methylation of specific histone residues, to silence or activate MOR transcription.
Figure 9.
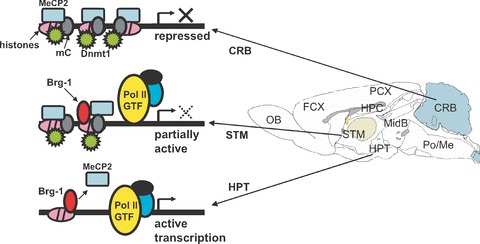
A proposed molecular mechanism for MOR gene regulation. MeCP2 and Dnmt1 bind to hypermethylated DNA form a histone-associated repressor complex, silencing the MOR gene in cerebellar tissue. In the cerebellum, hypermethylation of CpGs around the proximal promoter (PP) coincides with increased interactions with MeCP2 and Dnmt1. This might lead to compaction of the chromatin structure after histone modifications, followed by silencing of the MOR gene in these cells. In striatal cells, intermediate methylation of CpGs around the PP begins as MeCP2 start to dissociate and Brg1 is recruited, concurrent with histone modifications, resulting in intermediate levels of MOR expression. In the hypothalamus, nearly complete demethylation of the CpGs around the PP is observed as MeCP2 dissociates and Brg1 is recruited. Hyperacetylation of histones also occur in the promoter, suggesting active transcription of the MOR gene in the hypothalamic tissue. The components for active transcription shown in the figure, i.e. GTF (general transcription factors) and their associated-RNA polymerase II (Pol II), are putative factors for general genes.
Discussion
The MOR is expressed at different levels in different regions of the brain. Areas showing high levels of expression correlate well with regions identified as having opioid pharmacological pathways. Although MOR distribution in the brain (at the levels of mRNA expression and opioid-ligand binding) has been the subject of numerous reports (reviewed in [3]), the details of the mechanisms regulating the MOR gene in the brain at the RNA and protein levels in vivo remain to be determined. The MOR in specific brain regions can be altered by several psychostimulants or by social stress [39–44]. We have reported recently that the regulation of the MOR gene in mouse embryonal carcinoma P19 cells is controlled by epigenetic events, such as DNA methylation and chromatin modifications in the MOR promoter [25]. To achieve its unique, region-specific expression pattern, the modulation of MOR expression in the brain must be strictly regulated. In the present study, we show the epigenetic regulation of MOR in vivo in various regions of the mouse brain.
To achieve our objectives, we used a simplified epigenetic study method to determine DNA methylation status. Previously [25], we used a sodium bisulphite-assisted DNA sequencing method for DNA methylation analysis. This method is very accurate and consistent, but only with limited numbers of samples; otherwise it is very tedious and costly. Because we were examining several locations in the mouse brain, we tried to find a neuronal cell line that did not express the MOR gene and that was hypermethylated on the MOR promoter.
Hypermethylation of the two MOR promoters was observed in mouse neuroblastoma NS20Y cells, even in the region downstream from the TIS region of the MOR PP (Fig. 1). The downstream TIS region has always been shown to have very low levels of methylation in P19 cells and the mouse brain. When the demethylating agent 5-aza-dC was used in NS20Y cells (Fig. 2), two transcripts of MOR (PP- and DP-MORs) were induced in a concentration-dependent manner, similar to the MOR induction observed in P19 cells [25]. In contrast, the HDAC inhibitor TSA required a concentration of 300 nM to induce the MOR gene in NS20Y cells treated for 24 hrs, although as little as 5 nM TSA induced MOR in P19 cells within 6 hrs. It is possible that higher levels of TSA are required to induce MOR gene expression in NS20Y cells because hypermethylation of the downstream TIS in these cells could prevent MOR gene induction. Basal levels of MOR transcripts are quite different between P19 and NS20Y cells (Fig. 1A), and more so in the case of the PP-MOR than the DP-MOR. In both cell types, basal levels are significantly less than in MOR+ cells or tissues, such as differentiated P19 cells and mouse brain. Again, the lower levels of PP-MOR transcript in NS20Y cells might be the result of the high methylation of the downstream TIS region.
Several studies on MOR gene expression in animal brains at the RNA (e.g. in situ hybridization) or protein (e.g. opioid ligand-binding assay) levels have been reported (reviewed in [45]). Most have focused on the PP-MOR transcript and its protein in rats; the distribution of the DP-MOR in mouse brain has never been studied. Therefore, we examined both DP- and PP-MOR expression in specific, microdissected regions of the mouse brain using RT-PCR and real-time qRT-PCR (Fig. 4). To eliminate PCR artefacts that might be generated by single PCR primer set usage, two primer sets were included in RT-PCR analyses. Also, to reduce cross-contamination between the dissected regions and confirm the results of the PCR experiments, microdissected brain regions were prepared using LCM (Fig. 5). We found differential expression patterns between DP- and PP-MOR transcripts in certain regions, such as cerebellum, olfactory bulb, frontal cortex and posterior cortex. The differential distribution of DP-MOR in specific brain regions suggests that DP-MOR plays a role in the brain; this remains a subject for further investigation.
The presence of multiple promoters regulating a single gene presumably provides greater flexibility and diversity in transcriptional responses to various developmental events or to stimulation by certain agents. We previously reported different expression rates for the two MOR transcripts derived from PP or DP (20:1) in mouse whole brain [46]; these differences were confirmed in the present study (Fig. 1A). Although the in vivo levels of PP-derived transcripts are much higher than those of transcripts derived from the DP, it is possible that the translation efficiency of the two transcripts is also different, as reported recently [28]. In that study, the PP-derived mRNA was not sufficiently translated because of several upstream open reading frames located upstream of main coding open reading frame [28]. The presence of these upstream sequences caused stalling of translational initiation complexes before their binding on the main AUG start codon, resulting in inhibition of main MOR translation. However, the inhibitory effect of the upstream open reading frames was not observed in mRNA derived from the DP (data not shown). Theoretically, these two transcripts would generate the same-sized protein product, but the major transcript (i.e. the PP-derived transcript) might not be being translated efficiently in vivo. Additional studies will be required to resolve this issue. Also, the two transcripts had very distinct expression profiles in brain (Fig. 5B), suggesting that they might have differential regulatory roles in specific brain regions.
We also attempted to show the involvement of epigenetic programming (e.g. DNA methylation and chromatin modifications) for differential expression of MOR in various brain regions. DNA methylation analysis using the RE-assisted methylation-specific PCR was performed on dissected brain samples (Fig. 6). Higher levels of DNA methylation, especially at the –569 site, were observed in regions expressing low levels of PP-MOR, such as cerebellum, frontal cortex, posterior cortex and hippocampus, although there were some exceptions (e.g. olfactory bulb). However, in the DP-MOR, hypermethylation of the CpG sites was retained throughout the tested regions (>60%) with little or no significant differences between brain regions (Fig. 6). These data suggest that in the mouse brain, the expression of PP-MOR might be controlled by DNA methylation and its associated mechanisms at the PP- promoter, but that this is not the case for the DP-MOR.
Higher levels of histone acetylation on H3 and H4 were observed in the hypothalamus, which expressed higher levels of MOR than did four other tested regions (Fig. 7). The only notable anomaly was the highly acetylated H3 in the posterior cortex, in which low levels of the MOR gene were expressed. Using antibodies against dimethyl K9 histone H3 as a means of detecting transcriptional repression, we found that histone H3 was very highly dimethylated at lysine 9 in the olfactory bulb, cerebellum and posterior cortex (in which low levels of MOR were expressed). Conversely, the dimethylation of histone H3 at lysine 4 (an indicator of transcriptional activation), showed no significant differences. Interestingly, the higher methylation in certain regions (e.g. cerebellum, olfactory bulb and posterior cortex) correlated with higher levels of interaction with the DNA methyl-binding protein MeCP2 (Fig. 7A). In our previous report [25], we observed the involvement of MeCP2 protein in MOR gene repression in P19 and its differentiated cells; in those cases, MeCP2 binding to promoter DNA was CpG-DNA-methylation-dependent. In the present study using in vivo brain samples, MeCP2 also appears to be involved in the regulation of the MOR gene, especially through the PP region, just as in the in vitro cell line.
One research group [22] recently reported that MeCP2 interacted with an ATP-dependent chromatin-remodelling factor (Brm), but a later report presented contradictory results [23]. In coimmunoprecipitation experiments (Fig. 8A), we could not detect any interaction of MeCP2 with Brm, although we did detect MeCP2 interaction with Brg1, another chromatin-remodelling factor. Presently, our results are not enough to conclude definitively whether MeCP2 interacts with either Brm or Brg1. Confirming such potential interactions using a specific tagged MeCP2 construct with either Brm or Brg1 is the subject of future investigations. Nevertheless, ChIP and ReChIP experiments using anti-Brg1 and anti-MeCP2 antibodies in specific brain regions (Fig. 8) showed more interaction of Brg1 with PP-MOR in tissues expressing higher levels of MOR, whereas decreased Brg1 interaction was seen in tissues expressing less MOR; the posterior cortex appears to be the exception to this.
It is worth noting that the potential associations between Brg1 and MeCP2 could be region specific. ReChIP experiments showed high levels of Brg1 but low levels of MeCP2 in the hypothalamus. Conversely, high levels of MeCP2 on PP-MOR from the cerebellum coincided with low Brg1 interaction. However, Brg1 interaction with the PP-MOR increased after MeCP2 ChIP in the striatum. It is therefore possible that MeCP2 and Brg1 could function independently in some regions where MOR is not expressed (e.g. cerebellum) or expressed at high levels (hypothalamus), but in regions where the MOR is only partially active (striatum), they act cooperatively (Fig. 9).
In summary, hypermethylation at CpG sites of MOR promoters was observed in MOR-negative neuroblastoma NS20Y cells. Demethylation of these CpGs and histone deacetylation by demethylating agents and HDAC inhibitors could induce the MOR gene in these cells, suggesting epigenetic controls for the MOR gene. Using the NS20Y cells, we developed a simpler methylation analysis method (RE-assisted methylation-specific PCR product analysis) and validated the method by authentic DNA sequencing analysis. Using this method, the degree of methylation of DNA in the MOR promoters was revealed in vivo using microdissected brain samples, and compared to the region-specific expression patterns of the MOR gene in the dissected brain regions. The methylation levels of DNA in different brain regions correlated closely with MeCP2 interactions on the promoters, as well as chromatin modifications. We also found MeCP2 interaction with the chromatin-remodelling factor Brg1. MeCP2 functions with Brg1 either independently or cooperatively in a tissue-specific manner. Taken together, these data show that transcriptional regulation of the MOR gene can be controlled by epigenetic programming (both in vitro and in vivo) through MeCP2 interaction and subsequent remodelling and/or modifications of the chromatin structures around the MOR promoter regions.
Acknowledgments
This work was supported by NIH Grants DA000564, DA001583, DA011806, K05-DA070554 (H.H.L.), DA011190 and DA013926 (L.W.), and by the A&F Stark Fund of the Minnesota Medical Foundation. We thank Dr. Weidong Wang (NIH) for kindly providing MeCP2 antibody. We also thank Dr. Martin Winer for editorial assistance with the manuscript and Dr. Hui Zhao for preparing microdissected brain samples.
Supporting Information
Supplementary Figure 1. Methylation analysis of thedistal MOR promoter by methylation-sensitive restriction enzymeassay. (A). Schematic representation of the distal MORpromoter, its flanking regions and CpG sites. The predicted sizesof the MSP product (Full) and the two ClaI-digested fragments areshown below. (B). Changes in the methylation status of the -1601 CpG site of the distal MOR promoter in NS20Y cells after treatment with 5-aza-dC. Methylation-specific PCR products were amplified using the primers MS-1754 and MAS-927 (25). Quantification of demethylation in the MOR promoter is shown as a bar graph below the gel. The CpG site -1601 (recognized by ClaI) in the upstream region of the distal promoter was also demethylated by 5-aza-dC, coincident with increased DP-MOR expression (see Fig. 2).
Please note: Wiley-Blackwell are not responsible for the content or functionality of any supporting materials supplied by the authors. Any queries (other than missing material) should be directed to the corresponding author for the article.
Supporting info item
Supporting info item
References
- 1.Law PY, Wong YH, Loh HH. Molecular mechanisms and regulation of opioid receptor signaling. Annu Rev Pharmacol Toxicol. 2000;40:389–430. doi: 10.1146/annurev.pharmtox.40.1.389. [DOI] [PubMed] [Google Scholar]
- 2.Kieffer BL, Evans CJ. Opioid tolerance-in search of the holy grail. Cell. 2002;108:587–90. doi: 10.1016/s0092-8674(02)00666-9. [DOI] [PubMed] [Google Scholar]
- 3.Mansour A, Fox CA, Akil H, et al. Opioid-receptor mRNA expression in the rat CNS: anatomical and functional implications. Trends Neurosci. 1995;18:22–9. doi: 10.1016/0166-2236(95)93946-u. [DOI] [PubMed] [Google Scholar]
- 4.Gruenbaum Y, Stein R, Cedar H, et al. Methylation of CpG sequences in eukaryotic DNA. FEBS Lett. 1981;124:67–71. doi: 10.1016/0014-5793(81)80055-5. [DOI] [PubMed] [Google Scholar]
- 5.Shiota K, Kogo Y, Ohgane J, et al. Epigenetic marks by DNA methylation specific to stem, germ and somatic cells in mice. Genes Cells. 2002;7:961–9. doi: 10.1046/j.1365-2443.2002.00574.x. [DOI] [PubMed] [Google Scholar]
- 6.Li E, Bestor TH, Jaenisch R. Targeted mutation of the DNA methyltransferase gene results in embryonic lethality. Cell. 1992;69:915–26. doi: 10.1016/0092-8674(92)90611-f. [DOI] [PubMed] [Google Scholar]
- 7.Berger SL. An embarrassment of niches: the many covalent modifications of histones in transcriptional regulation. Oncogene. 2001;20:3007–13. doi: 10.1038/sj.onc.1204324. [DOI] [PubMed] [Google Scholar]
- 8.Jones PL, Veenstra GJ, Wade PA, et al. Methylated DNA and MeCP2 recruit histone deacetylase to repress transcription. Nat Genet. 1998;19:187–91. doi: 10.1038/561. [DOI] [PubMed] [Google Scholar]
- 9.Martinowich K, Hattori D, Wu H, et al. DNA methylation-related chromatin remodeling in activity-dependent BDNF gene regulation. Science. 2003;302:890–3. doi: 10.1126/science.1090842. [DOI] [PubMed] [Google Scholar]
- 10.Hsieh CL. Dependence of transcriptional repression on CpG methylation density. Mol Cell Biol. 1994;14:5487–94. doi: 10.1128/mcb.14.8.5487. [DOI] [PMC free article] [PubMed] [Google Scholar]
- 11.Hagberg B, Aicardi J, Dias K, et al. A progressive syndrome of autism, dementia, ataxia, and loss of purposeful hand use in girls: Rett’s syndrome: report of 35 cases. Ann Neurol. 1983;14:471–9. doi: 10.1002/ana.410140412. [DOI] [PubMed] [Google Scholar]
- 12.Amir RE, Van den Veyver IB, Wan M, et al. Rett syndrome is caused by mutations in X-linked MECP2, encoding methyl-CpG-binding protein 2. Nat Genet. 1999;23:185–8. doi: 10.1038/13810. [DOI] [PubMed] [Google Scholar]
- 13.Nan X, Ng HH, Johnson CA, et al. Transcriptional repression by the methyl-CpG-binding protein MeCP2 involves a histone deacetylase complex. Nature. 1998;393:386–9. doi: 10.1038/30764. [DOI] [PubMed] [Google Scholar]
- 14.Bird AP, Wolffe AP. Methylation-induced repression–belts, braces, and chromatin. Cell. 1999;99:451–4. doi: 10.1016/s0092-8674(00)81532-9. [DOI] [PubMed] [Google Scholar]
- 15.Fuks F, Hurd PJ, Wolf D, et al. The methyl-CpG-binding protein MeCP2 links DNA methylation to histone methylation. J Biol Chem. 2003;278:4035–40. doi: 10.1074/jbc.M210256200. [DOI] [PubMed] [Google Scholar]
- 16.Kimura H, Shiota K. Methyl-CpG-binding protein, MeCP2, is a target molecule for maintenance DNA methyltransferase, Dnmt1. J Biol Chem. 2003;278:4806–12. doi: 10.1074/jbc.M209923200. [DOI] [PubMed] [Google Scholar]
- 17.Becker PB, Horz W. ATP-dependent nucleosome remodeling. Annu Rev Biochem. 2002;71:247–73. doi: 10.1146/annurev.biochem.71.110601.135400. [DOI] [PubMed] [Google Scholar]
- 18.Lusser A, Kadonaga JT. Chromatin remodeling by ATP-dependent molecular machines. Bioessays. 2003;25:1192–200. doi: 10.1002/bies.10359. [DOI] [PubMed] [Google Scholar]
- 19.Narlikar GJ, Fan HY, Kingston RE. Cooperation between complexes that regulate chromatin structure and transcription. Cell. 2002;108:475–87. doi: 10.1016/s0092-8674(02)00654-2. [DOI] [PubMed] [Google Scholar]
- 20.Peterson CL, Workman JL. Promoter targeting and chromatin remodeling by the SWI/SNF complex. Curr Opin Genet Dev. 2000;10:187–92. doi: 10.1016/s0959-437x(00)00068-x. [DOI] [PubMed] [Google Scholar]
- 21.Wang W, Cote J, Xue Y, et al. Purification and biochemical heterogeneity of the mammalian SWI-SNF complex. EMBO J. 1996;15:5370–82. [PMC free article] [PubMed] [Google Scholar]
- 22.Harikrishnan KN, Chow MZ, Baker EK, et al. Brahma links the SWI/SNF chromatin-remodeling complex with MeCP2-dependent transcriptional silencing. Nat Genet. 2005;37:254–64. doi: 10.1038/ng1516. [DOI] [PubMed] [Google Scholar]
- 23.Hu K, Nan X, Bird A, et al. Testing for association between MeCP2 and the brahma-associated SWI/SNF chromatin-remodeling complex. Nat Genet. 2006;38:962–4. doi: 10.1038/ng0906-962. author reply 4–7. [DOI] [PubMed] [Google Scholar]
- 24.Chen HC, Wei LN, Loh HH. Expression of mu-, kappa- and delta-opioid receptors in P19 mouse embryonal carcinoma cells. Neuroscience. 1999;92:1143–55. doi: 10.1016/s0306-4522(99)00030-5. [DOI] [PubMed] [Google Scholar]
- 25.Hwang CK, Song KY, Kim CS, et al. Evidence of endogenous mu opioid receptor regulation by epigenetic control of the promoters. Mol Cell Biol. 2007;27:4720–36. doi: 10.1128/MCB.00073-07. [DOI] [PMC free article] [PubMed] [Google Scholar]
- 26.Choi HS, Hwang CK, Kim CS, et al. Transcriptional regulation of mouse mu opioid receptor gene: Sp3 isoforms (M1, M2) function as repressors in neuronal cells to regulate the mu opioid receptor gene. Mol Pharmacol. 2005;67:1674–83. doi: 10.1124/mol.104.008284. [DOI] [PubMed] [Google Scholar]
- 27.Paterno GD, Gillespie LL, Julien JP, et al. Regulation of neurofilament L, M and H gene expression during retinoic acid-induced neural differentiation of P19 embryonal carcinoma cells. Brain Res Mol Brain Res. 1997;49:247–54. doi: 10.1016/s0169-328x(97)00157-5. [DOI] [PubMed] [Google Scholar]
- 28.Song KY, Hwang CK, Kim CS, et al. Translational repression of mouse mu opioid receptor expression via leaky scanning. Nucleic Acids Res. 2007;35:1501–13. doi: 10.1093/nar/gkm034. [DOI] [PMC free article] [PubMed] [Google Scholar]
- 29.Gilsbach R, Kouta M, Bonisch H, et al. Comparison of in vitro and in vivo reference genes for internal standardization of real-time PCR data. Biotechniques. 2006;40:173–7. doi: 10.2144/000112052. [DOI] [PubMed] [Google Scholar]
- 30.Pfaffl MW. A new mathematical model for relative quantification in real-time RT-PCR. Nucleic Acids Res. 2001;29:e45. doi: 10.1093/nar/29.9.e45. [DOI] [PMC free article] [PubMed] [Google Scholar]
- 31.Yamasaki K, Joh K, Ohta T, et al. Neurons but not glial cells show reciprocal imprinting of sense and antisense transcripts of Ube3a. Hum Mol Genet. 2003;12:837–47. doi: 10.1093/hmg/ddg106. [DOI] [PubMed] [Google Scholar]
- 32.Kim CS, Choi HS, Hwang CK, et al. Evidence of the neuron-restrictive silencer factor (NRSF) interaction with Sp3 and its synergic repression to the mu opioid receptor (MOR) gene. Nucleic Acids Res. 2006;34:6392–403. doi: 10.1093/nar/gkl724. [DOI] [PMC free article] [PubMed] [Google Scholar]
- 33.Hwang CK, Kim CS, Choi HS, et al. Transcriptional regulation of mouse mu opioid receptor gene by PU.1. J Biol Chem. 2004;279:19764–74. doi: 10.1074/jbc.M400755200. [DOI] [PubMed] [Google Scholar]
- 34.Kim CS, Hwang CK, Choi HS, et al. Neuron-restrictive silencer factor (NRSF) functions as a repressor in neuronal cells to regulate the mu opioid receptor gene. J Biol Chem. 2004;279:46464–73. doi: 10.1074/jbc.M403633200. [DOI] [PubMed] [Google Scholar]
- 35.Bird A. DNA methylation patterns and epigenetic memory. Genes Dev. 2002;16:6–21. doi: 10.1101/gad.947102. [DOI] [PubMed] [Google Scholar]
- 36.Drewell RA, Goddard CJ, Thomas JO, et al. Methylation-dependent silencing at the H19 imprinting control region by MeCP2. Nucleic Acids Res. 2002;30:1139–44. doi: 10.1093/nar/30.5.1139. [DOI] [PMC free article] [PubMed] [Google Scholar]
- 37.Lachner M, Jenuwein T. The many faces of histone lysine methylation. Curr Opin Cell Biol. 2002;14:286–98. doi: 10.1016/s0955-0674(02)00335-6. [DOI] [PubMed] [Google Scholar]
- 38.Jenuwein T, Allis CD. Translating the histone code. Science. 2001;293:1074–80. doi: 10.1126/science.1063127. [DOI] [PubMed] [Google Scholar]
- 39.Nikulina EM, Hammer RP, Jr, Miczek KA, et al. Social defeat stress increases expression of mu-opioid receptor mRNA in rat ventral tegmental area. Neuroreport. 1999;10:3015–9. doi: 10.1097/00001756-199909290-00026. [DOI] [PubMed] [Google Scholar]
- 40.Nikulina EM, Miczek KA, Hammer RP., Jr Prolonged effects of repeated social defeat stress on mRNA expression and function of mu-opioid receptors in the ventral tegmental area of rats. Neuropsychopharmacology. 2005;30:1096–103. doi: 10.1038/sj.npp.1300658. [DOI] [PubMed] [Google Scholar]
- 41.Unterwald EM, Horne-King J, Kreek MJ. Chronic cocaine alters brain mu opioid receptors. Brain Res. 1992;584:314–8. doi: 10.1016/0006-8993(92)90912-s. [DOI] [PubMed] [Google Scholar]
- 42.Unterwald EM, Rubenfeld JM, Kreek MJ. Repeated cocaine administration upregulates kappa and mu, but not delta, opioid receptors. Neuroreport. 1994;5:1613–6. doi: 10.1097/00001756-199408150-00018. [DOI] [PubMed] [Google Scholar]
- 43.Unterwald EM. Regulation of opioid receptors by cocaine. Ann N Y Acad Sci. 2001;937:74–92. doi: 10.1111/j.1749-6632.2001.tb03559.x. [DOI] [PubMed] [Google Scholar]
- 44.Vecchiola A, Collyer P, Figueroa R, et al. Differential regulation of mu-opioid receptor mRNA in the nucleus accumbens shell and core accompanying amphetamine behavioral sensitization. Brain Res Mol Brain Res. 1999;69:1–9. doi: 10.1016/s0169-328x(99)00044-3. [DOI] [PubMed] [Google Scholar]
- 45.Mansour A, Fox CA, Burke S, et al. Immunohistochemical localization of the cloned mu opioid receptor in the rat CNS. J Chem Neuroanat. 1995;8:283–305. doi: 10.1016/0891-0618(95)00055-c. [DOI] [PubMed] [Google Scholar]
- 46.Ko JL, Minnerath SR, Loh HH. Dual promoters of mouse mu-opioid receptor gene. Biochem Biophys Res Commun. 1997;234:351–7. doi: 10.1006/bbrc.1997.6640. [DOI] [PubMed] [Google Scholar]
- 47.Min BH, Augustin LB, Felsheim RF, et al. Genomic structure analysis of promoter sequence of a mouse mu opioid receptor gene. Proc Natl Acad Sci USA. 1994;91:9081–5. doi: 10.1073/pnas.91.19.9081. [DOI] [PMC free article] [PubMed] [Google Scholar]
Associated Data
This section collects any data citations, data availability statements, or supplementary materials included in this article.
Supplementary Materials
Supporting info item
Supporting info item