Abstract
DNA methyltransferase inhibitors (MTIs) have recently emerged as promising chemotherapeutic or preventive agents for cancer, despite their poorly characterized mechanisms of action. The present study shows that DNA methylation is integral to the regulation of SH2-containing protein tyrosine phosphatase 1 (SHP1) expression, but not for regulation of suppressors of cytokine signalling (SOCS)1 or SOCS3 in colorectal cancer (CRC) cells. SHP1 expression correlates with down-regulation of Janus kinase/signal transducers and activators of transcription (JAK2/STAT3/STAT5) signalling, which is mediated in part by tyrosine dephosphorylation events and modulation of the proteasome pathway. Up-regulation of SHP1 expression was achieved using a DNA MTI, 5-aza-2′-deoxycytidine (5-aza-dc), which also generated significant down-regulation of JAK2/STAT3/STAT5 signalling. We demonstrate that 5-aza-dc suppresses growth of CRC cells, and induces G2 cell cycle arrest and apoptosis through regulation of downstream targets of JAK2/STAT3/STAT5 signalling including Bcl-2, p16ink4a, p21waf1/cip1 and p27kip1. Although 5-aza-dc did not significantly inhibit cell invasion, 5-aza-dc did down-regulate expression of focal adhesion kinase and vascular endothelial growth factor in CRC cells. Our results demonstrate that 5-aza-dc can induce SHP1 expression and inhibit JAK2/STAT3/STAT5 signalling. This study represents the first evidence towards establishing a mechanistic link between inhibition of JAK2/STAT3/STAT5 signalling and the anticancer action of 5-aza-dc in CRC cells that may lead to the use of MTIs as a therapeutic intervention for human colorectal cancer.
Keywords: colorectal cancer, DNA methylation, JAK2/STAT3/STAT5 signalling pathway, methyltransferase inhibitors
Introduction
Colorectal cancer (CRC) is a very common malignancy that has become one of the leading causes of morbidity and death worldwide. Although there have been advances in surgical and chemotherapeutic treatments of CRC, overall patient survival has not significantly improved in recent years. The potential anticancer activities of DNA methyltransferase inhibitors (MTIs) have emerged as promising chemotherapeutic or preventive agents and therefore have undergone extensive study. Based on promising in vivo anti-tumour activity demonstrated by 5-aza-2′-deoxycytidine (5-aza-dc) in preclinical studies, the Food and Drug Administration approved 5-aza-dc for clinical evaluation for its ability to treat myelodysplastic syndromes and chronic myelomonocytic leukaemia [1–7]. Zebularine is another MTI that has been shown to demonstrate significant anti-proliferative effects against ovarian cancer cell lines; it appears to be a promising clinical candidate for the therapy of drug-resistant ovarian cancer [8].
Signalling from Janus kinase (JAK) and signal transducers and activators of transcription (STAT) proteins have been shown to play a significant role in various biological effects, including immune function, cell growth, differentiation and hematopoiesis [9]. During the past few years, accumulating evidence has also identified consequences of dysregulation of JAK/STAT signalling, particularly in regard to JAK2/STAT3/STAT5 signalling that has been shown to have roles in the oncogenesis of several cell types [10–14]. In CRC cells, constitutive activation of JAK/STAT signalling has been shown to contribute to the initiation and progression of CRC tumorigenesis through the up-regulation of a number of proteins that mediate anti-apoptotic effects or cell cycle progression [15–18]. Based on these roles for JAK/STAT signalling, it is suggested that targeting JAK/STAT proteins may represent a valuable therapeutic strategy for cancer therapy. Proteins that regulate JAK/STAT signalling may also have a role. The SH2-containing protein tyrosine phosphatase 1 (SHP1) protein and the suppressors of cytokine signalling (SOCS) family of proteins have been identified as important negative regulators in cytokine-mediated signal transduction as well in the JAK/STAT signalling pathway [19–21]. Correspondingly, it is has been suggested that loss of SHP1 or SOCSs may contribute to the activation of JAK or STAT proteins in cancer [9, 20, 22–25]. Based on experiments that show restoration of SHP1 or SOCSs expression suppresses cancer cell growth [19, 24, 26], SHP1, SOCS1 and SOCS3 have been reported to have tumour suppressor functions [25–29]. Previous studies have also suggested that SHP1 and SOCSs are silenced by aberrant methylation of their CpG islands. For example, Chim and coworkers detected hypermethylation in SOCS1 and SHP1 in multiple myeloma [20], and SOCS3 hypermethylation was reported in human lung cancer [24]. These data suggest that demethylating agents may be useful in the treatment of cancer [19, 23].
In this study, we investigated whether regulation of SHP1 and SOCSs in CRC cells is the result of epigenetic modifications. We suggested that loss of SHP1 or SOCSs expression leads to constitutive activation of the JAK/STAT signalling pathway in CRC cells and represents a target for treatment of human CRC. We treated CRC cells with the MTI, 5-aza-dc and analysed changes in JAK2/STAT3/STAT5 signalling. Our findings identify a mechanism by which the therapeutic effects of 5-aza-dc are mediated in human CRC.
Materials and methods
Cell culture and pharmacologic agents
Two human CRC cell lines, SW1116 and HT29, were used in this study and cultured in RPMI 1640 medium (Gibco, Carlsbad, CA, USA) and McCoy’s 5A medium (Sigma, St. Louis, MO, USA), respectively. Both media were supplemented with 10% foetal bovine serum and maintained at 37°C in a humidified 5% CO2 atmosphere.
The DNA MTI, 5-aza-2′-deoxycytidine (5-aza-dc) (Sigma-Aldrich, St. Louis, MO, USA), was dissolved in acetic acid and stored at –20°C until used. Final concentrations of 5-aza-dc used throughout this study included 0, 1 and 5 μM, and 5-aza-dc in fresh medium was added to cell cultures daily to maintain the concentration needed. MG132, a pharmacological proteasome inhibitor, was dissolved in dimethyl sulfoxide and stored at –20°C. At the time of the experiment, an aliquot of MG132 was thawed and diluted with tissue culture media to a final concentration of 10 μM.
Quantitative real-time PCR assays to detect SOCS1, SOCS3, SHP1, JAK2, STAT3 and STAT5
Quantitative PCR was performed using FastStart SYBR Green Master (Roche, Mannheim, Germany) in the Prism 7900HT sequence detection system (Applied Biosystems, Foster City, CA, USA). The real-time PCR primers used for each gene are as follows: for SOCS1, 5′-GACCTGAACTCGCACCTCCTA-3′ (forward), 5′-CCCCCAACCCCTGGTTT-3′ (reverse); for SOCS3, 5′-GACCAGCGCCACTTCTTCTTCAC-3′ (forward), 5′-CTGGATGCGCAGGTTCTTG -3′ (reverse); for SHP1, 5′-CAGCACTTGGCTC CTTAGGAA-3′ (forward), 5′-CCAAACCAAGGAAGTCCAATG -3′ (reverse); for JAK2, 5′-GATGAGAATAGCCAAAGAAAACG-3′ (forward), 5′-TTGCTGAATAA ATCTGCGAAAT-3′ (reverse); for STAT3, 5′-GCTTTTGTCAGCGATGGAGT-3′ (forward), 5′-ATTTGTTGACGGGTCTGAAGTT-3′ (reverse); for STAT5a, 5′-AATGAGAACACCCGCAACG-3′ (forward), 5′-TTCCTGAAGTGGGCACTGA G-3′ (reverse); and for STAT5b, 5′-ACTGCTAAAGCTGTTGATGGATAC-3′ (forward), 5′-TGAGTCAGGGTTCTGTGGGTA-3′ (reverse). PCR cycles included steps of 95°C for 10 min., 40 cycles of 95°C for 15 sec. and 60°C for 1 min. Each reaction was performed in triplicate, analysed individually relative to GAPDH (a normalization control) and analysed using the 2−ΔΔCt method [30]. Thereafter, data for transcript expression levels were expressed as fold difference relative to that of untreated control cells.
Bisulphite sequencing of the SHP1, SOCS1 and SOCS3 promoters
DNA was extracted from CRC cells cultured in the absence or presence of 5 μM 5-aza-dc for 96 hrs and then treated with bisulphite as previously described [31]. The primers used for SHP1, SOCS1 and SOCS3, annealing temperatures and expected PCR products sizes are summarized in Table 1. PCR products were gel-extracted (Qiagen, Valencia, CA, USA) and ligated into the TA cloning vector (pMD18-T, Takara, Dalian, China). Plasmid-transformed DH5α bacterial cells were cultured overnight and at least 10 separate clones were selected for isolation of plasmid DNA (Qiagen) and sequence analysis.
Table 1.
Primers and PCR programs for bisulphite sequencing
| Primer (forward) | Primer (reverse) | Annealing temperature | Product size | GenBank accession number | |
|---|---|---|---|---|---|
| SHP1 | AGGGTTGTGGTGAGAAATTAATTAG | TTACACACTCCAAACCCAAATAATAC | 58°C | 222 | NM_002831 |
| SOCS1 | GTTAGGGGTTTTTTTGAAGTTTGT | ATATCCCCAACCCTAAACCTAAC | 57°C | 184 | NM_003745 |
| SOCS3 | TTGGTTGTGGGGTAGTTTTATTTT | CCCTCCCTTCTAAAAAAACTAATTT | 57°C | 183 | NM_003955 |
Plasmid constructs, cell transfection and cell sorting
Full-length SHP1 cDNA was synthesized and cloned into pEGFP-N1 (Clontech, Mountain View, CA, USA). The sequence and orientation of the SHP1 insert was confirmed by DNA sequencing using an ABI 3100 gene sequencer (ABI, San Jose, CA, USA). For transfection, 8 μg of vector were transfected into 2 × 10⁶ cells using Lipofectamine™ 2000 (Invitrogen, Carlsbad, CA, USA) according to the manufacturer’s instruction. All pEGFP-N1- or pEGFP-N1-SHP1-transfected cells used throughout this study were sorted using the EPICS ALTRA (Beckman-Coulter, Mississauga, ON, Canada) to isolate GFP-expressing cells.
Western blot analysis and antibodies
Western blot analysis was performed using standard techniques. Briefly, the cells were lysed in M-PER Reagent (Pierce, Rockford, IL, USA) containing protease inhibitors. Equal amounts of protein (50–200 μg/lane) from whole cell lysates were subjected to SDS-PAGE. Proteins were transferred to nitrocellulose (Amersham, Amersham, UK), probed with specific primary antibodies, and incubated with the appropriate horseradish peroxidase conjugated secondary antibodies (Pierce). Antibody binding was detected using an enhanced chemiluminescence detection kit (SuperSignal West Femto Substrate, Pierce). As a loading control, detection of GAPDH was performed.
Antibodies used in this study were purchased from Cell Signaling Technology (CST, Boston, MA, USA) except for JAK2 (Santa Cruz, CA, USA), Bcl-2 (R&D Systems, Minneapolis, MN, USA) and GAPDH (Kangchen, China). All primary antibodies were used at a 1:1000 dilution.
ELISA analysis of VEGF, MMP-2 and MMP-9
Cells (1 × 10⁵) were cultured in 24-well plates to 90% confluence. Cells were washed three times before the addition of serum-free medium containing 5-aza-dc or an equivalent volume of acetic acid (vehicle control). After 24 hrs, the medium was collected and the concentration of vascular endothelial growth factor (VEGF), matrix metalloproteinases 2 (MMP-2) and matrix MMP-9 were determined using an ELISA kit (R&D Systems) according to the manufacturer’s instruction.
Methylation-specific PCR (MSP) of p27kip1 promoter
DNA was extracted from CRC cells cultured in the absence or presence of 5 μM 5-aza-dc for 72 hrs, and the bisulphite-treated DNA was amplified by MSP. The primers, annealing temperatures and expected PCR products sizes are summarized in Table 2. The PCR product was directly loaded onto 2% agarose gels and electrophoresed, followed by direct visualization under UV illumination.
Table 2.
Primers and PCR programs for p27kip1 MSP
| Primer (forward) | Primer (reverse) | Annealing temperature | Product size | |
|---|---|---|---|---|
| p27kip1 M-MSP | TAGAAAGGGACGAGTTTTTATACGT | AAACACGTTTAATTTTAAAAAACGAA | 56°C | 111 |
| p27kip1 U-MSP | TAGAAAGGGATGAGTTTTTATATGT | AACACATTTAATTTTAAAAAACAAA | 55°C | 110 |
Cell viability assays
Cell viability was assessed using a tetrazolium salt (WST-8)-based colorimetric assay provided by the Cell Counting Kit 8 (CCK-8, Dojindo, Japan) [32, 33]. Briefly, treated and untreated CRC cells (5 × 10³ cells/well) were seeded into 96-well plates. At specific time-points, 10 μl of CCK-8 solution was added to wells and the plates were incubated for 1 hr. Cell viability was determined from absorbance readings at 450 nm. Data are expressed as relative viability (%) calculated from: [A450(treated) – A450(blank)]/[A450 (control) – A450(blank)]× 100%.
Cell cycle analysis
Approximately 1 × 10⁶ cells were removed at specific time-points, washed twice with PBS and fixed in cold ethanol for 30 min. Samples were then incubated with propidium iodide (PI) for 30 min. and analysed by flow cytometry (BD, San Diego, CA, USA).
Detection of apoptosis
Apoptosis was analysed using an annexin-V FITC/PI double-stain assay (performed in accordance with the manufacturer’s protocol) and analysed by flow cytometry (Biovision, Mountain View, CA, USA). Briefly, both floating and trypsinized adherent cells (5 × 10⁵) were collected and resuspended in 500 μl binding buffer containing 5 μl of annexin-V FITC and 5 μl of PI. After 5 min. in the dark at room temperature, samples were subjected to flow cytometry analysis (BD, USA). For detection of caspase-3 activity, cleaved caspase-3 was measured in 100 μg of cell lysate using a PathScan cleaved caspase-3 sandwich ELISA kit (Cell Signaling) and absorbance at 450 nm was measured with a microplate reader.
In vitro invasion assays
Cell invasion assays were performed as described by Hecht et al.[34]. Briefly, 8-μm-pored polycarbonate membranes were coated with Matrigel on the upper side (Becton-Dickinson, San Diego, CA, USA). Cells (1 × 10⁵) in serum-free medium were seeded into the upper chamber and medium supplemented with 10% foetal bovine serum was applied to the lower chamber. After 24 hrs, cells remaining on the upper chamber of the filter were removed with a cotton swab. Cells that had migrated to the bottom surface of the filter were fixed, stained and counted. For a subset of assays, the upper chamber was filled with 5 μM 5-aza-dc or acetic acid (as a vehicle control) at an equivalent volume, respectively.
Statistical analysis
Results were expressed as the mean ± S.D. The data were analysed for significance by ANOVA and results were considered significant if P < 0.05.
Results
5-aza-dc induces restoration of SHP1, but not SOCS1 and SOCS3 in colorectal cancer cells
Western blot analysis was used to establish the protein levels of SHP1 and SOCSs induced by 5-aza-dc in CRC cells. Levels of SHP1 increased with time in both CRC cell lines and the highest levels of SHP1 expression were detected on day 5. In contrast, no detectable changes in the protein levels of SOCS1 and SOCS3 were detected following 5-aza-dc treatment in either the SW1116 or HT29 cell lines (Fig. 1A).
Figure 1.
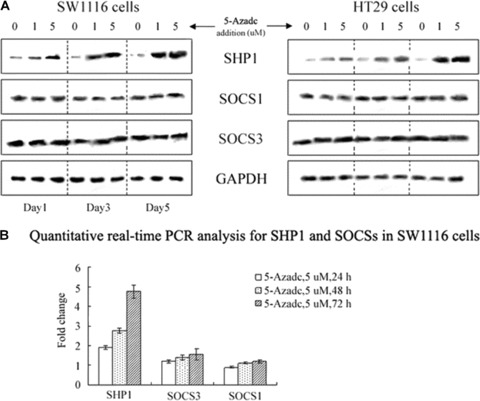
5-aza-dc up-regulates SHP1 expression in colorectal cancer (CRC) cells. (A) Western blot analysis of 5-aza-dc-induced time-dependent increases in SHP1 in CRC cells, whereas SOCS1 and SOCS3 showed no detectable changes. The data presented are from a representative experiment and detection of GAPDH was used as a loading control. (B) Quantitative real-time PCR analysis of SHP1 and SOCSs in SW1116 cells. Results are expressed as relative expression compared with untreated cells. Each value is the mean ± S.D. of three experiments.
To measure mRNA levels, quantitative real-time PCR assays were performed. After 72 hrs of incubation with 5 μM 5-aza-dc, SHP1 mRNA in SW1116 cells was ∼4.73-fold higher than that in untreated SW1116 cells (Fig. 1B). No significant change in SOCS1 and SOCS3 mRNAs were detected. These results were consistent with data from the Western blot analyses and demonstrate that SHP1, but not SOCS1 or SOCS3, is up-regulated in response to 5-aza-dc.
Bisulphite sequencing confirms epigenetic-regulation of SHP1 in CRC cells
We examined the methylation status of the SHP1 and SOCSs promoters using bisulphite sequencing. CpGs of the SHP1 promoter in untreated SW1116 and HT29 cells showed multiple cytosines. However, after cells were treated with 5-aza-dc for 96 hrs, numerous thymidines were detected as a result of the conversion of the unmethylated cytosines to uracil by sodium bisulphite. For example, in HT29 cells treated with 5 μM 5-aza-dc for 96 hrs, one of the 10 individual clones analysed contained 11 demethylated CG pairs within the SHP1 promoter (at positions −330, −314, −310, −289, −273, −265, −236, −203, −195, −185 and −179) (Fig. 2A). For the 10 sequenced clones, the proportion of methylated residues detected ranged from 18.2% (2/11) to 100% (11/11) (Fig. 2B). In contrast, no significant changes in methylation status of the SOCS1 and SOCS3 promoters were detected (Fig. 2B). These findings provide a correlation between hypermethylation of the SHP1 promoter and changes in SHP1 expression in CRC cells.
Figure 2.
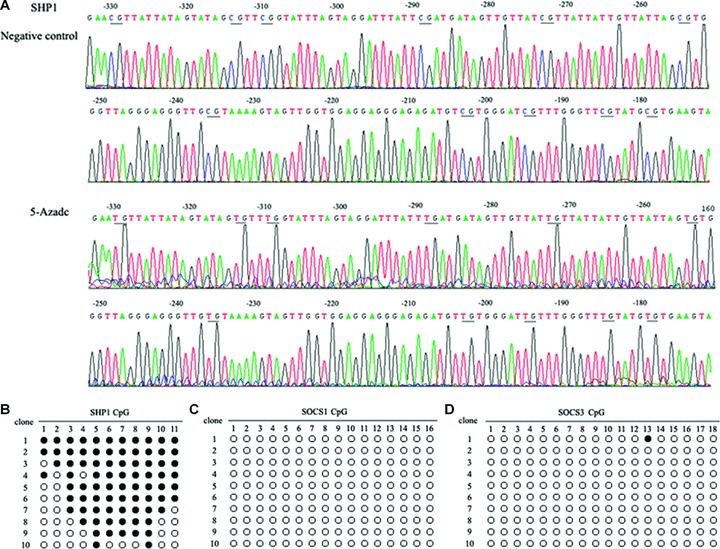
Bisulphite sequencing of SHP1, SOCS1 and SOCS3 promoters in HT29 cells. (A) Bisulphite sequencing chromatogram of SHP1 in HT29 cells. Bisulphate sequencing studies were performed on DNA extracted from HT29 cells cultured in the absence or presence of 5 μM 5-aza-dc for 96 hrs. Ten individual clones were analysed and the proportion of methylated residues detected ranged from 18.2% (2/11) to 100% (11/11). In this figure, the sequencing results from a clone with 11 demethylated CG pairs identified in the SHP1 promoter at positions −330, −314, −310, −289, −273, −265, −236, −203, −195, −185 and −179. (B) Methylation status of the SHP1, SOCS1 and SOCS3 promoters in HT29 cells (•, methylated cytosine; ○, unmethylated cytosine).
SHP1 expression induces down-regulation of JAK2/STAT3/STAT5 pathways
To determine whether up-regulation of SHP1 mediates down-regulation of JAK/STAT signalling in CRC cells, SW1116 and HT29 cell lines were transfected with pEGFP-N1 or pEGFP-N1-SHP1. Transfection efficiency was determined from the expression of GFP detected by flow cytometry, and was estimated to vary between 40% and 70%, with a median of 50% for both vectors. When transfected cells were sorted, 98% of the isolated GFP-expressing cells were obtained and analysed by Western blot. As shown in Fig. 3, SHP1 expression levels were higher in both CRC cell lines transfected with pEGFP-N1-SHP1 relative to CRC cell lines transfected with pEGFP-N1. Additionally, expression of SHP1 was also associated with substantial decreases in the protein levels of phosphorylated JAK2 (pJAK2), pSTAT3 and pSTAT5, as well as levels of unphosphorylated JAK2. However, decreases in JAK2 were less than that for pJAK2. For unphosphorylated STAT3 and STAT5 protein levels, no significant changes were observed following exogenous expression of SHP1. These data demonstrate that the JAK2/STAT3/STAT5 pathway is subject to negative regulation by SHP1 in CRC cells, and negative regulation of JAK2 by SHP1 may include both dephosphorylation and others, such as protein degradation.
Figure 3.
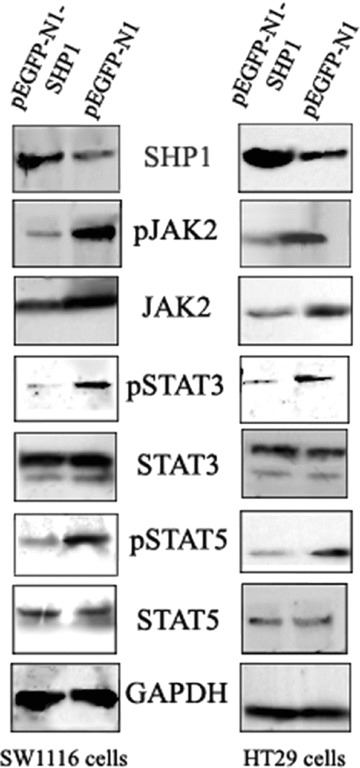
The affects of SHP1 expression on JAK2/STAT3/STAT5 protein levels in CRC cells. CRC cells transfected with pEGFP-N1 or pEGFP-N1-SHP1 were sorted for GFP expression and extracts analysed by Western blot. Substantial decreases in expression of pJAK2, JAK2, pSTAT3 and pSTAT5 were detected. The decrease in pJAK2 levels was greater than that of JAK2. In contrast, no significant changes in STAT3 and STAT5 protein levels were detected. The data shown are from a representative experiment and detection of GAPDH was used as a loading control.
We further evaluated whether up-regulated SHP1 expression in response to 5-aza-dc was associated with any changes in JAK/STAT signalling. Western blot analysis detected substantial decreases in the protein levels of JAK2, pJAK2, pSTAT3 and pSTAT5 in CRC cells following 5-aza-dc treatment. For example, in SW1116 cells treated with 5-aza-dc for 24 hrs, no significant changes in the protein levels of JAK2, STAT3, or STAT5 were detected. However, at later time-points, higher levels of SHP1 expression were associated with decreases in JAK2 and pJAK2 levels that were followed by decreases in pSTAT3 and pSTAT5. A decrease in STAT3 was detected in cells exposed to 5-aza-dc; however no appreciable changes in STAT5 protein levels were detected following 5-aza-dc treatment (Fig. 4A).
Figure 4.
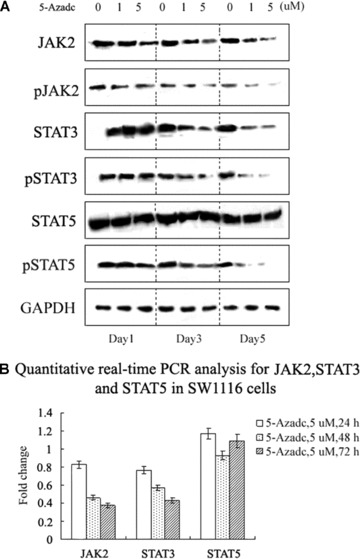
5-aza-dc induces down-regulation of JAK2/STAT3/STAT5 protein levels. (A) Western blot analysis revealed decreases in JAK2 and pJAK2 protein levels for SW1116 cells treated with 5-aza-dc. In the same experiment, decreases in STAT3, pSTAT3 and pSTAT5 were also identified. The data shown are from a representative experiment and detection of GAPDH was used as a loading control. (B) Quantitative real-time PCR analysis of JAK2, STAT3 and STAT5 in SW1116 cells treated with 5-aza-dc. Results are expressed as relative expression compared to untreated cells. Each value is the mean ± S.D. of three experiments.
Quantitative real-time PCR assays were also performed to analyse levels of JAK2, STAT3 and STAT5 mRNA. In SW1116 cells, after 72 hrs of treatment with 5 μM 5-aza-dc, JAK2 and STAT3 mRNA levels decreased to 0.373- and 0.428-fold, respectively, compared to untreated SW1116 cells (Fig. 4B). In contrast, no significant changes in STAT5 mRNA levels were detected in SW1116 cells. The results of the PCR assays were consistent with the analysis of protein levels by Western blot.
SHP1 decreases JAK2 expression via the proteasome pathway in CRC cells
To determine whether the proteasome pathway has a role in SHP1-mediated degradation of JAK2, CRC cells were treated with 10 μM MG132, a pharmacological proteasome inhibitor, 48 hrs after transfection with pEGFP-N1-SHP1 and cell sorting for the GFP-positive cell population. As shown in Fig. 5, the basal level of JAK2 in pEGFP-N1-SHP1 transfected SW1116 cells was much lower than that in pEGFP-N1 transfected cells. However, after 10 hrs in the presence of 10 μM MG132, the level of JAK2 protein was approximately equal between the pEGFP-N1-SHP1- and pEGFP-N1-transfected cells. A similar protein expression pattern was seen in HT29 cells, indicating that MG132 can prevent SHP1-mediated down-regulation of JAK2 through the proteasome pathway.
Figure 5.
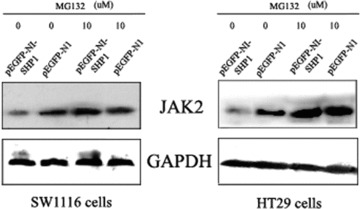
MG132 prevents SHP1-mediated down-regulation of JAK2. CRC cells were transfected with pEGFP-N1 or pEGFP-N1-SHP1 and sorted for GFP expression. The GFP-positive population was subsequently treated with 10 μM MG132 and extracts were analysed by Western blot. Decreased levels of JAK2 induced by exogenous expression of SHP1 were reversed 10 hrs after the addition of 10 μM MG132 to cell cultures. The data shown are from a representative experiment and detection of GAPDH was used as a loading control.
Disruption of JAK2/STAT3/STAT5 signalling by 5-aza-dc is associated with modulation of some JAK2/STAT3/STAT5 downstream targets
To test if alterations in the JAK2/STAT3/STAT5 pathway by 5-aza-dc lead to significant changes in downstream targets, we examined the expression of various proteins involved in apoptosis, cell cycle progression, invasion and migration. As illustrated in Fig. 6A, p16ink4a, p21waf1/cip1 and p27kip1 showed time-dependent increases in their expression levels, concomitant with decreases in levels of Bcl-2 and focal adhesion kinase (FAK) in SW1116 cells. We were unable to detect changes in expression of survivin and E-cadherin. Furthermore, ELISA assays detected reduced secretion of VEGF following treatment with 5-aza-dc, but no significant changes in the secretion of MMP-2 and MMP-9 (Fig. 6B). Similar changes in protein expression were observed for HT29 cells treated with 5-aza-dc. Additionally, we chose p27kip1 as an example to detect the methylation status. As shown in Fig. 6C, methylation did not seem to be involved in the regulation of p27kip1 in CRC cells, demonstrating that the 5-aza-dc-induced change in p27kip1 expression is not confounded by methylation of the p27kip1 gene. Therefore, our results indicate that disruption of JAK2/STAT3/STAT5 signalling by 5-aza-dc may be at least one of the causes of modulation of these target genes.
Figure 6.
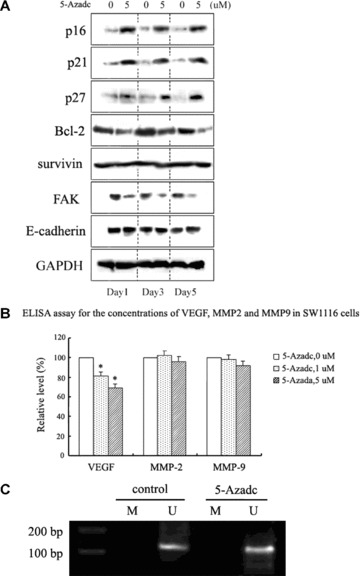
Disruption of JAK2/STAT3/STAT5 signalling by 5-aza-dc is associated with modulation of downstream STAT targets. (A) Western blot analysis of JAK2/STAT3/STAT5 downstream targets in SW1116 cells following 5-aza-dc treatment. Bcl-2 and FAK were down-regulated, while p16ink4a, p21waf1/cip1 and p27kip1 were up-regulated. Survivin and E-cadherin showed no detectable change. The data shown are from a representative experiment and detection of GAPDH was used as a loading control. (B) Concentrations of VEGF, MMP-2 and MMP-9 in SW1116 cells treated with 5-aza-dc were analysed by ELISA 24 hrs after treatment. A decrease in the secretion of VEGF was detected (*p < 0.05). Results are expressed as relative levels compared with untreated cells. Each value is the mean ± S.D. of three experiments. (C) p27kip1 MSP was performed on DNA from SW1116 cells to specifically detect the methylation status of the promoter (M, methylated-MSP; U, unmethylated-MSP). The data shown are representative of three replicate MSP experiments.
5-aza-dc suppresses CRC cell growth and induces G2 cell cycle arrest and apoptosis without affecting cell invasion
Using a CCK-8 assay (Fig. 7A), concentration- and time-dependent decreases in cell viability for SW1116 and HT29 cells following 5-aza-dc treatment were identified relative to untreated cells. To explore the mechanism responsible for the observed decrease in cell viability, the effects of 5-aza-dc on cell cycle progression and apoptosis were examined. As illustrated in Fig. 7B, pre-treatment of CRC cells with 5-aza-dc for 72 hrs blocked cells in the G2 phase. In SW1116 cells, the percentage of cells in the G2 phase increased from 4.9% (untreated) to 19.7% following treatment with 5 μM 5-aza-dc (Fig. 7B). These observations were consistent with the up-regulation of p16ink4a, p21waf1/cip1 and p27kip1 detected by Western blot following treatment of CRC cells with 5-aza-dc.
Figure 7.
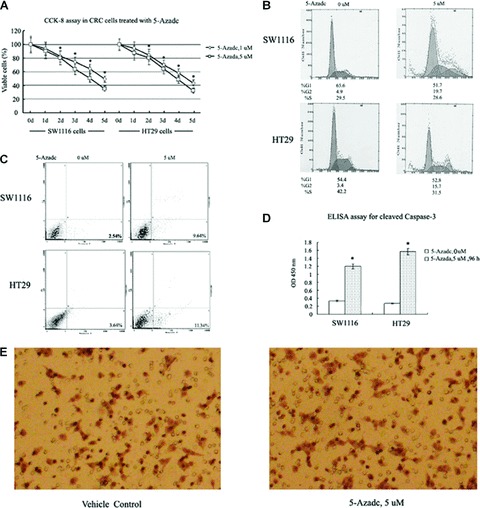
Biological effects of 5-aza-dc in CRC cells. (A) CCK-8 assay of CRC cells treated with 5 μM 5-aza-dc or solvent only as a negative control. The cell numbers of 5-aza-dc-treated cells were normalized to that of the negative control and showed a concentration- and time-dependent decrease in the number of viable CRC cells treated with 5-aza-dc compared to negative control cells (*P < 0.05). (B) Cell cycle analysis was performed 72 hrs after CRC cells were treated with diluent (left) or 5-aza-dc (5 μM, right). Compared to negative control cells, treated cells showed an increased proportion of cells in the G2 phase. Data shown are from a representative experiment. (C) CRC cells were treated with diluent (left) or 5-aza-dc (5 μM, right) for 96 hrs and then analysed for the presence of cell apoptosis by flow cytometric analysis. A 3.80- and 3.12-fold increase in apoptotic cells were detected for SW1116 and HT29 cells treated with 5 μM 5-aza-dc relative to control cells. The data shown are from a representative experiment. (D) Cleavage of caspase-3 in CRC cells treated with 5 μM 5-aza-dc was detected 96 hrs after treatment. Each value is the mean ± S.D. of three experiments (*P < 0.05). (E) An in vitro cell invasion assay was performed using SW1116 cells as described in the ‘Materials and methods’ section. After 24 hrs of treatment with 5 μM 5-aza-dc, no significant difference in cell invasion was detected between treated and vehicle control cells. The data shown are from a representative experiment at 200× magnification.
To evaluate the role of apoptosis in the decreased cell viability exhibited following 5-aza-dc treatment, flow cytometry analysis of annexin V binding was performed. After 96 hrs of treatment with 5 μM 5-aza-dc, annexin V binding to the surface of CRC cells increased (Fig. 7C), corresponding to a 3.80- and 3.12-fold increase in apoptosis for the SW1116 and HT29 cell lines, respectively. In addition, as shown in Fig. 7D, pre-treatment of CRC cells with 5 μM 5-aza-dc for 96 hrs stimulated cleavage of caspase-3, suggesting that caspase-3 activation may play a significant role in 5-aza-dc induced apoptosis. Cell invasion assays were also performed, and no significant inhibition of invasion was observed following cell treatment with 5-aza-dc (Fig. 7E).
Discussion
Hypermethylation of promoters of various tumour suppressor genes causes their transcriptional silencing. However, hypomethylation of regulatory DNA sequences activates transcription of protooncogenes, retrotransposons, as well as genes encoding proteins involved in genomic instability and malignant cell metastasis. The mechanism of transcriptional repression via DNA methylation suggests that DNA methylation directly inhibits the binding of transcription factors to their binding sites within a promoter sequence [35]. 5-aza-dc treatment has been shown to open the chromosomal region to increase accessibility for transcription factor complexes to assemble at the promoter and drive gene transcription. Therefore, 5-aza-dc has been characterized as a demethylation agent that can re-induce expression of TSGs [36]. Although 5-aza-dc has been reported as a promising therapeutic agent for myelodysplastic syndromes and chronic myelomonocytic leukaemia, the mechanisms underlying the role of MTIs in cancer therapy are poorly understood. In addition to a role in DNA demethylation, 5-aza-dc has also been shown to mediate anticancer effects through DNA damage [37, 38]. For example, in studies by Zhu and coworkers, 5-aza-dc was shown to activate the p53/p21waf1/cip1 pathway to inhibit human lung cancer cell proliferation, but not as a result of DNA demethylation [38]. We have previously shown that 5-aza-dc does not induce activation of p53 in CRC cells [39]. Therefore, our investigation in this study of the therapeutic effect of 5-aza-dc in human CRC cells identified mechanisms involved in the methylation state of SHP1 and downstream targets of the JAK2/STAT3/STAT5 signalling pathways, but not effects from p53-induced DNA damage. The objective of this work was to address the role of the therapeutic effect of 5-aza-dc in human CRC cells, which has not been fully characterized. In addition, this study is one of the first to examine the role of SHP1 in CRC cells.
We and other research groups have previously demonstrated that constitutive activation of JAK/STAT signalling is involved in the oncogenesis of CRC. Furthermore, SHP1 and SOCSs have been shown to be important negative regulators of JAK/STAT signalling, and silencing of SHP1 and SOCSs by gene methylation has been detected in many cancers. Nevertheless, in CRC, the relationship between the regulation of SHP1, SOCSs and JAK/STAT signalling has remained largely unknown. In this study, we confirmed that 5-aza-dc induces an increase in SHP1 protein levels that corresponds with changes in the methylation status of the SHP1 promoter in CRC cells. Furthermore, up-regulation of SHP1 expression correlated with a decrease in JAK2, pJAK2, STAT3, pSTAT3 and pSTAT5 protein levels in CRC cells.
Increased expression of SHP1 was shown to not only inhibit pJAK2, but also to reduce the total amount of JAK2 protein in CRC cells. Given that the protein levels of JAK2 were relatively small compared to that of pJAK2, down-regulation of pJAK2 cannot solely be explained by a decrease in total JAK2 protein. Therefore, we suggest that down-regulation of pJAK2 is due to both SHP1-mediated tyrosine dephosphorylation and SHP1-induced down-regulation of total JAK2 protein. In this study, we have confirmed that SHP1 decreases JAK2 expression via the proteasome pathway in CRC cells. Further time-course studies that explore whether a SHP1-mediated decrease in pJAK2 is dependent on JAK2 may explain the importance of SHP1-mediated tyrosine dephosphorylation.
SHP1 was also shown to effectively decrease levels of pSTAT3 and pSTAT5, but not total protein levels of STAT3 and STAT5. The SHP1-induced decreases in pSTAT3 and pSTAT5 levels were independent of total STAT3 and STAT5 proteins in CRC cells, and we suggest that these changes can be partly attributed to the decrease in the protein level and activation of JAK2, a physiologic activator of STAT3 and STAT5. However, there is also the possibility that SHP1 may directly inactivate STAT3 since it has previously been reported that these two proteins can physically interact with each other in some cell types [40]. We further suggest that the lack of significant change in STAT5 levels in response to SHP1 up-regulation is the result of STAT5 regulation by other pathways involving Src kinase [41].
The involvement of SOCSs in cancer pathogenesis has been established. In many cancers, SOCSs seem to function as tumour suppressors, and cancer cells that inactivate SOCSs expression acquire a selective growth advantage. For example, SOCS1 is silenced by methylation in human hepatocellular carcinoma and shows growth-suppression activity [42]. However, recent data have shown that SOCSs may also be overexpressed in tumours as well. Both SOCS1 and SOCS3 mRNA are constitutively expressed in some breast cancer cells, and SOCS3 overexpression has been described in lymphoid and myeloid cancers [43–46]. Thus, SOCSs proteins may have a complex relationship with cell transformation. Despite the description of SOCSs involvement in multiple tumours, the roles and expressions of SOCSs in CRC has not been elucidated. Although treatment with 5-aza-dc in multiple myeloma was shown to up-regulate SOCSs [20], expression of SOCS1 and SOCS3 was not affected by 5-aza-dc treatment in CRC cells in this study. Since SOCS1 and SOCS3 expression were not affected by methylation induced by 5-aza-dc, these data suggest that SOCSs proteins may have varying roles in different cell types that reflect different mechanisms of regulation.
Meanwhile, our data show that the restoration of SHP1 by 5-aza-dc is also associated with changes in JAK2/STAT3/STAT5 signalling, because of the decrease in JAK2, pJAK2, STAT3, pSTAT3 and pSTAT5. Moreover, a decrease in the mRNA levels of JAK2 and STAT3 in the presence of 5-aza-dc was also found, suggesting that 5-aza-dc might have a direct or indirect effect on transcription of JAK2 and STAT3 in CRC cells. Mowen et al. reported that STATs are methylated on a conserved arginine residue within the N-terminal region, and methylation contributes to the regulation of STATs transcriptional activity [47, 48]. However, the results from Komyod et al. did not confirm the occurrence of arginine methylation on STAT1 or STAT3 in melanoma and fibrosarcoma cells [49]. These inconsistent results indicate the complex regulation of STATs. Thus, to elucidate the mechanism on 5-aza-dc-mediated transcriptional regulation of JAK2 and STAT3, further studies are needed to explore the methylation status of JAK and STAT in CRC cells. In addition, we would not exclude the possibility that other unknown mechanisms may also be involved.
We further evaluated the biological significance of 5-aza-dc in reversing the malignant phenotype of CRC cells. In this study, 5-aza-dc treatment was associated with a gradual decrease in CRC cell viability as a result of a significant increase in apoptosis following an arrest of cells in the G2 phase. These data are consistent with previous parallel studies of 5-aza-dc-induced apoptosis in acute myeloid leukaemia (AML) cells [50] and cell-cycle arrest in ALK-positive anaplastic large cell lymphoma cells [51], although the data do not rule out the possibility of other mechanisms of reduced cell viability. When we further investigated various apoptosis- and cell cycle-regulatory proteins known to be downstream targets of JAK2/STAT3/STAT5, we found that treatment of CRC cells with 5-aza-dc decreased protein levels of Bcl-2, and increased protein levels of p16ink4a, p21waf1/cip1 and p27kip1. Interestingly though, changes in STAT downstream targets were detected 24 hrs after 5-aza-dc treatment (Fig. 6), while no significant change in JAK and STAT protein levels were observed at the same time-point (Fig. 4). These data would support a role for direct demethylation of these downstream target genes by 5-aza-dc as has previously been shown with the frequent methylation of p16ink4a and p21waf1/cip1 in CRC [31, 52]. We would not exclude the possibility that other unknown mechanisms may also be involved. Overall, we postulate that the mechanisms of 5-aza-dc-induced cell cycle arrest and apoptosis can be attributed at least in part to the regulation of these downstream genes, and that the lack of change observed in survivin protein levels is explained by the regulation of survivin by other pathways such as Akt and NF-κB [53, 54].
No significant effect of 5-aza-dc on the invasive phenotype of CRC cells was observed, although 5-aza-dc was shown to down-regulate FAK and VEGF, two proteins previously associated with roles in cell migration in other cell types. We suggest that these data reflect the role of up-regulated MMPs (in this case we detected increased MMP-2 and MMP-9) and lower expression levels of E-cadherin detected following 5-aza-dc treatment of CRC cells. However, the decrease in FAK and VEGF levels may represent the potential of 5-aza-dc to sensitize CRC cells to other anti-metastasis drugs. Further studies would be needed to explore this hypothesis.
In summary, the present study is the first to demonstrate that JAK2/STAT3/STAT5 signalling has a role in MTI-induced cell growth arrest, apoptosis and invasion in human CRC cells. We determined that DNA methylation is integral to regulation of SHP1 expression, and 5-aza-dc-induced up-regulation of SHP1 expression correlates with significant down-regulation of JAK2/STAT3/STAT5 signalling in CRC cells. Based on these data, we suggest that DNA methylase inhibition is a mechanism by which inhibition of JAK2/STAT3/STAT5 signalling can occur in CRC cells (Fig. 8). Therefore, further study of 5-aza-dc on JAK2/STAT3/STAT5 signalling in CRC tumorigenesis and progression has the potential to advance the development of effective agents for CRC prevention and therapy. Additionally, since 5-aza-dc also affects mRNA stability, further studies regarding this effect should be performed.
Figure 8.
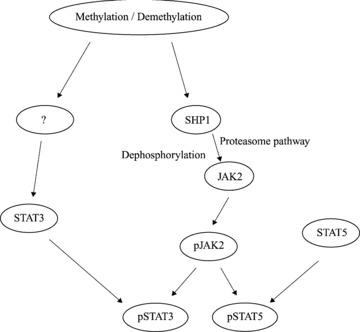
The possible mechanistic link between JAK2/STAT3/STAT5 signalling and the anticancer action of 5-aza-dc in CRC cells. Using an inhibitor of DNA methytransferase, 5-aza-dc, methylation was shown to be integral to the regulation of SHP1 expression, and SHP1 appears to down-regulate JAK2 by two mechanisms: tyrosine dephosphorylation and the proteasome pathway. The decrease in STAT3 expression observed in CRC cells exposed to 5-aza-dc is unclear at this point and requires additional study, while STAT5 appears to be unaffected by an inhibition of methylation.
Acknowledgments
This work was supported by grants from the National Basic Research Program of China (973 Program) (No: 2005CB522400), the National Science Fund for Distinguished Young Scholars (No: 30625034) to F.J.Y., the National Natural Science Foundation of China (No: 30800513), and Specialized Research Fund for the Doctoral Program of Higher Education. Special thanks go to Ms. Hongyin Zhu for her excellent technical assistance and enthusiastic participation in this study.
References
- 1.Lubbert M. DNA methylation inhibitors in the treatment of leukemias, myelodysplastic syndromes and hemoglobinopathies: clinical results and possible mechanisms of action. Curr Top Microbiol Immunol. 2000;249:135–64. doi: 10.1007/978-3-642-59696-4_9. [DOI] [PubMed] [Google Scholar]
- 2.Momparler RL, Ayoub J. Potential of 5-aza-2’-deoxycytidine (Decitabine) a potent inhibitor of DNA methylation for therapy of advanced non-small cell lung cancer. Lung Cancer. 2001;34:S111–5. doi: 10.1016/s0169-5002(01)00397-x. [DOI] [PubMed] [Google Scholar]
- 3.Issa JP, Kantarjian H. Azacitidine. Nat Rev Drug Discov. 2005:S6–7. doi: 10.1038/nrd1726. [DOI] [PubMed] [Google Scholar]
- 4.Wijermans P, Lubbert M, Verhoef G, et al. Low-dose 5-aza-2’-deoxycytidine, a DNA hypomethylating agent, for the treatment of high-risk myelodysplastic syndrome: a multicenter phase II study in elderly patients. J Clin Oncol. 2000;18:956–62. doi: 10.1200/JCO.2000.18.5.956. [DOI] [PubMed] [Google Scholar]
- 5.Aparicio A, Eads CA, Leong LA, et al. Phase I trial of continuous infusion 5-aza-2′-deoxycytidine. Cancer Chemother Pharmacol. 2003;51:231–9. doi: 10.1007/s00280-002-0563-y. [DOI] [PubMed] [Google Scholar]
- 6.Lyons J, Bayar E, Fine G, et al. Decitabine: development of a DNA methyltransferase inhibitor for hematological malignancies. Curr Opin Investig Drugs. 2003;4:1442–50. [PubMed] [Google Scholar]
- 7.Issa JP, Garcia-Manero G, Giles FJ, et al. Phase 1 study of low-dose prolonged exposure schedules of the hypomethylating agent 5-aza-2′-deoxycytidine (decitabine) in hematopoietic malignancies. Blood. 2004;103:1635–40. doi: 10.1182/blood-2003-03-0687. [DOI] [PubMed] [Google Scholar]
- 8.Balch C, Yan P, Craft T, et al. Antimitogenic and chemosensitizing effects of the methylation inhibitor zebularine in ovarian cancer. Mol Cancer Ther. 2005;4:1505–14. doi: 10.1158/1535-7163.MCT-05-0216. [DOI] [PubMed] [Google Scholar]
- 9.Niwa Y, Kanda H, Shikauchi Y, et al. Methylation silencing of SOCS-3 promotes cell growth and migration by enhancing JAK/STAT and FAK signalings in human hepatocellular carcinoma. Oncogene. 2005;24:6406–17. doi: 10.1038/sj.onc.1208788. [DOI] [PubMed] [Google Scholar]
- 10.Lacronique V, Boureux A, Valle VD, et al. A TEL-JAK2 fusion protein with constitutive kinase activity in human leukemia. Science. 1997;278:1309–12. doi: 10.1126/science.278.5341.1309. [DOI] [PubMed] [Google Scholar]
- 11.Zhang F, Li C, Halfter H, et al. Delineating an oncostatin M-activated STAT3 signaling pathway that coordinates the expression of genes involved in cell cycle regulation and extracellular matrix deposition of MCF-7 cells. Oncogene. 2003;22:894–905. doi: 10.1038/sj.onc.1206158. [DOI] [PubMed] [Google Scholar]
- 12.Alvarez JV, Greulich H, Sellers WR, et al. Signal transducer and activator of transcription 3 is required for the oncogenic effects of non-small-cell lung cancer-associated mutations of the epidermal growth factor receptor. Cancer Res. 2006;66:3162–8. doi: 10.1158/0008-5472.CAN-05-3757. [DOI] [PubMed] [Google Scholar]
- 13.Shen Y, Devgan G, Darnell JE, Jr, et al. Constitutively activated Stat3 protects fibroblasts from serum withdrawal and UV-induced apoptosis and antagonizes the proapoptotic effects of activated Stat1. Proc Natl Acad Sci USA. 2001;98:1543–8. doi: 10.1073/pnas.041588198. [DOI] [PMC free article] [PubMed] [Google Scholar]
- 14.Mora LB, Buettner R, Seigne J, et al. Constitutive activation of Stat3 in human prostate tumors and cell lines: direct inhibition of Stat3 signaling induces apoptosis of prostate cancer cells. Cancer Res. 2002;62:6659–66. [PubMed] [Google Scholar]
- 15.Ma XT, Wang S, Ye YJ, et al. Constitutive activation of Stat3 signaling pathway in human colorectal carcinoma. World J Gastroenterol. 2004;10:1569–73. doi: 10.3748/wjg.v10.i11.1569. [DOI] [PMC free article] [PubMed] [Google Scholar]
- 16.Lassmann S, Schuster I, Walch A, et al. STAT3 mRNA and protein expression in colorectal cancer: effects on STAT3-inducible targets linked to cell survival and proliferation. J Clin Pathol. 2007;60:173–9. doi: 10.1136/jcp.2005.035113. [DOI] [PMC free article] [PubMed] [Google Scholar]
- 17.Lin Q, Lai R, Chirieac LR, et al. Constitutive activation of JAK3/STAT3 in colon carcinoma tumors and cell lines: inhibition of JAK3/STAT3 signaling induces apoptosis and cell cycle arrest of colon carcinoma cells. Am J Pathol. 2005;167:969–80. doi: 10.1016/S0002-9440(10)61187-X. [DOI] [PMC free article] [PubMed] [Google Scholar]
- 18.Xiong H, Zhang ZG, Tian XQ, et al. Inhibition of JAK1, 2/STAT3 signaling induces apoptosis, cell cycle arrest, and reduces tumor cell invasion in colorectal cancer cells. Neoplasia. 2008;10:287–97. doi: 10.1593/neo.07971. [DOI] [PMC free article] [PubMed] [Google Scholar]
- 19.Han Y, Amin HM, Franko B, et al. Loss of SHP1 enhances JAK3/STAT3 signaling and decreases proteosome degradation of JAK3 and NPM-ALK in ALK+ anaplastic large-cell lymphoma. Blood. 2006;108:2796–803. doi: 10.1182/blood-2006-04-017434. [DOI] [PubMed] [Google Scholar]
- 20.Chim CS, Fung TK, Cheung WC, et al. SOCS1 and SHP1 hypermethylation in multiple myeloma: implications for epigenetic activation of the Jak/STAT pathway. Blood. 2004;103:4630–5. doi: 10.1182/blood-2003-06-2007. [DOI] [PubMed] [Google Scholar]
- 21.Buettner R, Mora LB, Jove R. Activated STAT signaling in human tumors provides novel molecular targets for therapeutic intervention. Clin Cancer Res. 2002;8:945–54. [PubMed] [Google Scholar]
- 22.Khoury JD, Rassidakis GZ, Medeiros LJ, et al. Methylation of SHP1 gene and loss of SHP1 protein expression are frequent in systemic anaplastic large cell lymphoma. Blood. 2004;104:1580–1. doi: 10.1182/blood-2004-03-1151. [DOI] [PubMed] [Google Scholar]
- 23.Galm O, Yoshikawa H, Esteller M, et al. SOCS-1, a negative regulator of cytokine signaling, is frequently silenced by methylation in multiple myeloma. Blood. 2003;101:2784–8. doi: 10.1182/blood-2002-06-1735. [DOI] [PubMed] [Google Scholar]
- 24.He B, You L, Uematsu K, et al. SOCS-3 is frequently silenced by hypermethylation and suppresses cell growth in human lung cancer. Proc Natl Acad Sci USA. 2003;100:14133–8. doi: 10.1073/pnas.2232790100. [DOI] [PMC free article] [PubMed] [Google Scholar]
- 25.Wu C, Guan Q, Wang Y, et al. SHP-1 suppresses cancer cell growth by promoting degradation of JAK kinases. J Cell Biochem. 2003;90:1026–37. doi: 10.1002/jcb.10727. [DOI] [PubMed] [Google Scholar]
- 26.Jegalian AG, Wu H. Regulation of Socs gene expression by the proto-oncoprotein GFI-1B: two routes for STAT5 target gene induction by erythropoietin. J Biol Chem. 2002;277:2345–52. doi: 10.1074/jbc.M105575200. [DOI] [PubMed] [Google Scholar]
- 27.Valentino L, Pierre J. JAK/STAT signal transduction: regulators and implication in hematological malignancies. Biochem Pharmacol. 2006;71:713–21. doi: 10.1016/j.bcp.2005.12.017. [DOI] [PubMed] [Google Scholar]
- 28.Rakesh K, Agrawal DK. Controlling cytokine signaling by constitutive inhibitors. Biochem Pharmacol. 2005;70:649–57. doi: 10.1016/j.bcp.2005.04.042. [DOI] [PubMed] [Google Scholar]
- 29.Wu C, Sun M, Liu L, et al. The function of the protein tyrosine phosphatase SHP-1 in cancer. Gene. 2003;306:1–12. doi: 10.1016/s0378-1119(03)00400-1. [DOI] [PubMed] [Google Scholar]
- 30.Livak KJ, Schmittgen TD. Analysis of relative gene expression data using real-time quantitative PCR and the 2(-Delta Delta C(T)) Method. Methods. 2001;25:402–8. doi: 10.1006/meth.2001.1262. [DOI] [PubMed] [Google Scholar]
- 31.Lu R, Wang X, Chen ZF, et al. Inhibition of the extracellular signal-regulated kinase/mitogen-activated protein kinase pathway decreases DNA methylation in colon cancer cells. J Biol Chem. 2007;282:12249–59. doi: 10.1074/jbc.M608525200. [DOI] [PubMed] [Google Scholar]
- 32.Morita Y, Naka T, Kawazoe Y, et al. Signals transducers and activators of transcription (STAT)-induced STAT inhibitor-1 (SSI-1)/suppressor of cytokine signaling-1 (SOCS-1) suppresses tumor necrosis factor alpha-induced cell death in fibroblasts. Proc Natl Acad Sci USA. 2000;97:5405–10. doi: 10.1073/pnas.090084797. [DOI] [PMC free article] [PubMed] [Google Scholar]
- 33.Wang YY, Zhou GB, Yin T, et al. AML1-ETO and C-KIT mutation/overexpression in t(8;21) leukemia: implication in stepwise leukemogenesis and response to Gleevec. Proc Natl Acad Sci USA. 2005;102:1104–9. doi: 10.1073/pnas.0408831102. [DOI] [PMC free article] [PubMed] [Google Scholar]
- 34.Hecht M, Papoutsi M, Tran HD, et al. Hepatocyte growth factor/c-Met signaling promotes the progression of experimental human neuroblastomas. Cancer Res. 2004;64:6109–18. doi: 10.1158/0008-5472.CAN-04-1014. [DOI] [PubMed] [Google Scholar]
- 35.Luczak MW, Jagodzinski PP. The role of DNA methylation in cancer development. Folia Histochem Cytobiol. 2006;44:143–54. [PubMed] [Google Scholar]
- 36.Hennessy BT, Garcia-Manero G, Kantarjian HM, et al. DNA methylation in haematological malignancies: the role of decitabine. Expert Opin Investig Drugs. 2003;12:1985–93. doi: 10.1517/13543784.12.12.1985. [DOI] [PubMed] [Google Scholar]
- 37.Karpf AR, Moore BC, Ririe TO, et al. Activation of the p53 DNA damage response pathway after inhibition of DNA methyltransferase by 5-aza-2′-deoxycytidine. Mol Pharmacol. 2001;59:751–7. [PubMed] [Google Scholar]
- 38.Zhu WG, Hileman T, Ke Y, et al. 5-aza-2′-deoxycytidine activates the p53/p21Waf1/Cip1 pathway to inhibit cell proliferation. J Biol Chem. 2004;279:15161–6. doi: 10.1074/jbc.M311703200. [DOI] [PubMed] [Google Scholar]
- 39.Fang JY, Chen YX, Lu J, et al. Epigenetic modification regulates both expression of tumor-associated genes and cell cycle progressing in human colon cancer cell lines: Colo-320 and SW1116. Cell Res. 2004;14:217–26. doi: 10.1038/sj.cr.7290222. [DOI] [PubMed] [Google Scholar]
- 40.Paling NR, Welham MJ. Role of the protein tyrosine phosphatase SHP-1 (Src homology phosphatase-1) in the regulation of interleukin-3-induced survival, proliferation and signalling. Biochem J. 2002;368:885–94. doi: 10.1042/BJ20021054. [DOI] [PMC free article] [PubMed] [Google Scholar]
- 41.Kazansky AV, Kabotyanski EB, Wyszomierski SL, et al. Differential effects of prolactin and src/abl kinases on the nuclear translocation of STAT5B and STAT5A. J Biol Chem. 1999;274:22484–92. doi: 10.1074/jbc.274.32.22484. [DOI] [PubMed] [Google Scholar]
- 42.Yoshikawa H, Matsubara K, Qian GS, et al. SOCS-1, a negative regulator of the JAK/STAT pathway, is silenced by methylation in human hepatocellular carcinoma and shows growth-suppression activity. Nat Genet. 2001;28:29–35. doi: 10.1038/ng0501-29. [DOI] [PubMed] [Google Scholar]
- 43.Sakai I, Takeuchi K, Yamauchi H, et al. Constitutive expression of SOCS3 confers resistance to IFN-alpha in chronic myelogenous leukemia cells. Blood. 2002;100:2926–31. doi: 10.1182/blood-2002-01-0073. [DOI] [PubMed] [Google Scholar]
- 44.Cho-Vega JH, Rassidakis GZ, Amin HM, et al. Suppressor of cytokine signaling 3 expression in anaplastic large cell lymphoma. Leukemia. 2004;18:1872–8. doi: 10.1038/sj.leu.2403495. [DOI] [PubMed] [Google Scholar]
- 45.Takeuchi K, Sakai I, Narumi H, et al. Expression of SOCS3 mRNA in bone marrow cells from CML patients associated with cytogenetic response to IFN-alpha. Leuk Res. 2005;29:173–8. doi: 10.1016/j.leukres.2004.06.006. [DOI] [PubMed] [Google Scholar]
- 46.Brender C, Nielsen M, Kaltoft K, et al. STAT3-mediated constitutive expression of SOCS-3 in cutaneous T-cell lymphoma. Blood. 2001;97:1056–62. doi: 10.1182/blood.v97.4.1056. [DOI] [PubMed] [Google Scholar]
- 47.Mowen KA, Tang J, Zhu W, et al. Arginine methylation of STAT1 modulates IFNalpha/beta-induced transcription. Cell. 2001;104:731–41. doi: 10.1016/s0092-8674(01)00269-0. [DOI] [PubMed] [Google Scholar]
- 48.Lee DY, Teyssier C, Strahl BD, et al. Role of protein methylation in regulation of transcription. Endocr Rev. 2005;26:147–70. doi: 10.1210/er.2004-0008. [DOI] [PubMed] [Google Scholar]
- 49.Komyod W, Bauer UM, Heinrich PC, et al. Are STATS arginine-methylated. J Biol Chem. 2005;280:21700–5. doi: 10.1074/jbc.C400606200. [DOI] [PubMed] [Google Scholar]
- 50.Schmelz K, Wagner M, Dorken B, et al. 5-Aza-2′-deoxycytidine induces p21WAF expression by demethylation of p73 leading to p53-independent apoptosis in myeloid leukemia. Int J Cancer. 2005;114:683–95. doi: 10.1002/ijc.20797. [DOI] [PubMed] [Google Scholar]
- 51.Han Y, Amin HM, Frantz C, et al. Restoration of shp1 expression by 5-AZA-2′-deoxycytidine is associated with downregulation of JAK3/STAT3 signaling in ALK-positive anaplastic large cell lymphoma. Leukemia. 2006;20:1602–9. doi: 10.1038/sj.leu.2404323. [DOI] [PubMed] [Google Scholar]
- 52.Esteller M, Tortola S, Toyota M, et al. Hypermethylation-associated inactivation of p14(ARF) is independent of p16(INK4a) methylation and p53 mutational status. Cancer Res. 2000;60:129–33. [PubMed] [Google Scholar]
- 53.Fornaro M, Plescia J, Chheang S, et al. Fibronectin protects prostate cancer cells from tumor necrosis factor-alpha-induced apoptosis via the AKT/survivin pathway. J Biol Chem. 2003;278:50402–11. doi: 10.1074/jbc.M307627200. [DOI] [PubMed] [Google Scholar]
- 54.Kunnumakkara AB, Nair AS, Ahn KS, et al. Gossypin, a pentahydroxy glucosyl flavone, inhibits the transforming growth factor beta-activated kinase-1-mediated NF-kappaB activation pathway, leading to potentiation of apoptosis, suppression of invasion, and abrogation of osteoclastogenesis. Blood. 2007;109:5112–21. doi: 10.1182/blood-2007-01-067256. [DOI] [PMC free article] [PubMed] [Google Scholar]


