

Abstract
Pharmacological GSK-3 inhibitors are potential drugs for the treatment of neurodegenerative diseases, cancer and diabetes. We examined the antiproliferative effects of two GSK-3 inhibitors, lithium and SB-415286, on B65 neuroblastoma cell line. Treatment of B65 cells with either drug administered separately caused a decrease in cell proliferation that was associated with G2/M cell cycle arrest. Cell-cycle proteins such as cyclins D, E, A, cdk4 and cdk2 were up-regulated. Since lithium and SB-415286-induced G2/M arrest we studied changes in the expression of proteins involved in this phase, specifically cyclin B, cdc2 and the phosphorylated form of this protein (tyr15-cdc2). Both drugs increased the expression of tyr15-cdc2, thus inhibiting mitosis. On the other hand, SB-415286 increased the expression of SIRT2, involved in the regulation of proliferation. Moreover, cell-cycle arrest mediated by SB-415286 was accompanied by apoptosis that was not prevented by 100 μM of zVAD-fmk (benzyloxycarbonyl-Val-Ala-Asp-fluoromethylketone), a pan-caspase inhibitor. Likewise, GSK-3 inhibitors did not affect the mitochondrial release of apoptosis inducing factor (AIF). We conclude that inhibitors of GSK-3 induced cell-cycle arrest, mediated by the phosphorylation of cdc2 and, in the case of SB-415286, SIRT2 expression, which induced apoptosis in a caspase-independent manner.
Keywords: GSK3, lithium, SB-415286, apoptosis, cdc2, B65 cells
Introduction
Glycogen synthase kinase 3 (GSK-3) has been extensively studied due to its role in several physiological processes such as cell proliferation, glucose uptake, sleep disorders, etc. [1, 2]. GSK-3 is a serine/threonine kinase that is regulated by Akt (also called PKB) and which phosphorylates GSK-3 at Ser-9 and inhibits it [3–6]. Many data support a prominent role for GSK-3 as a key regulator of neuronal cell death in brain disorders such as Alzheimer's disease and Parkinson's disease [7, 8]. Likewise, GSK-3 is involved in cell-cycle regulation, which suggests the potential application of GSK-3 inhibitors in cancer treatment [9–11]. Accordingly, inhibition of this enzyme offers a strategy for the treatment of neurodegenerative diseases, bipolar disorders and potential application in chemotherapies [3–6].
Lithium has been tested in most studies of GSK-3 inhibitors [2]. Lithium is a monovalent ion that was used more than 50 years ago for the treatment of bipolar disorders. It is well documented that lithium inhibits GSK-3 directly by competition with magnesium, which is required for its activity, and also indirectly through the activation of Akt (also called PKB) [12]. Lithium has been shown to protect primary neural cultures from several cell death stimuli via GSK-3 inhibition [13]. On the other hand, GSK-3 inhibition by lithium also induces morphological differentiation in the mouse neuroblastoma cell line, Neuro 2a [14]. Although it is effective in clinical studies, this drug is not a selective GSK-3 inhibitor. Lithium affects more than one target in apoptotic proteins such as Bcl-2, p53, protein kinase C and others [15–18]. Moreover, apart from lithium, more specific GSK-3 inhibitors have been developed, among them SB-415286 which is a potent and selective small-molecule inhibitor of GSK-3. In contrast to the extensive research on lithium, few studies have been performed with SB-415286, a compound that may be a useful tool by which the role of GSK-3 in cellular signalling can be further elucidated. Interestingly, SB-415286 exerts the same effects of lithium in the prevention of neuronal cell death after treatment of neuronal cultures with neurotoxins [17, 18].
Recent studies have indicated that GSK-3 inhibitors may have a potential application in cancer treatments specifically ovarian cancer, hepatocellular carcinoma and other tumours [19–24]. Thus, GSK-3 inhibitors inhibited cell growth in colorectal cancer cells and myeloma cells. Accordingly, it is important to gain a better understanding of the mechanisms involved in GSK-3 inhibition-induced cell cycle arrest for pharmacological treatment of cancer and also human gliomas [22–28]. Likewise, GSK-3 is implicated in the control of the Wnt/β-catenin pathway and thus in the regulation of proliferation and GSK-3 inhibitors may have pro-carcinogenic properties.
Nowadays, it is well known that in all eukaryotic cells, regulation of cell cycle progression is driven by sequential activation of a group of serine-threonine kinases called cyclin-dependent kinases (Cdks) and their partners, cyclins. Cdks in association with their activating subunits: cyclin D–cdk4/6 and cyclin E–cdk2 complexes regulate G1/S progression, cyclin A–cdk2 complexes mediate S/G2 transitions, and cyclin B–cdc2 complexes mediate M-phase progression [29, 30]. In addition to cyclins, sirtuin 2 (SIRT2) may regulate cell proliferation through the mitotic exit. SIRT2 belongs to the family of histone-deacetylases (HDAC), considered as epigenetic factors controlling the activity of several genes [31–37]. Sirtuins require NAD+ as a cofactor and deacetylate Lys residues and within the cell regulate a variety of processes, including the lifespan of organisms, neuroprotection, tumour suppression, differentiation and inflammation. Regulation or modulation of activity/expression of SIRT2 could constitute a potential anticancer therapy, particularly in human gliomas [31].
Here we examine the effects of two pharmacological GSK-3β inhibitors on B65 cell-cycle progression. We are particularly interested in evaluating the expression of cell-cycle proteins and also the effects of GSK-3 inhibitors on G2/M phase. These neuroblastoma-derived rat dopaminergic B65 cells have been mainly used in previous studies to evaluate the oxidative-stress that mimics neurodegenerative processes found in Parkinson's patients [32]. We report that Li+ and SB-415286 successfully inhibit B65 cell proliferation at G2/M by regulating cdc2 activity and we also demonstrate that the main difference between these drugs is the increase in protein and mRNA expression of SIRT2 by SB-415286.
Materials and methods
Materials
Drugs used in this study include: lithium chloride and SB-415286 from Sigma Chemical Co (St. Louis, MO, USA), and cell culture media and foetal calf serum (FCS) from GIBCO (Life Technologies, Paisley, UK). The production of formazan was measured by absorbency change at 595 nm using a microplate reader (BioRad Laboratories, CA, USA). Cell culture salts, enzymes and Triton X-100 were purchased from Sigma. Flow cytometry experiments were carried out using an Epics XL flow cytometer. Optical alignment was based on optimized signal from 10 nm fluorescent beads (Immunocheck, Epics Division). Stained cells were visualized under UV illumination using the 20× objective of a Nikon Eclipse fluomicroscope. To determine caspase activity, absorbance was measured at 405 nm in a microplate reader (BioRad). Western blot analysis was performed with polyvinylidene fluoride (PVDF) sheets (ImmobilonTM-P, Millipore Corp., Bedford, MA, USA) and a transblot apparatus (BioRad). We used monoclonal antibodies against cyclin D1 (Cell Signalling Technology, Denver, MA, USA), Cyclin A (Abcam plc, Cambridge, UK), Cdk4, Cdk2 and Cyclin E (Santa Cruz Biotechnology, Santa Cruz, CA, USA), and peroxidase-conjugated IgG secondary antibody (Amersham Corp., Arlington Heights, IL, USA). Immunoreactive protein was visualized using a chemiluminescence-based detection kit following the manufacturer's protocol (ECL kit; Amersham Corp.).
Trizol reagent and DNAse I were purchased from Invitrogen (Invitrogen Corporation, Carlsbad, CA, USA). cDNA was reverse transcribed using a First-Strand Synthesis System kit from Invitrogen Corporation. Real-time quantitative PCR was performed using the ABI PRISM 7700 Sequence Detection System (Applied Biosystems, Foster City, CA, USA). Real-time PCR was carried out using an SYBR Green PCR kit (QuantiTect SYBR Green PCR Kit, QIAGEN). Other chemical reagents were of analytical quality and purchased from Sharlab (Barcelona, Spain).
Cell culture
The dopaminergic neuroblastoma B65 cell line was purchased from the European Collection of Cell Cultures (ECACC, Salisbury, UK). Cells were cultured at 200 cells/mm2 in DMEM media containing 10% FCS and 2 mM glutamine for 24 hrs prior to addition of lithium chloride and SB-415286.
Treatment of B65 and cell proliferation assay
To investigate the antiproliferative effect of both compounds, SB-415286 and lithium were added to the medium at defined concentrations ranging from 1 to 15 mM and 5 to 44 μM for 24 hrs, respectively.
To assess the cell proliferation, we used the MTT [3-(4,5-dimethylthiazol-2-yl)-2,5-diphenyl tetrazolium] method. MTT was added to the cells at a final concentration of 250 mM and incubated for 1 hr to allow the reduction of MTT to produce a dark blue formazan product. The medium was removed, and cells were dissolved in dimethylsulfoxide. The production of formazan was measured by absorbency changes at 595 nm using a microplate reader. Viability results were expressed as percentages. The absorbance measured from non-treated cells was taken to be 100%.
Analysis of DNA fragmentation by flow cytometry
Apoptosis was measured 24 hrs after drug treatment. In brief, the culture medium was removed, cells were washed in PBS and flow cytometry experiments were carried out by adding propidium iodide (PI, 75 μg/ml) 1 hr before analysis. The instrument was set up with a standard configuration: excitation of the sample was performed using a 488 nm air-cooled argon-ion laser at 15-mW power. Forward scatter, side scatters and red (620 nm) fluorescence for PI were measured. Optical alignment was based on optimized signal from 10 nm fluorescent beads. Time was used as a control for instrument stability; red fluorescence was projected on a 1024 non-parametrical histogram. Aggregates were excluded, gating single cells by their area versus peak fluorescence signal.
Assay of caspase 3 enzymatic activity
We used the colorimetric substrate Ac-DEVD-p-nitroaniline for the determination of caspase 3 according to the following method: B65 cells were collected in a lysis buffer (50 mM Hepes, 100 mM NaCl, 0.1% CHAPS, 0.1 mM EDTA, pH 7.4), 24 hrs after treatments, and 50 μg/ml of protein was incubated with 200 mM of colorimetric substrate in assay buffer (50 mM HEPES, 100 mM NaCl, 0.1% CHAPS, 10 mM dithiothreitol, 0.1 mM EDTA, pH 7.4) in 96-well plates at 37°C for 24 hrs. Absorbance of the cleaved product was measured at 405 nm. Results were expressed as a percentage of sample absorbance over control values.
Western blot analysis
Aliquots of cell homogenate, containing 15 μg of protein per sample, were analysed by Western blot. In brief, samples were placed in sample buffer [0.5 M Tris-HCl pH 6.8, 10% glycerol, 2% (w/v) SDS, 5% (v/v) 2-b-mercaptoethanol, 0.05% bromophenol blue] and denatured by boiling at 95–100°C for 5 min. Samples were separated by electrophoresis on 10% acrylamide gels. Thereafter, proteins were transferred to polyvinylidene fluoride (PVDF) sheets using a transblot apparatus. Membranes were blocked overnight with 5% non-fat milk dissolved in TBS-T buffer (50 mM Tris; 1.5% NaCl, 0.05% Tween 20, pH 7.5). They were then incubated with primary monoclonal antibodies against GSK-3 ser9, cyclin D1, cyclin E, cyclin A, Cyclin B1, cdk4, cdk2, cdc2, cdc2 tyr15, AIF and SIRT2 (1:500) and actin-beta (1:20,000). After 12 hrs of incubation, blots were washed thoroughly in TBS-T buffer and incubated for 1 hr with a peroxidase-conjugated IgG secondary antibody (1:3000). Immunoreactive protein was visualized using a chemiluminescence-based detection kit. Protein load was monitored using phenol red staining of the blot membrane or immunodetection of actin-beta.
Reverse transcriptase-PCR
Total RNA was extracted from B65 cells using Trizol reagent according to the manufacturer's instructions. Isolated RNA was treated for 7 min. at room temperature with amplification grade DNase I in order to remove contaminating genomic DNA. First-strand cDNA was reverse transcribed from 2 μg of total RNA using a First-Strand Synthesis System kit from Invitrogen. β-actin primers were designed to cover a large expanse of intronic sequence between exons 2 and 3 of the rat gene (Table 1). Non-reactivity of the primers with contaminating genomic DNA was tested by the inclusion of controls that omitted the reverse transcriptase enzyme from the cDNA synthesis reaction (RT-negative controls). The lack of primer dimerization or non-specific PCR product bands was also tested.
Table 1.
Primer sequences for β-actin, cdk4, cdk2, cyclin D1, cyclin E, cdc25a and used in real-time PCR experiments
| Gene symbol | Primer sequence 5′→ 3′ | Product size (bp) |
|---|---|---|
| Forward: ATG GAT GAC GAT ATC GCT GCG | ||
| β-Actin | Reverse: CAG GGT CAG GAT GCC TCT CTT | 200 |
| Forward: GAC TCC CAC AAC ATC CAG ACC | ||
| Cdk4 | Reverse: ACT CGG AGG AGG AGA AAT CCT | 87 |
| Forward: CTT AAG AAA ATC CGG CTC GAC | ||
| Cdk2 | Reverse: ATC CAG CAG CTT GAC GAT GTT A | 111 |
| Forward: TGC ATC TAC ACT GAC AAC TCT AT | ||
| Cyclin D1 | Reverse: GCA TTT TGG AGA GGA AGT GTT C | 131 |
| Forward: TGA AAT TGG TGT CGG TGC CTA T | ||
| Cyclin E | Reverse: TGC TCC TCC ATT AGG AAC TCT CAC | 103 |
| Forward: ATA TGT ACG GGA ACG AGA TAG G | ||
| Cdc25a | Reverse: TTG GTG CGG AAC TTC TTT AGG T | 179 |
| Forward: ATG GAA GGA GCT GGA AGA CCT | 191 | |
| Sirt2 | Reverse: GAC TTT CTA GGG GAG ACG GTA |
Real-time PCR quantification
Determination of relative gene expression was performed by real-time quantitative PCR, using the ABI PRISM 7700 Sequence Detection System. Real-time PCR was carried out using an SYBR Green PCR kit. Thus, primer concentration and PCR melting temperature were adjusted to avoid non-specific PCR products, as SYBR Green binds non-specifically to each double-stranded DNA product formed during the amplification. The optimum temperature was that which gave the maximum reading for the specific product when the non-specific product could no longer be detected.
Once the optimum temperature had been determined, quantitative PCR was carried out using the following thermal cycling programme: Stage 1 was undertaken at 95°C for 15 min.; Stage 2 consisted of three steps: 95°C for 15 sec.; 60°C for 30 sec. and 72°C for 30 sec. Stage 2 was repeated for 40 cycles. The relative mRNA expression was calculated by the standard curve method. In brief, both β-actin and target gene amplifications were run in separate tubes. Standard curves were obtained for all genes by using decreasing amounts of cDNA template. PCR reactions were performed in duplicate for standard curves whereas samples were tested in triplicate, at a final volume of 25 μl in all cases. For each cDNA template, the cycle threshold (Ct) necessary to detect the amplified product was determined and semi-logarithmic standard plots were drawn (Ct versus cDNA amount). The calculations were performed according to the comparative threshold cycle (Ct) method, which uses the formula 2−ΔΔCt to calculate the expression of target genes normalized to a calibrator (n-fold). The threshold cycle Ct indicates the cycle number by which the amount of amplified target reaches a fixed threshold. The Ct data for all target genes and housekeeping genes in each sample were used to create ΔCt values [ΔCt = Ct (target gene)−Ct (housekeeping gene)]. In our experiments, we used β-actin as a reference (housekeeping) gene. Thereafter, ΔΔCt values were calculated by subtracting the calibrator from the ΔCt value of each target. The relative quantity (RQ), or n-fold, values were calculated with the equation: RQ = 2−ΔΔCt. Real-time PCR data were quantified using the SDS 2.2 software package.
Non-reactivity of the primers was tested by the inclusion of controls that lacked the cDNA template (which was replaced by buffer). Genomic DNA contamination was tested by the inclusion of total RNA samples from RT-PCR reactions lacking the reverse transcriptase enzyme. The absence of non-specific PCR product was tested in all samples by analysing a melting temperature profile using the 7700 Sequence detector. The programme consisted of Stage 1, 95°C for 1 min.; Stage 2, 60°C for 1 min. followed by an increase in temperature up to a final temperature of 95°C at stage 3 with a 19 min. ramp time. Fluorescence data were collected for each PCR reaction and melting graphs were drawn to confirm the presence of a single specific product.
Statistical analysis
Data are given as the mean ± S.E.M. of at least three experiments for protein determination and at least two independent experiments for gene expression analysis. In protein experiments, data were analysed by ANOVA followed by post hoc Tukey-Kramer multiple comparison tests. P-values lower than 0.05 were considered significant.
Results
Expression of GSK-3 in B65 neuroblastoma cell line
Levels of GSK-3, and specifically its inactive form pGSK-3 Ser9, were evaluated in B65 cells by Western blot analysis at the concentration of Li+ 10 mM. We found that Li+ significantly increased the inactivated form of GSK-3, phosphorylated at serine 9 (Fig. 1). However, SB-415286 did not change the phosphorylation pattern of GSK-3 at Ser9. These data indicate that this compound inhibits GSK-3 by a competitive mechanism at the ATP binding site, while Li+ inhibits this enzyme indirectly through AKT activation and directly by a competitive mechanism with Mg2+. Thus, in this cellular model, GSK-3 is present and lithium exerts its effects by phosphorylation mechanisms.
Figure 1.
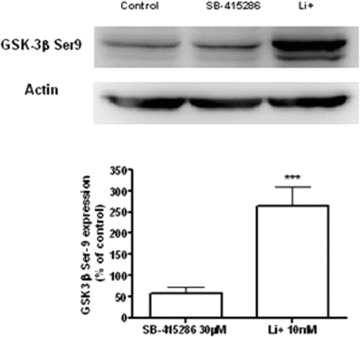
The effect of Li+ 10 mM and SB-415286 30 μM on pGSK-3 Ser9 in B65 neuroblastoma cell line. Li+-induced site-specific modifications of pGSK-3 Ser9 phosphorylation. Phosphorylated pGSK-3 Ser9 was quantified as densitometry values, which were normalized to β-actin. The data was expressed as mean ± S.D. with four independent experiments. ***P < 0.001*versus Li+-treated group.
Effects of lithium and SB-415286 on B65 cell proliferation and apoptosis
To assess whether GSK-3 inhibition affects the proliferation of B65 neuroblastoma cells, we examined the effects of different concentrations of GSK-3 inhibitors using the MTT method (Fig. 2). Cells were treated with increasing concentrations of Li+ (1–15 mM) or SB-415286 (1–44 μM) for up to 72 hrs. Both compounds showed an inhibitory action on the proliferation of B65 neuroblastoma cells. The growth-inhibitory effects were dose-dependent. Higher doses of both compounds (15 mM and 44 μM, for Li+ and SB-415286, respectively) caused significant inhibition of cell proliferation.
Figure 2.
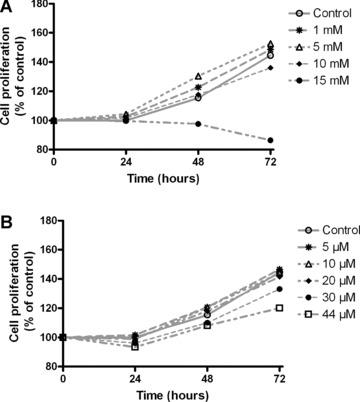
(A) Time-course of the effects on cell proliferation of Li+ in B65 rat neuroblastoma cells. Exposure to different concentrations of Li+ (1–15 mM) up to 72 hrs reduced the cell proliferation of B65 cells evaluated by the MTT method. (B) Time-course of the effects on cell proliferation of SB-415286 in B65 rat neuroblastoma cells. Exposure to different concentrations of SB-415286 (5–44 μM) up to 72 hrs reduced the cell proliferation of B65 cells. The data was expressed as percentage of control with four independent experiments.
Increased apoptotic death was observed in cells treated with lithium or SB-415286, with average values of 13.5% and 75.1%, respectively, at the higher concentrations of both compounds (Fig. 3). In order to clarify the pathway implicated in the apoptotic death of B65 cells, we determined the enzymatic activity of caspase 3, and while SB-415286 induced a significant increase, Li+ had no effect (Fig. 4). Furthermore, a pan inhibitor of caspases such as zVAD-fmk did not block the apoptosis induced by SB-415286 (Fig. 4). Therefore, these data suggest the involvement of a caspase-independent mechanism in the apoptosis caused by the inhibition of GSK-3 in B65 cells. We also analysed the implication of caspase-independent apoptotic pathways, determining the levels of nuclear apoptosis-inducing factor (AIF) in cells exposed to lithium or SB-415286; no significant changes were observed (Fig. 5). Collectively, these results indicate that neither caspase activation nor mitochondrial AIF release are involved in the observed apoptosis induced by GSK-3 inhibitors.
Figure 3.
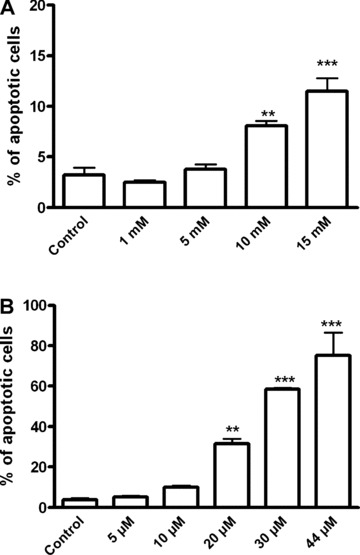
Evaluation of DNA fragmentation by flow cytometry in B65 cells treated with Li+ (1–15 mM) and SB-415286 (5–44 μM). The percentage of nuclei with subdiploid peak (apoptotic peak) was about 15% for Li+ 15 mM and about 81.51% for SB-415286 44 μM, both at 24 hrs of treatment. Statistical significance was determined by one-way ANOVA followed by Tukey's tests: *P < 0.05, **P < 0.01,***P < 0.001 versus control.
Figure 4.
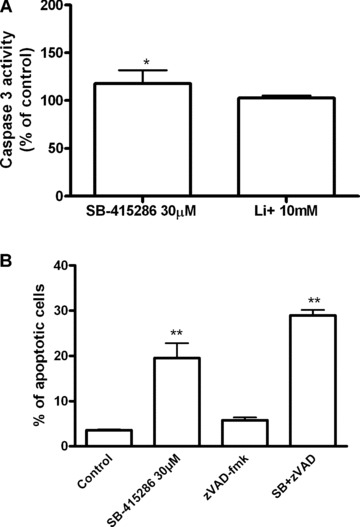
(A) Bar chart showing caspase-3 activity in B65 neuroblastoma cells exposed to Li+ 10 mM and SB-415286 30 μM, for 24 hrs. Bars represent means ± S.E.M. of four or five separate experiments with four or five different culture preparations (n= 4–5). (B) Evaluation of anti-apoptotic effects of zVAD-fmk on SB-415286 20 μM. The percentage of nuclei with subdiploid peak (apoptotic peak) was about 30% for SB-415286 at 24 hrs of treatment and zVAD-fmk did not prevent apoptosis. Statistical significance was determined by one-way ANOVA followed by Tukey's tests: *P < 0.05 versus control.
Figure 5.
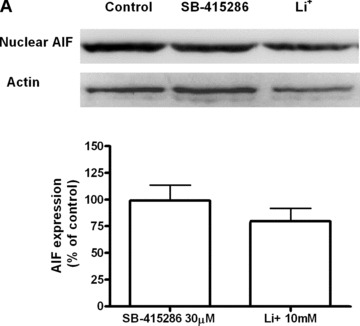
Immunoblots showing the expression of AIF in B65 neuroblastoma cells treated with Li+ 10 mM and SB-415286 30 μM, for 24 hrs. The band intensities levels were calculated as percentages of the control values, which were normalized to β-actin. Bars represent means ± S.E.M. of four or five separate experiments with four or five different culture preparations (n= 4–5). The statistical analysis was carried out with the one-way ANOVA followed by Tukey's test.
Effects of lithium and SB-415286 on cell cycle
To examine the phase of the cell-cycle in which cells were arrested after treatment with Li+ (1–15 mM) and SB-415286 (1–44 μM), DNA was stained by propidium iodide and analysed by flow cytometry (Fig. 6). Lithium increased the fraction of cells in the S phase of the cell cycle at 15 mM (about 50%; ***P < 0.001) (Table 2). The number of cells arrested in the G2/M phase increased at a concentration of 15 mM (about 38% at the highest concentration evaluated). On the other hand, when B65 cells were treated with SB-415286, the fraction of cells in the G2/M phase increased in a dose-dependent manner. For example, when cells were exposed to 20 μM SB-415286, the fraction of cells in G2/M was about 42% (***P < 0.001), at 30 μM about 73% (***P < 0.001) and at 44 μM about 93%*** (P < 0.001) (Fig. 6).
Figure 6.
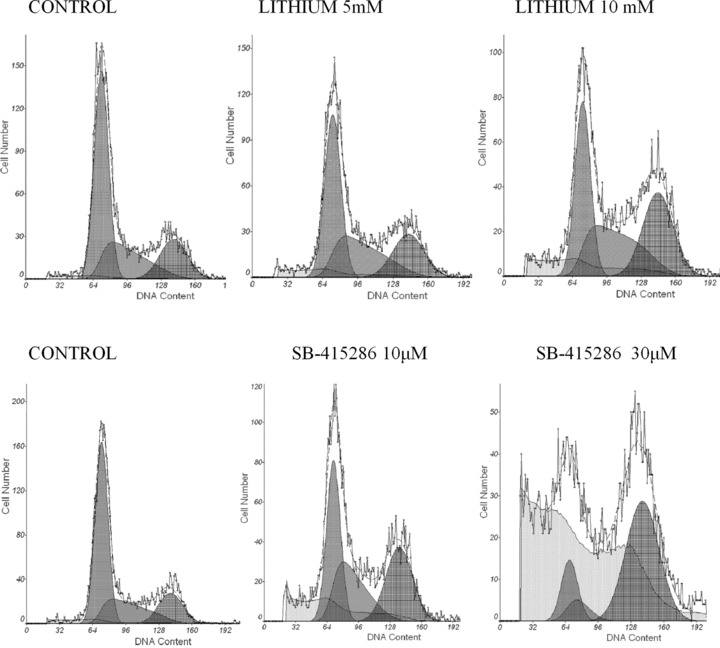
Representative flow cytometric analysis of cell cycle inhibition by Li+ and SB-415286.
Table 2.
Cell cycle analysis of B65 Cells after treatment with SB-415286 and lithium
| Cell cycle phase: | Treatment | G1 | S | G2/M |
|---|---|---|---|---|
| SB-415286 | Control | 55.55 ± 0.7 | 25.46 ± 2.12 | 18.99 ± 1.41 |
| 5 μM | 48.47 ± 7.0 | 26.57 ± 1.73 | 24.96 ± 6.65 | |
| 20 μM | 30.37 ± 5.56 | 26.87 ± 1.15 | 42.76 ± 6.50 | |
| 30 μM | 18.78 ± 0.70 | 8.3 ± 1.41 | 72.92 ± 1.42 | |
| Lithium | 44 μM | 6.92 ± 7.02 | 0 ± 0 | 93.08 ± 7.50 |
| 1 mM | 53.31 ± 1.15 | 27.38 ± 1.52 | 19.32 ± 1.73 | |
| 5 mM | 46.58 ± 1.0 | 32.84 ± 2.08 | 20.58 ± 2.51 | |
| 10 mM | 37.73 ± 3.51 | 33.12 ± 0.57 | 29.15 ± 3.60 | |
| 15 mM | 12.20 ± 2.64 | 50.19 ± 6.11 | 37.62 ± 4.61 |
Effects of lithium and SB-415286 on the expression of cell cycle proteins in B65 neuroblastoma cells
Cell cycle analysis, measured by flow cytometry, showed a dose-dependent inhibition of B65 proliferation mediated by GSK3 inhibitors, and thus additional experiments were performed to characterize the expression of cell-cycle proteins. After 24 hrs of treatment, Western blotting analysis further confirmed that Li+ and SB-415286 significantly increased the expression of cell cycle proteins related to the G1-phase (Fig. 7). With respect to the expression of cell cycle regulatory proteins involved at the G2/M boundary (Fig. 8), neither drug modified the expression of cyclin B. However, we found a significant increase in the expression of cyclin A, cdc2 and the phosphorylated form of cdc2. Therefore, these compounds specifically impair the activity of cdc2, which could explain, in part, the G2/M arrest and the inhibition of cell cycle proliferation. With respect to the analysis of changes in gene expression, neither drug significantly changed cdk2, cdk4 or cdc2 gene expression (Fig. 9). By contrast, significant up-regulation of cyclin D and cyclin E transcriptional activity was observed.
Figure 7.
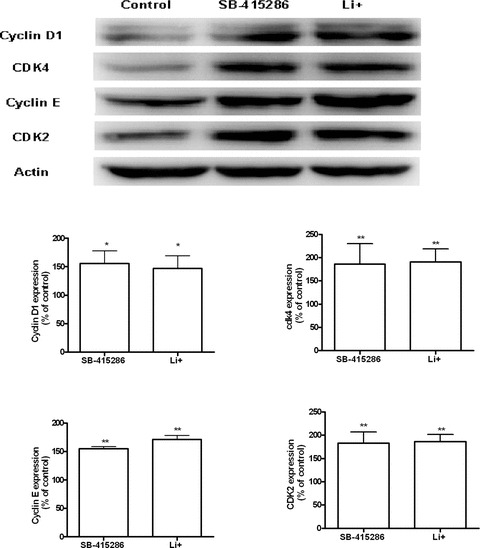
Immunoblots showing the expression of cell cycle proteins in B65 cells treated with Li+10 mM and SB-415286 30 μM, for 24 hrs: Cdk4, Cdk2, Cyclins D1, and E. The band intensities levels were calculated as percentages of the control values, which were normalized to β-actin. Bars represent means ± S.E.M. of four or five separate experiments with four or five different culture preparations (n= 4–5). Statistical significance was determined by one-way ANOVA followed by Tukey's tests: *P < 0.05, **P < 0.01 versus control.
Figure 8.
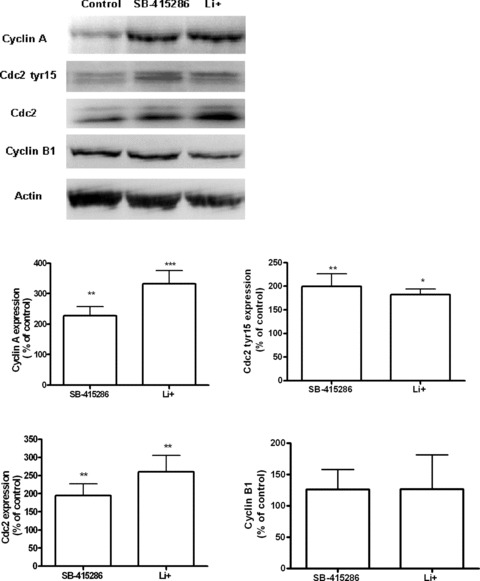
Immunoblots showing the expression of cell cycle proteins in B65 cells treated with Li+10 mM and SB-415286 30 μM, for 24 hrs: Cyclin A, Cdc2 tyr15, Cdc2, Cyclin B1. The band intensities levels were calculated as percentages of the control values, which were normalized to β-actin. Bars represent means ± S.E.M. of four or five separate experiments with four or five different culture preparations (n= 4–5). Statistical significance was determined by one-way ANOVA followed by Tukey's tests: *P < 0.05, **P < 0.01 versus control.
Figure 9.

Fold increase of mRNA expression levels for cyclin D1, Cdk4 and Cdk2, after 24 hrs of treatment with Li+10 mM and SB-415286 30 μM. Treatment with melatonin caused significant down-regulation of cyclin D1, Cdk2 and Cdk4 genes, whereas roscovitine decreased significantly the expression of Cdk4 gene. Data are given as mean ± S.E.M. from three independent PCR experiments. Data were analysed by ANOVA followed by Tukey-Kramer multiple comparisons test, *P < 0.05, **P < 0.01 versus control values.
Changes in the expression of SIRT2 after treatment with GSK-3 inhibitors
Although SB-415286 and Li+ showed selective G2/M inhibition mediated by Cdc2, we studied an additional mechanism involved in cell cycle arrest that is regulated by Cdc2, namely SIRT2. Expression of SIRT2 significantly increased after treatment with SB-415286, while lithium had no effect (Fig. 10). Furthermore, gene expression analysis showed a similar pattern (Fig. 9).
Figure 10.
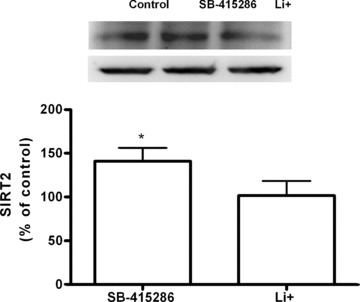
(A) Immunoblot showing the expression of SIRT2 cell cycle proteins in B65 cells treated with Li+10 mM and SB-415286 30 μM, for 24 hrs. The band intensities levels were calculated as percentages of the control values, which were normalized to β-actin. Bars represent means ± S.E.M. of four or five separate experiments with four or five different culture preparations (n= 4–5). Statistical significance was determined by one-way ANOVA followed by Tukey's tests: *P < 0.05 versus control. (B) Fold increase of mRNA expression levels for SIRT2 after 24 hrs of treatment with Li+ 10 mM and SB-415286 30 μM. Treatment with SB-415286 30 μM caused a significant up-regulation of SIRT2 gene, whereas Li+ 10 mM did not modify the expression of SIRT2 gene. Data are given as mean ± S.E.M. from three independent PCR experiments. Data were analysed by ANOVA followed by Tukey-Kramer multiple comparisons test, *P < 0.05 versus control values.
Discussion
The aim of the present study was to evaluate the molecular pathways involved in the inhibition of B65 rat neuroblastoma cell proliferation by the GSK-3 inhibitors, Li+ and SB-415286. First, we showed that GSK-3 is expressed in B65 cells and that Li+ inhibits this expression. Recent data implicate GSK-3 in the regulation of cell proliferation and indicate that GSK-3 inhibitors exert an antiproliferative effect [10, 36, 38–40]. However, previous studies demonstrated a dual role of lithium in cell proliferation, inhibiting or increasing cell growth depending on cellular type [19, 20]. In this study, GSK-3 inhibition by Li+ and SB-415286 augments cell cycle arrest specifically in G2/M and, we also conclude that both drugs show a common mechanism in the inhibition of cell cycle by regulating the phosphorylation of Cdc2.
When we analysed specifically the effects of Li+ and SB-415286 on the cell cycle by flow cytometry, we found a different pattern of action for each drug. For instance, SB-415286 significantly inhibits the G0/G1 and S phase and increases G2/M and apoptosis. However, although lithium also increased the percentage of cells in G2/M phase the pattern of cell cycle inhibition was not the same that SB-415286. The finding that GSK-3 inhibitors increase the percentage of cells at G2/M is in line with previous studies [5, 9]. Moreover, Western blot analysis of the cell cycle showed a significant increase in the expression of all proteins involved in G0/G1 phase giving support to the hypothesis that G2/M phase is the target involved in cell cycle arrest mediated by GSK-3 inhibition.
We then studied the potential mechanism by GSK-3 inhibitors to cause G2/M cell-cycle arrest. Cyclin-dependent kinase Cdc2 complexes with cyclin B1 regulates the passage through G2/M transition. We examined whether Li+ and SB-415286 affect the expression of these proteins. Our data indicate both compounds increased the levels of Cdc2 in B65 cells. However, we found no changes in cyclin B1 expression. The mechanism involved in Cdc2 regulation is mediated by phosphorylation. Thus, cdc2 is inactivated by phosphorylation of amino acid residues Thr14 and Tyr 15. We found that Li+ and SB-415286 increased the level of phosphorylated Cdc2 at tyrosine 15 (inactivated form). Therefore, treatment of B65 cells with GSK-3 inhibitors decreased cdc2 activity, which could explain the effect of these compounds on cell-cycle arrest and impaired cell proliferation. Our results on Li+ are consistent with previous studies performed by Smits et al. 1999, which demonstrated that lithium prevents the activation of the mitotic cyclin B/cdc2 complex, through interference with Tyr-15 phosphorylation [41].
Because our data suggest a key role for Cdc2 activation in the process of cell cycle inhibition, we studied an additional target of this pathway, namely SIRT2. Recent studies have implicated SIRT2 in the control of the cell cycle [32–35]. Furthermore, in different cell models, SIRT2 reduces cellular proliferation, while SIRT2 expression is down-regulated in human gliomas [32, 33]. Likewise, drugs that induce microtubule alteration such as nocodazole inhibited cell cycle progression in mitosis by SIRT2 activation [35, 42–44]. We found that SIRT2 expression increased after treatment with SB-41528641, while Li+ had no effect. Since our data suggest that unlike Li+ and SB-41528641 have a potent effect on the G2/M phase and also induces apoptosis, we propose that the different effect on the cell cycle may be explained by the selective SIRT2 protein and mRNA expression.
We also analysed the mechanism implicated in GSK-3 inhibition-induced apoptosis. The apoptotic process is associated with the activation of a specific series of cysteine proteases, named caspases [45–47]. In fact, caspase activation is a marker of the apoptotic process, more specifically, caspase-3 is the responsible of the cleavage of substrates involved in the regulation of nuclear apoptotic process. Our data indicated different mechanisms for Li+ and SB-415286 with reference to B65 cell apoptosis. Thus, while Li+-induced cell cycle arrest was not associated with caspase-3 activation, SB-415286 significantly increased this enzyme and also the apoptotic levels of B65 cells. Moreover, when zVAD-fmk was added to the cultures treated with SB-415286, this caspase inhibitor did not attenuate the apoptotic process. Collectively, these results suggest that although caspase-3 is activated in this process, the activation of this enzyme is not a key event in this apoptotic route. In order to evaluate the activation of the caspase-independent pathway, we studied AIF-release from mitochondria to the nucleus. Our results demonstrated that there is no change in nuclear AIF after treatment with GSK-3 inhibitors, and thus nuclear AIF is not involved in this apoptotic process.
The effect of Li+ and SB-415286 on cdc2 is important because there may be other potential pharmacological applications of these drugs. For instance, re-entry in the cell cycle constitutes a potential route involved in the process of neuronal cell death in all neurodegenerative diseases [48–50]. In Alzheimer's disease cdc2 could be activated in neurons and human brain and cyclin B-Cdc2 might be involved in the hyperphosphorylation of tau and also in the regulation of neuronal apoptosis [51, 52]. Furthermore, in cultures of cerebellar granule cells, activation of cdc2 by the apoptotic stimuli of serum and potassium withdrawal connects re-entry in the cell cycle with mitochondrial apoptosis activation through bad phosphorylation [53, 54].
In summary, the results of the present study provide evidence that GSK-3 inhibitors induce G2/M arrest in rat B65 neuroblastoma cells through regulation of Cdc2 activity, specifically the phosphorylation of Cdc2 and thus inhibition of this enzyme. We also demonstrated an additional pathway regulated by SB-415286 involving the SIRT2 protein. The G2/M arrest is also accompanied by a caspase-independent apoptotic process that is not modulated by AIF. Additional studies are needed to identify the specific mechanism of GSK-3 inhibitors-mediated apoptosis in proliferating cells, as well as the precise role of the G2/M phase in cell cycle arrest.
Acknowledgments
This study was supported by grants from Spain's Ministerio de Educación y Ciencia (SAF2005-01604, SAF2006-13092) and to the TV3 Marathon. We are grateful to the Autonomous Government of Catalonia for supporting research groups (2005/SGR00893). We thank the Language Assessment Service of the University of Barcelona for revising the manuscript.
References
- 1.Forde JE, Dale TC. Glycogen synthase kinase 3: a key regulator of cellular fate. Cell Mol Life Sci. 2007;64:1930–44. doi: 10.1007/s00018-007-7045-7. [DOI] [PMC free article] [PubMed] [Google Scholar]
- 2.Phiel CJ, Klein PS. Molecular targets of lithium action. Annu Rev Pharmacol Toxicol. 2001;41:789–813. doi: 10.1146/annurev.pharmtox.41.1.789. [DOI] [PubMed] [Google Scholar]
- 3.Chuang DM, Manji HK. In search of the Holy Grail for the treatment of neurodegenerative disorders: has a simple cation been overlooked. Biol Psychiatry. 2007;62:4–6. doi: 10.1016/j.biopsych.2007.04.008. [DOI] [PMC free article] [PubMed] [Google Scholar]
- 4.Gould TD, Picchini AM, Einat H, et al. Targeting glycogen synthase kinase-3 in the CNS: implications for the development of new treatments for mood disorders. Curr Drug Targets. 2006;7:1399–409. doi: 10.2174/1389450110607011399. [DOI] [PubMed] [Google Scholar]
- 5.Meijer L, Flajolet M, Greengard P. Pharmacological inhibitors of glycogen synthase kinase 3. Trends Pharmacol Sci. 2004;25:471–80. doi: 10.1016/j.tips.2004.07.006. [DOI] [PubMed] [Google Scholar]
- 6.Gould TD, Manji HK. Glycogen synthase kinase-3: a putative molecular target for lithium mimetic drugs. Neuropsychopharmacology. 2005;30:1223–337. doi: 10.1038/sj.npp.1300731. [DOI] [PubMed] [Google Scholar]
- 7.Avila J, Hernández F. GSK-3 inhibitors for Alzheimer's disease. Expert Rev Neurother. 2007;7:1527–33. doi: 10.1586/14737175.7.11.1527. [DOI] [PubMed] [Google Scholar]
- 8.Wang W, Yang Y, Ying C, et al. Inhibition of glycogen synthase kinase-3beta protects dopaminergic neurons from MPTP toxicity. Neuropharmacology. 2007;52:1678–84. doi: 10.1016/j.neuropharm.2007.03.017. [DOI] [PubMed] [Google Scholar]
- 9.Ougolkov AV, Billadeau DD. Targeting GSK-3: a promising approach for cancer therapy. Future Oncol. 2006;2:91–100. doi: 10.2217/14796694.2.1.91. [DOI] [PubMed] [Google Scholar]
- 10.Sun A, Shanmugam I, Song J, et al. Lithium suppresses cell proliferation by interrupting E2F-DNA interaction and subsequently reducing S-phase gene expression in prostate cancer. Prostate. 2007;67:976–88. doi: 10.1002/pros.20586. [DOI] [PubMed] [Google Scholar]
- 11.Takahashi-Yanaga F, Sasaguri T. GSK-3beta regulates cyclin D1 expression: a new target for chemotherapy. Cell Signal. 2008;20:581–9. doi: 10.1016/j.cellsig.2007.10.018. [DOI] [PubMed] [Google Scholar]
- 12.Ryves WJ, Dajani R, Pearl L, et al. Glycogen synthase kinase-3 inhibition by lithium and beryllium suggests the presence of two magnesium binding sites. Biochem Biophys Res Commun. 2002;290:967–72. doi: 10.1006/bbrc.2001.6305. [DOI] [PubMed] [Google Scholar]
- 13.Yeste-Velasco M, Folch J, Trullàs R, et al. Glycogen synthase kinase-3 is involved in the regulation of the cell cycle in cerebellar granule cells. Neuropharmacology. 2007;53:295–307. doi: 10.1016/j.neuropharm.2007.05.012. [DOI] [PubMed] [Google Scholar]
- 14.García-Pérez J, Avila J, Díaz-Nido J. Lithium induces morphological differentiation of mouse neuroblastoma cells. J Neurosci Res. 1999;57:261–70. doi: 10.1002/(SICI)1097-4547(19990715)57:2<261::AID-JNR12>3.0.CO;2-4. [DOI] [PubMed] [Google Scholar]
- 15.Karlovic D, Jakopec S, Dubravcic K, et al. Lithium increases expression of p21(WAF/Cip1) and survivin in human glioblastoma cells. Cell Biol Toxicol. 2007;23:83–90. doi: 10.1007/s10565-006-0126-9. [DOI] [PubMed] [Google Scholar]
- 16.Mao CD, Hoang P, DiCorleto PE. Lithium inhibits cell cycle progression and induces stabilization of p53 in bovine aortic endothelial cells. J. Biol. Chem. 2001;276:26180–8. doi: 10.1074/jbc.M101188200. [DOI] [PubMed] [Google Scholar]
- 17.Facci L, Stevens DA, Skaper SD. Glycogen synthase kinase-3 inhibitors protect central neurons against excitotoxicity. Neuroreport. 2003;14:1467–70. doi: 10.1097/00001756-200308060-00012. [DOI] [PubMed] [Google Scholar]
- 18.Coghlan MP, Culbert AA, Cross DA, et al. Selective small molecule inhibitors of glycogen synthase kinase-3 modulate glycogen metabolism and gene transcription. Chem Biol. 2007;88:793–803. doi: 10.1016/s1074-5521(00)00025-9. [DOI] [PubMed] [Google Scholar]
- 19.Cao Q, Lu X, Feng YJ. Glycogen synthase kinase-3beta positively regulates the proliferation of human ovarian cancer cells. Cell Res. 2006;16:671–7. doi: 10.1038/sj.cr.7310078. [DOI] [PubMed] [Google Scholar]
- 20.Christensen BM, Kim YH, Kwon TH, et al. Lithium treatment induces a marked proliferation of primarily principal cells in rat kidney inner medullary collecting duct. Am J Physiol Renal Physiol. 2006;291:F39–48. doi: 10.1152/ajprenal.00383.2005. [DOI] [PubMed] [Google Scholar]
- 21.Erdal E, Ozturk N, Cagatay T, et al. Lithium-mediated downregulation of PKB/Akt and cyclin E with growth inhibition in hepatocellular carcinoma cells. Int J Cancer. 2005;115:903–10. doi: 10.1002/ijc.20972. [DOI] [PubMed] [Google Scholar]
- 22.Mazor M, Kawano Y, Zhu H, et al. Inhibition of glycogen synthase kinase-3 represses androgen receptor activity andprostate cancer cell growth. Oncogene. 2004;23:7882–92. doi: 10.1038/sj.onc.1208068. [DOI] [PubMed] [Google Scholar]
- 23.Garcea G, Manson MM, Neal CP, et al. Glycogen synthase kinase-3 beta; a new target in pancreatic cancer. Curr Cancer Drug Targets. 2007;7:209–15. doi: 10.2174/156800907780618266. [DOI] [PubMed] [Google Scholar]
- 24.Kunnimalaiyaan M, Vaccaro AM, Ndiaye MA, et al. Inactivation of glycogen synthase kinase-3beta, a downstream target of the raf-1 pathway, is associated with growth suppression in medullary thyroid cancer cells. Mol Cancer Ther. 2007;6:1151–8. doi: 10.1158/1535-7163.MCT-06-0665. [DOI] [PubMed] [Google Scholar]
- 25.Di Daniel E, Mudge AW, Maycox PR. Comparative analysis of the effects of four mood stabilizers in SH-SY5Y cells and in primary neurons. Bipolar Disord. 2005;7:33–41. doi: 10.1111/j.1399-5618.2004.00164.x. [DOI] [PubMed] [Google Scholar]
- 26.Diehl JA, Cheng M, Roussel MF, et al. Glycogen synthase kinase-3beta regulates cyclin D1 proteolysis and subcellular localization. Genes Dev. 1998;15:3499–511. doi: 10.1101/gad.12.22.3499. [DOI] [PMC free article] [PubMed] [Google Scholar]
- 27.Dong J, Peng J, Zhang H, et al. Role of glycogen synthase kinase 3beta in rapamycin-mediated cell cycle regulation and chemosensitivity. Cancer Res. 2005;65:1961–72. doi: 10.1158/0008-5472.CAN-04-2501. [DOI] [PubMed] [Google Scholar]
- 28.Karim R, Tse G, Putti T, et al. The significance of the Wnt pathway in the pathology of human cancers. Pathology. 2004;36:120–8. doi: 10.1080/00313020410001671957. [DOI] [PubMed] [Google Scholar]
- 29.Massagué J. G1 cell-cycle control and cancer. Nature. 2004;432:298–306. doi: 10.1038/nature03094. [DOI] [PubMed] [Google Scholar]
- 30.Stewart ZA, Westfall MD, Pietenpol JA. Cell-cycle dysregulation and anticancer therapy. Trends Pharmacol Sci. 2003;24:135–49. doi: 10.1016/S0165-6147(03)00026-9. [DOI] [PubMed] [Google Scholar]
- 31.Hiratsuka M, Inoue T, Toda T, et al. Proteomics-based identification of differentially expressed genes in human gliomas: down-regulation of SIRT2 gene. Biochem Biophys Res Commun. 2003;309:558–66. doi: 10.1016/j.bbrc.2003.08.029. [DOI] [PubMed] [Google Scholar]
- 32.Diaz-Corrales FJ, Asanuma M, Miyazaki I, et al. Rotenone induces disassembly of the Golgi apparatus in the rat dopaminergic neuroblastoma B65 cell line. Neurosci Lett. 2004;354:59–63. doi: 10.1016/j.neulet.2003.09.059. [DOI] [PubMed] [Google Scholar]
- 33.Inoue T, Hiratsuka M, Osaki M, et al. SIRT2, a tubulin deacetylase, acts to block the entry to chromosome condensation in response to mitotic stress. Oncogene. 2007;26:945–57. doi: 10.1038/sj.onc.1209857. [DOI] [PubMed] [Google Scholar]
- 34.Inoue T, Hiratsuka M, Osaki M, et al. The molecular biology of mammalian SIRT proteins: SIRT2 in cell cycle regulation. Cell Cycle. 2007;6:1011–88. doi: 10.4161/cc.6.9.4219. [DOI] [PubMed] [Google Scholar]
- 35.Jackson JR, Patrick DR, Dar MM, et al. Targeted anti-mitotic therapies: can we improve on tubulin agents. Nat Rev Cancer. 2007;7:107–17. doi: 10.1038/nrc2049. [DOI] [PubMed] [Google Scholar]
- 36.Kappes A, Vaccaro A, Kunnimalaiyaan M, et al. Lithium ions: a novel treatment for pheochromocytomas and paragangliomas. Surgery. 2007;141:161–5. doi: 10.1016/j.surg.2006.12.005. [DOI] [PMC free article] [PubMed] [Google Scholar]
- 37.Nahhas F, Dryden SC, Abrams J, et al. Mutations in SIRT2 deacetylase which regulate enzymatic activity but not its interaction with HDAC6 and tubulin. Mol Cell Biochem. 2007;303:221–330. doi: 10.1007/s11010-007-9478-6. [DOI] [PubMed] [Google Scholar]
- 38.Obligado SH, Ibraghimov-Beskrovnaya O, Zuk A, et al. CDK/GSK-3 inhibitors as therapeutic agents for parenchymal renal diseases. Kidney Int. 2008;73:684–90. doi: 10.1038/sj.ki.5002731. [DOI] [PubMed] [Google Scholar]
- 39.Rao AS, Kremenevskaja N, Resch J, et al. Lithium stimulates proliferation in cultured thyrocytes by activating Wnt/beta-catenin signalling. Eur J Endocrinol. 2007;153:929–38. doi: 10.1530/eje.1.02038. [DOI] [PubMed] [Google Scholar]
- 40.Shakoori A, Mai W, Miyashita K, et al. Inhibition of GSK-3 beta activity attenuates proliferation of human colon cancer cells in rodents. Cancer Sci. 2007;98:1388–93. doi: 10.1111/j.1349-7006.2007.00545.x. [DOI] [PMC free article] [PubMed] [Google Scholar]
- 41.Smits VA, Essers MA, Loomans DS, et al. Inhibition of cell proliferation by lithium is associated with interference in cdc2 activation. FEBS Lett. 1999;457:23–7. doi: 10.1016/s0014-5793(99)01002-9. [DOI] [PubMed] [Google Scholar]
- 42.Tighe A, Ray-Sinha A, Staples OD, et al. GSK-3 inhibitors induce chromosome instability. BMC Cell Biol. 2007;14:8. doi: 10.1186/1471-2121-8-34. [DOI] [PMC free article] [PubMed] [Google Scholar]
- 43.Wakefield JG, Stephens DJ, Tavare JM. A role for glycogen synthase kinase-3 in mitotic spindle dynamics and chromosome alignment. J Cell Sci. 2003;116:637–46. doi: 10.1242/jcs.00273. [DOI] [PubMed] [Google Scholar]
- 44.Wang Y, Kreisberg JI, Ghosh PM. Cross-talk between the androgen receptor and the phosphatidylinositol 3-kinase/Akt pathway in prostate cancer. Curr Cancer Drug Targets. 2007;7:591–604. doi: 10.2174/156800907781662248. [DOI] [PubMed] [Google Scholar]
- 45.Verdaguer E, Susana Gde A, Clemens A, et al. Implication of the transcription factor E2F-1 in the modulation of neuronal apoptosis. Biomed Pharmacother. 2007;61:390–9. doi: 10.1016/j.biopha.2006.11.001. [DOI] [PubMed] [Google Scholar]
- 46.Pallàs M, Camins A. Molecular and biochemical features in Alzheimer's disease. Curr Pharm Des. 2006;12:4389–408. doi: 10.2174/138161206778792967. [DOI] [PubMed] [Google Scholar]
- 47.Camins A, Verdaguer E, Folch J, et al. Involvement of calpain activation in neurodegenerative processes. CNS Drug Rev. 2006;12:135–48. doi: 10.1111/j.1527-3458.2006.00135.x. [DOI] [PMC free article] [PubMed] [Google Scholar]
- 48.Nunomura A, Moreira PI, Lee HG, et al. Neuronal death and survival under oxidative stress in Alzheimer and Parkinson diseases. CNS Neurol Disord Drug Target. 2007;6:411–23. doi: 10.2174/187152707783399201. [DOI] [PubMed] [Google Scholar]
- 49.Zhu X, Lee HG, Perry G, et al. Alzheimer disease, the two-hit hypothesis: an update. Biochim Biophys Acta. 2007;1772:494–502. doi: 10.1016/j.bbadis.2006.10.014. [DOI] [PubMed] [Google Scholar]
- 50.Webber KM, Casadesus G, Zhu X, et al. The cell cycle and hormonal fluxes in Alzheimer disease: a novel therapeutic target. Curr Pharm Des. 2006;12:691–7. doi: 10.2174/138161206775474305. [DOI] [PubMed] [Google Scholar]
- 51.Dranovsky A, Vincent I, Gregori L, et al. Cdc2 phosphorylation of nucleolin demarcates mitotic stages and Alzheimer's disease pathology. Neurobiol Aging. 2001;22:517–28. doi: 10.1016/s0197-4580(00)00248-7. [DOI] [PubMed] [Google Scholar]
- 52.Aulia S, Tang BL. Cdh1-APC/C, cyclin B-Cdc2, and Alzheimer's disease pathology. Biochem Biophys Res Commun. 2006;339:1–6. doi: 10.1016/j.bbrc.2005.10.059. [DOI] [PubMed] [Google Scholar]
- 53.Bonni A. The E2F-Cdc2 cell-cycle pathway specifically mediates activity deprivation-induced apoptosis of postmitotic neurons. J Neurosci. 2003;23:1649–61. doi: 10.1523/JNEUROSCI.23-05-01649.2003. [DOI] [PMC free article] [PubMed] [Google Scholar]
- 54.Konishi Y, Lehtinen M, Donovan N, et al. Cdc2 phosphorylation of BAD links the cell cycle to the cell death machinery. Mol Cell. 2002;9:1005–16. doi: 10.1016/s1097-2765(02)00524-5. [DOI] [PubMed] [Google Scholar]