

Abstract
The progression of the neoplastic disease is characterized by specific alterations of energy metabolism and by symptoms like fatigue, anorexia, nausea, anaemia, immunodepression and poor performance status (PS). The main cause of these symptoms and metabolic abnormalities is the chronic action of proinflammatory cytokines released both by tumour and immune cells. The present study aimed to assess the relationship between markers of inflammation (C-Reactive Protein, Fibrinogen, proinflammatory cytokines) and energy metabolic status (BMI, leptin, oxidative stress) according to clinical parameters in 104 ovarian cancer patients at different stage and, moreover, to evaluate prospectively the changes of these parameters in accordance to tumour response in a subgroup of 70 advanced stage ovarian cancer patients. Advanced stage and poor PS were associated to high-grade inflammation and impaired energy metabolism. Among inflammatory mediators, interleukin (IL)-6 had a central role as predictive factor of leptin, reactive oxygen species and glutathione peroxidase. In turn, leptin considered the key marker of the nutritional status and energy metabolism, was independently determined from stage and IL-6, not only from BMI. Moreover, the evaluation of the changes of these parameters during the course of the neoplastic disease in the subgroup of advanced ovarian cancer patients clearly unveils the central role of IL-6 and leptin as early markers of the metabolic alterations and symptoms associated to disease progression in advanced stage ovarian cancer. Their assessment should be included in monitoring disease outcome, especially when cancer is no longer curable and quality of life becomes the primary endpoint.
Keywords: interleukin-6, leptin, ovarian cancer, energy metabolism
Introduction
The progression of neoplastic disease is characterized by specific alterations of energy metabolism and by symptoms like fatigue, anorexia, nausea, anaemia and immunodepression, which finally result in a peculiar clinical picture known as cancer cachexia syndrome that, unless counteracted, can lead to patient’s death [1]. Both the tumour growth and the host immune aspecific activation are responsible for these processes with progressive weight loss and worsening of patient performance status (PS) [2–4].
Glucose (as source of adenosine 5′-triphosphate) is the most important energetic substrate of human body [5]. It is also necessary for the synthesis, through the pentose phosphate pathway, of reducing compounds such as NADPH that is required during the recycle of reduced glutathione (GSH) [6]. In addition to GSH various antioxidant enzymes, especially superoxide dismutase (SOD), catalase and glutathione peroxidase (GPx), concur to maintain the normal cell reduced state. In advanced cancer patients, the altered energy metabolism in addition to symptoms such as anorexia, nausea and vomiting, do not allow an adequate synthesis of reducing compounds and a normal intake of carbohydrates and dietary antioxidants, thus favouring the accumulation of reactive oxygen species (ROS) [7]. Therefore, in advanced cancer patients oxidative stress (OS) may be considered a manifestation of reduced food intake and impaired glucose utilization [4, 8, 9].
The main cause of the symptoms and metabolic abnormalities of advanced cancer patients is the chronic action of some mediators [10–13], including Interleukin (IL)-6 and related cytokines IL-1 and tumour necrosis factor (TNF) α′ released by the tumour and the activated immune cells [14]. Proinflammatory cytokines, in turn, are able to induce an acute phase protein response that contributes to the pathogenesis of the altered energy metabolism [11].
Recently, the relationship between inflammatory status and changes of energy metabolism has been studied. Leptin, a protein considered the key marker of the nutritional status and energy consumption, is the central mediator connecting nutrition and immunity. It is released from adipocytes at concentrations proportional to body fat content [15, 16] and informs the central regulatory processes thus regulating body weight [17]. Although the fat amount is the main determinant of leptin concentrations, other factors are also relevant, including sex, hormones (i.e. insulin) and inflammation [18]. Several studies have evaluated the anorectic role of leptin and its correlation with body composition in cancer patients. However, to date the relationship between leptin, proinflammatory cytokines and their metabolic consequences during cancer progression has not been assessed yet.
The above reported observations led us in the present study to use leptin and oxidative stress variables (ROS, GPx and SOD) as parameters of energy metabolic status. Indeed, in a small sample of cachectic patients we observed a correlation between the changes of specific parameters of energy metabolism (i.e. body composition, resting energy expenditure, grip strength, etc.) and circulating levels of leptin, ROS and GPx [7, 19].
The aim of the present study was to assess the correlation between the circulating levels of parameters of inflammation(C-Reactive Protein, CRP, Fibrinogen, IL-6, TNFα and IL-1β) and energy metabolic status (leptin, body mass index (BMI), ROS, GPx and SOD) in epithelial ovarian cancer patients assessed at the time of diagnosis according to stage of disease and PS. In particular, we explored the determinants of leptin, considered the main parameter of energy metabolic status. Moreover, in a prospective study in the subgroup of advanced ovarian cancer patients we evaluated the change of the above parameters of inflammation and energy metabolic status during the course of the neoplastic disease in order to assess their changes in relation to the clinical objective tumour response.
Patients and methods
Patients
One hundred and four women with histologically confirmed epithelial ovarian cancer, and 95 healthy age-weight-height matched women were prospectively enrolled in the study. Patients were enrolled before any surgical or medical antineoplastic treatment. Their clinical characteristics are reported in Table 1. Clinical features studied include age, weight, height, BMI, stage of disease (according to the International Federation of Gynaecology and Obstetrics staging system) and ECOG PS [20]. Weight was assessed with minimum clothing using an electronic weighing scale. Patients with ascites were weighed after evacuative paracentesis. Seventy patients, of the 104 enrolled, with stage III-IV ovarian cancer were evaluated for objective tumour response and changes of parameters of inflammation (IL-6, CRP and fibrinogen) and energy metabolic status (weight, leptin, ROS, GPx and SOD) at baseline, after surgery ± chemotherapy and then every month during the course of disease. The study was performed in accordance with the Declaration of Helsinki. All patients signed an informed written consent to participate in the study that was approved by Ethical Committee and Institutional Review Board of Sirai Hospital, Carbonia, and Policlinico Universitario, University of Cagliari, Italy.
Table 1.
Clinical characteristics of patients and controls
| Cancer patients (n= 104) | ||
|---|---|---|
| Age, years: mean (range) | 60.3 (34–80) | |
| Weight, kg: mean (range) | 57.9 (37–96) | |
| Height, cm: mean (range) | 157.5 (140–185) | |
| No. | % | |
| Tumour site | ||
| Ovary | 104 | 100 |
| Stage | ||
| I–II | 29 | 27.9 |
| III–IV | 75 | 72.1 |
| ECOG PS | ||
| 0 | 21 | 20.6 |
| 1 | 44 | 42.5 |
| 2 | 32 | 30.5 |
| 3–4 | 7 | 6.4 |
| Controls (n= 95) | ||
| Age, years: mean (range) | 58.0 (29–80) | |
| Weight, kgs: mean (range) | 60.0 (39–78) | |
| Height, cms: mean (range) | 163.1 (154–175) | |
Abbreviations: ECOG PS, Eastern Cooperative Oncology Group Performance Status
Clinical and anthropometric measurements
Clinical evaluation included chest x-ray and abdomino-pelvic ultrasound, computed tomography (CT) and CA-125 assessment. To complete the surgical stadiation and establish the most appropriate surgical approach, laparoscopy abdominal exploration was performed for all patients [21, 22]. According to stage of disease, the appropriate surgical intervention with maximal cytoreduction intent ± chemotherapy, or induction chemotherapy followed by interval surgery was performed. After surgery ± first-line chemotherapy, patients were followed-up with medical history and physical examination, CA-125 measurement and abdomino-pelvic ultrasound and CT. Response was measured by both response evaluation criteria in solid tumours (RECIST) and CA-125criteria: the date of response was the date of the earlier of the two events [23–25].
Laboratory variables
In all patients blood sample was collected at 8 a.m. after overnight fasting. Serum sample was stored at < 20°C until the levels of IL-6, IL-1β, TNFα, CRP, fibrinogen and leptin were assayed. ROS, GPx and SOD were assessed on fresh heparinized blood samples. Details of the techniques are described in some of our previous papers [3, 4, 8, 26]. Time of blood collection for leptin assessment was chosen in order to minimize the effect of the circadian variation of leptin secretion, which is characterized by basal levels between 08.00 a.m. and 12.00 p.m., rising progressively to peak at midnight, probably as result of cumulative hyperinsulinemia of the entire day. In accordance with the available literature, it isassumed that under fairly standardized conditions, i.e. blood samplingin the morning or early afternoon, a single leptin measurement is informative [27].
Statistical analysis
Ovarian cancer patients at different stage of disease and controls were compared using ANOVA test followed by Tukey’s post-hoc test. Correlation between clinical parameters and markers of chronic inflammation and energy metabolic status was analyzed by univariate regression analysis. Correlations between leptin and clinical and laboratory variables were tested by univariate regression analysis. Significant relationships were then examined by multivariate linear regression analysis against leptin (dependent variable). Changes of patient weight, leptin, IL-6, CRP, Fibrinogen, ROS, GPx and SOD levels assessed at baseline and during the course of disease were tested by paired Student’s t-test. Data were analyzed using SPSS version 14.0 for Windows (SPSS, Inc., Chicago, IL) and P values less than 0.05 were considered statistically significant.
Results
Assessment of parameters of inflammation and energy metabolic status in 95 healthy controls and 104 ovarian cancer patients at diagnosis
Levels of IL-6, IL-1β, TNF-α, CRP, fibrinogen and ROS were significantly higher, while leptin, GPx and SOD were significantly lower, in patients with stages III–IV epithelial ovarian cancer compared to controls and patients with stages I–II. Patients at stages I–II of disease, in turn, showed significantly lower ROS levels compared to controls (Table 2).
Table 2.
Circulating levels of inflammatory markers, oxidative stress parameters, leptin and BMI in 95 controls and 104 epithelial ovarian cancer patients according to stage of disease
| Parameters | Controls n= 95 | Stage I–II n= 29 | Stage III–IV n= 75 |
|---|---|---|---|
| Mean ± SD | Mean ± SD | Mean ± SD | |
| IL-6 (pg/ml) | 3.0 ± 3.2 | 8.1 ± 10.4 | 18.6 ± 18.7 *† |
| TNF-α (pg/ml) | 11.4 ± 8.4 | 13.7 ± 13.0 | 28.3 ± 21.8 *† |
| IL-1 β (pg/ml) | 9.2 ± 8.3 | 9.7 ± 18.2 | 25.4 ± 25.5 *† |
| CRP (mg/l) | 2.6 ± 2.0 | 4.4 ± 7.5† | 23.9 ± 34.7 *† |
| Fibrinogen (mg/dl) | 345.0 ± 80.5 | 320.4 ± 111 | 471.7 ± 202 *† |
| ROS (Fort U) | 255 ± 73.4 | 323.51 ± 83.1† | 420 ± 118 *† |
| GPx (U/l) | 9594 ± 3107 | 9087 ± 2966 | 7496 ± 2931 *† |
| SOD (U/ml) | 123 ± 28 | 104.6 ± 39.0 | 84.8 ± 35.4 *† |
| Leptin (ng/ml) | 28.3 ± 15.1 | 25.0 ± 15.1 | 11.7 ± 13.8 *† |
| BMI (kg/m2) | 22.5 ± 3.1 | 23.9 ± 6.4 | 22.9 ± 5.4 |
Data are reported as mean ± standard deviation (SD). P value was calculated with ANOVA test followed by Tukey’s post-hoc test:
P < 0.05 patients with stages III–IV versus patients with stages I–II;
P < 0.05 in comparison to control subjects.
Abbreviations: CRP,C-reactive protein
IL, interleukin; TNFα, tumour necrosis factor α
ROS, reactive oxygen species
GPx, glutathione peroxidase
SOD, superoxide dismutase.
Linear univariate regression analysis between clinical parameters and parameters of inflammation and energy metabolic status
Single regression analysis showed that stage of disease and Eastern Cooperative Oncology Group (ECOG) PS were positively significantly correlated with IL-6, CRP, ROS and inversely correlated with leptin levels and BMI (Table 3).
Table 3.
Linear regression analysis of clinical parameters (stage/ECOG PS) with inflammatory (IL-6, TNFα, IL-1β, CRP and fibrinogen) and energy metabolic status (BMI, leptin, ROS, GPx and SOD) parameters in epithelial ovarian cancer patients
| STAGE | ECOG PS | |||
|---|---|---|---|---|
| β correlation coefficient | P | β correlation coefficient | P | |
| IL-6 | 0.286 | 0.006 | 0.372 | <0.001 |
| IL-1β | 0.171 | 0.731 | 0.232 | 0.100 |
| TNF-α | 0.172 | 0.929 | 0.059 | 0.578 |
| CRP | 0.302 | 0.030 | 0.269 | 0.020 |
| Fbg | 0.153 | 0.571 | 0.010 | 0.923 |
| BMI | −0.189 | 0.021 | −0.340 | <0.001 |
| leptin | −0.284 | <0.001 | −0.350 | <0.001 |
| ROS | 0.307 | 0.013 | 0.364 | <0.001 |
| GPx | −0.168 | 0.091 | −0.161 | 0.107 |
| SOD | −0.050 | 0.650 | −0.137 | 0.221 |
Abbreviations: IL, Interleukin
TNF-α, Tumour Necrosis Factor α
CRP, C-reactive protein
Fbg, Fibrinogen
ROS, Reactive Oxygen Species, GPx, Glutathione Peroxidase, SOD, Superoxide Dismutase.
Linear univariate regression analysis between parameters of inflammation and energy metabolic status
Linear regression analysis showed that serum IL-6 levels correlated with leptin, ROS and GPx, while CRP levels correlated with BMI and ROS levels (Table 4). In turn, a significant positive relationship was found between IL-6 levels and CRP (r= 0.198, P= 0.034) (data not shown).
Table 4.
Linear regression analysis between proinflammatory cytokines and markers of energy metabolic status (BMI, leptin, ROS, GPx and SOD)
| Dependent variables | Predictors | ||||
|---|---|---|---|---|---|
| IL-6 | IL-1 β | TNF α | CRP | Fbg | |
| BMI | β coefficient =−0.144 | β coefficient =−0.148 | β coefficient =−0.054 | β coefficient =−0.303 | β coefficient = 0.004 |
| P= 0.199 | P= 0.165 | P= 0.604 | P = 0.003 | P = 0.979 | |
| Leptin | β coefficient =−0.358 | β coefficient =−0.195 | β coefficient =−0.022 | β coefficient =−0.130 | β coefficient =−0.021 |
| P = 0.002 | P = 0.086 | P= 0.827 | P= 0.238 | P= 0.836 | |
| ROS | β coefficient = 0.399 | β coefficient = 0.021 | β coefficient = 0.048 | β coefficient = 0.353 | β coefficient = 0.287 |
| P = 0.020 | P = 0.828 | P= 0.606 | P < 0.001 | P = 0.100 | |
| GPx | β coefficient =−0.457 | β coefficient =−0.018 | β coefficient = 0.038 | β coefficient =−0.203 | β coefficient =−0.201 |
| P <0.001 | P = 0.885 | P= 0.735 | P= 0.070 | P= 0.058 | |
| SOD | β coefficient =−0.123 | β coefficient =−0.017 | β coefficient = 0.025 | β coefficient =−0.021 | β coefficient =−0.018 |
| P= 0.331 | P= 0.894 | P= 0.844 | P= 0.685 | P= 0.863 | |
Regression analysis showed that: IL-6 was predictive of leptin, ROS and GPx levels; CRP was predictive of BMI and ROS levels.
Text in italics indicates that the P-value is statistically significant (P < 0.05).
Abbreviations: BMI, body mass index
IL, interleukin
TNF, tumour necrosis factor
ROS, reactive oxygen species
GPx, Glutathione Peroxidase
SOD, superoxide dismutase.
Single correlation and multivariate regression analysis of stage of disease, ECOG PS, parameters of inflammation and energy metabolic status with regards to leptin levels
Single correlation analysis showed that serum leptin levels correlated positively with BMI (P < 0.0001) and GPx (P= 0.011) and inversely with stage of disease (P= 0.002), ECOG PS (P < 0.001), IL-6 (P= 0.001), IL-1 β (P= 0.024), CRP (P= 0.009) and ROS (P= 0.027). Significant relationships were further included in stepwise multivariate regression analysis. Leptin levels were dependent on BMI (β coefficient = 0.298, P= 0.003), stage (β coefficient =−0.461, P < 0.001) and IL-6 (β coefficient =−0.233, P= 0.039). Once leptin levels were adjusted for BMI, the multivariate regression analysis revealed that only stage (β coefficient =−0.271,P < 0.001) and IL-6 levels (β coefficient =−0.277, P= 0.015) were independent factors predicting leptin.
Prospective study to evaluate the changes of serum levels of inflammatory and energy metabolic status parameters during the course of disease in 70 advanced ovarian cancer patients
Fifty of the 70 (72%) advanced cancer patients followed during the course of disease achieved an objective response (partial response, PR, and complete response, CR) after primary antineoplastic treatment, 80% of them (40 patients) relapsed and 50% died from chemo-resistant disease (25 patients). Their assessment at baseline, after surgery ± chemotherapy, at the first evidence of recurrence of disease and during the further progression of disease (PD) showed the following results. When patients were responsive (i.e. CR or PR), IL-6 (P= 0.003) and CRP (P < 0.001), decreased significantly, while leptin increased (P= 0.001) in comparison to baseline. At the first evidence of PD, IL-6, but not CRP and fibrinogen, increased significantly (P < 0.001), while leptin decreased (P= 0.005) in comparison to values obtained when patients were responsive. Further PD was characterized by a significant increase of IL-6 (P < 0.001), CRP (P= 0.040) and fibrinogen (P= 0.020) and a decrease of leptin (P= 0.002) in comparison to values obtained when patients were responsive. IL-6 levels increased progressively (P= 0.037 further PD versus PD; P= 0.010 next to death versus PD), while leptin decreased significantly (P= 0.001 further PD versus PD; P < 0.0001 next to death versus PD) from first evidence of PD to death (Figs. 1 and 2). As for OS parameters, GPx activity increased significantly in responsive patients and decreased significantly at first evidence of PD in comparison to values obtained when patients were responsive, while ROS levels increased significantly only at further PD (P= 0.040) and near to death (P= 0.020) versus response values. As for body weight it reverted to the range of pre-illness value in patients achieving CR, did not change significantly at first evidence of PD, while decreased significantly when further PD was observed(P < 0.001).
Figure 1.
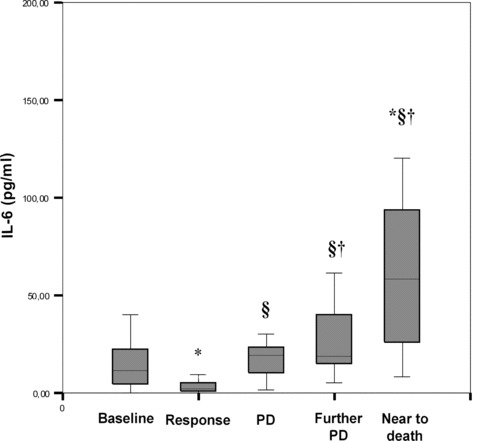
Serum IL-6 levels during the course of neoplastic disease in 70 advanced stage ovarian cancer patients. Serum IL-6 (pg/ml) decreased significantly when patients were in response (CR + PR) (P= 0.003) and increased significantly at first evidence of disease progression (P < 0.001) in comparison to response values. The further progression of disease in no more responsive patients was characterized by a significant increase of IL-6 (P < 0.001), which increased progressively from first evidence of disease to death (P= 0.037 further PD versus PD; P= 0.010 next to death versus PD). P was calculated by Student’s t-test for paired data: *P < 0.05 versus baseline; ¦ P < 0.05 versus RC; †P < 0.05 versus PD. The box plots in the figure represent columns of data as boxes whose extents indicate the 25th and 75th percentiles of the column. The line inside the box represents the median. Capped bars indicate the minimum and maximum value observed. Abbreviations: IL, Interleukin; PD, progression of disease.
Figure 2.

Serum leptin levels during the course of neoplastic disease in 70 advanced stage ovarian cancer patients. Serum leptin (ng/ml) increased significantly in patients in response after treatment in comparison to baseline (P= 0.001). At first and further evidence of PD leptin levels decreased significantly (P= 0.005 PD versus response P= 0.002 further PD versus response; P= 0.011 next to death versus response). Moreover, leptin levels decreased significantly from first evidence of disease to death (P= 0.001 further PD versus PD; P < 0.0001 next to death vs. PD). P was calculated by Student’s t-test for paired data: *P < 0.05 versus baseline; §P < 0.05 versus RC; †P < 0.05 versus PD. The box plots in the figure represent columns of data as boxes whose extents indicate the 25th and 75th percentiles of the column. The line inside the box represents the median. Capped bars indicate the minimum and maximum value observed. Abbreviations: PD, progression of disease.
Discussion
The results of the present study confirm the correlation, already demonstrated by us [26], between the severity of chronic inflammation, advanced stage and poor PS in patients with epithelial ovarian cancer. In particular, they better clarify the possible positive correlation of disease stage and ECOG PS with markers of systemic inflammation (i.e. IL-6) as well as the role of IL-6 as predictive factor of the dysregulation of energy metabolism during disease outcome.
Several studies [28, 29] have shown that inflammatory cytokines, and in particular IL-6, play a central role in the evolution of epithelial ovarian carcinoma but the mechanisms by which IL-6 may influence disease progression and outcome have not as yet been clearly demonstrated [29]. Higher serum IL-6 levels have been found in ovarian cancer patients compared with other gynaecological malignancies [30] and have been correlated with tumour burden, clinical disease status, reduced responsiveness to chemotherapy and poor relapse-free and overall survival [30–32]. However, it is difficult to establish the source of IL-6 and whether its high production in patients with ovarian carcinoma may be attributable to tumour [33] or immune system cells [34]. Tumour-associated IL-6 levels (such as those detectable in ascitic fluid) correlated with serum IL-6 concentrations [35]. Furthermore, it has been widely demonstrated that IL-6 induces the elevation of liver-derived acute phase proteins associated with advanced cancer [36]. Thus, regardless of the source of its production, high IL-6 levels are associated with a systemic inflammatory status.
Elevated serum IL-6 levels account for its endocrine activity leading to severe impairment of metabolic, physical, functional and psychosocial well-being in advanced cancer patients. IL-6, as well as IL-1 and TNFα, is responsible for symptoms such as anorexia, nausea and vomiting, weight loss, hypermetabolism, altered energy metabolism [37, 38] and fatigue [39]. In patients with epithelial ovarian carcinoma high IL-6 levels were associated with an impaired efficiency of immune cells both in terms of PBMC reduced blastic response and membrane-bound IL-2 receptor expression [40]. In the same way IL-6 exerts a central role in the pathogenesis of cancer-related anaemia [26]. Additionally, the highest serum levels of IL-6 are associated with the poorest physical/functional well-being (depression, anxiety, reduced social interaction) and the greatest fatigue [41] in a population of advanced ovarian cancer patients. Moreover, IL-6 plays a central role in modulating energy metabolism both in patients with chronic inflammatory disease and cancer.
Recent evidence demonstrated a relationship between serum levels of IL-6 and leptin, one of the most important parameters of the body energy metabolism [27, 42, 43]. In our study leptin levels were significantly lower in advanced ovarian cancer patients in comparison to controls and were inversely correlated with weight, BMI, stage, PS, serum levels of cytokines, CRP and fibrinogen. Furthermore, multivariate regression analysis demonstrated that IL-6, besides stage of disease, was an independent predictive factor of leptin levels. The present results confirm our previously published data [3, 4] and are in accordance with those of very important recent studies performed on a wide population of newly diagnosed ovarian cancer patients that found that serum leptin levels were lower in advanced ovarian cancer patients in comparison to controls [44, 45]. Leptin, released from adipocytes into the systemic circulation proportionally to fat mass, acts as a master hormone controlling energy metabolism and weight balance [46]. Additionally, this adipokine controls several other critical systems, including endocrine axis, bone metabolism, as well as the immune/inflammatory response [47, 48].
Noteworthy, the present study shows that serum leptin levels evaluated in 104 ovarian cancer patients at different stage of disease (stage I-IV) were determined both by stage of disease and serum IL-6 levels, independently of patient BMI. To date the great majority of studies on cancer patients have concluded that BMI and weight loss are the most important determinants of circulating leptin levels [49, 50]; however, it is to be noted that in the majority of these papers the impact of weight loss and the pattern of serum leptin concentration before diagnosis or study enrolment is unknown.
Indeed, experimental and clinical studies have clarified that leptin production is not only strictly related to body weight and fat but it is also influenced by glucose utilization ability [51–53]. Acute caloric deprivation and increased energy expenditure result in a large decrease of leptin synthesis, before major changes in body weight or fat mass have actually occurred [54, 55].
Consistently with this evidence and the findings obtained by some authors in tuberculosis patients [56], it can be suggested that the prolonged severe inflammatory response associated to the most advanced stages of neoplastic disease is responsible for the energy metabolism impairment thus down-regulating and exhausting leptin production. Indeed, the stimulation of leptin synthesis by aerobic glucose metabolism is mediated through the production of ATP and through the effect of glucose oxidation on cellular redox status and pyruvate cycling [57]. Therefore OS, consequent in advanced cancer patients to the low energy reserves and the inability to utilize efficiently the energy substrates, particularly glucose, may be considered the direct evidence of the metabolic impairment of which leptin is the most important parameter. Accordingly, our results demonstrated that in advanced ovarian cancer patients the lowest leptin levels and the highest IL-6 levels correlated with the highest levels of ROS and the lowest levels of GPx, the most sensitive among antioxidants to nutritional status being a selenium-dependent enzyme.
In keeping with these hypotheses, our prospective study, which analyzed the changes of the above reported parameters during the course of disease in 70 advanced ovarian cancer patients, showed that in patients who achieved CR after the primary antineoplastic treatment, IL-6 levels fell to normal values and leptin increased significantly. Then, patients who achieved PD showed a significant increase of IL-6 accompanied by a significant decrease of leptin. The patients with further PD had a progressive increase of IL-6, which reached the highest concentrations in the terminal phases of disease, associated with a significant increase of CRP and fibrinogen and a further decrease of leptin. Importantly, when PD occurred leptin did not decreased proportionally to body weight that fell significantly only in the terminal phases of disease. Leptin changes strictly reflected changes of IL-6 in accordance to tumour response or disease progression. It may be suggested that leptin variation reflected the changes of energy metabolism, induced by cytokines released from the tumour itself or by the aspecific activation of the immune system, even before they caused a significant body weight loss due to anorexia and muscle and fat wasting. To date, only studies on patients affected by active tuberculosis demonstrated that an attenuation of the inflammatory response, induced by an effective antituberculous treatment, is accompanied by an impressive increase of plasma leptin concentrations [56].
In light of the results of the present study, we can hypothesize that in ovarian cancer patients the reduced leptin production functions as a signal of increased energy expenditure and low energy reserves during the progression of the neoplastic disease [56]. Leptin decrease should induce an adaptative reduction of energy expenditure and an increase of appetite and food intake in response to the metabolic impairment induced by tumour growth and cancer-related inflammation. The signal activated by the drop of leptin levels might therefore constitute the evidence of the metabolic hyperactivity of the tumour and the host immune system and the subsequent defense attempt of the host to reduce energy expenditure when energy is scarce. Leptin levels fell together with a significant weight loss, probably induced by the prolonged action of inflammatory mediators, only in the last phases of the neoplastic disease. Indeed, chronic inflammation results in severe alterations of cell metabolism, with deleterious effects on body composition, nutritional status and immune system efficiency.
In conclusion, our findings attribute a central role to IL-6 and leptin as early markers of the main metabolic alterations associated to the progression of advanced ovarian neoplastic disease, and suggest that their assessment should be included in monitoring the disease outcome, especially when cancer is no longer curable with standard antineoplastic treatments and quality of life becomes the primary endpoint. It is possible that the scenario described above by us in ovarian cancer patients may also be applicable to other cancers, in particular lung cancer [58–60]. IL-6 assessment may allow a more appropriate care of cancer patients and the best supportive therapy considered as the irreplaceable therapeutic approach concurring to patients well-being. As for leptin, further studies are warranted to test its sensitivity and specificity as a marker of the metabolic alterations associated to disease progression in ovarian cancer patients.
Acknowledgments
No financial interest has to be declared from the authors. This work was supported by ‘Associazione sarda per la ricerca in oncologia ginecologica ONLUS’.
References
- 1.Mantovani G, Macciò A, Massa E, et al. Managing cancer-related anorexia/cachexia. Drugs. 2001;61:499–514. doi: 10.2165/00003495-200161040-00004. [DOI] [PubMed] [Google Scholar]
- 2.Mantovani G, Macciò A, Lai P, et al. Cytokine activity in cancer-related anorexia/cachexia: role of megestrol acetate and medroxyprogesterone acetate. Semin Oncol. 1998;25:45–52. [PubMed] [Google Scholar]
- 3.Mantovani G, Macciò A, Mura L, et al. Serum levels of leptin and proinflammatory cytokines in patients with advanced-stage cancer at different sites. J Mol Med. 2000;78:554–61. doi: 10.1007/s001090000137. [DOI] [PubMed] [Google Scholar]
- 4.Mantovani G, Macciò A, Madeddu C, et al. Serum values of proinflammatory cytokines are inversely correlated with serum leptin levels in patients with advanced stage cancer at different sites. J Mol Med. 2001;79:406–14. doi: 10.1007/s001090100234. [DOI] [PubMed] [Google Scholar]
- 5.Jatoi A, Loprinzi CL, Sloan J, et al. Is ATP (adenosine 5′-triphosphate), like STP, a performance-enhancing additive for the tanks of cancer patients. J Natl Cancer Inst. 2000;92:290–1. doi: 10.1093/jnci/92.4.290. [DOI] [PubMed] [Google Scholar]
- 6.Salvemini F, Franzé A, Iervolino A, et al. Enhanced glutathione levels and oxidoresistance mediated by increased glucose-6-phosphate dehydrogenase expression. J Biol Chem. 1999;274:2750–7. doi: 10.1074/jbc.274.5.2750. [DOI] [PubMed] [Google Scholar]
- 7.Mantovani G, Madeddu C, Macciò A, et al. Cancer-related anorexia/cachexia syndrome and oxidative stress: an innovative approach beyond current treatment. Cancer Epidemiol Biomarkers Prev. 2004;13:1651–9. [PubMed] [Google Scholar]
- 8.Mantovani G, Macciò A, Madeddu C, et al. Quantitative evaluation of oxidative stress, chronic inflammatory indices and leptin in cancer patients: correlation with stage and performance status. Int J Cancer. 2002;98:84–91. doi: 10.1002/ijc.10143. [DOI] [PubMed] [Google Scholar]
- 9.Macciò A, Madeddu C, Mantovani G. Glucose metabolism. In: Mantovani G, editor. Cachexia and wasting: a modern approach. Springer; 2006. pp. 195–203. In:, editor.. New York:. [Google Scholar]
- 10.Argiles JM, Lopez-Soriano FJ. The role of cytokines in cancer cachexia. Med Res Rev. 1999;19:223–48. doi: 10.1002/(sici)1098-1128(199905)19:3<223::aid-med3>3.0.co;2-n. [DOI] [PubMed] [Google Scholar]
- 11.Plata Salaman CR. Central nervous system mechanisms contributing to the cachexia-anorexia syndrome. Nutrition. 2000;16:1009–12. doi: 10.1016/s0899-9007(00)00413-5. [DOI] [PubMed] [Google Scholar]
- 12.Delano MJ, Moldawer LL. The origins of cachexia in acute and chronic inflammatory diseases. Nutr Clin Pract. 2006;21:68–81. doi: 10.1177/011542650602100168. [DOI] [PubMed] [Google Scholar]
- 13.Barton BE. IL-6-like cytokines and cancer cachexia: consequences of chronic inflammation. Immunol Res. 2001;23:41–58. doi: 10.1385/IR:23:1:41. [DOI] [PubMed] [Google Scholar]
- 14.Hagemann T, Wilson J, Burke F, et al. Ovarian cancer cells polarize macrophages toward a tumor-associated phenotype. J Immunol. 2006;176:5023–32. doi: 10.4049/jimmunol.176.8.5023. [DOI] [PubMed] [Google Scholar]
- 15.Zhang Y, Proenca R, Maffei M, et al. Positional cloning of the mouse obese gene and its human homologue. Nature. 1994;372:425–32. doi: 10.1038/372425a0. [DOI] [PubMed] [Google Scholar]
- 16.Considine RV, Sinha MK, Heiman ML, et al. Serum immunoreactive-leptin concentrations in normal weight and obese humans. N Engl J Med. 1996;334:292–5. doi: 10.1056/NEJM199602013340503. [DOI] [PubMed] [Google Scholar]
- 17.Pi-Sunyer FX. Overnutrition and undernutrition as modifiers of metabolic processes in disease states. Am J Clin Nutr. 2000;72:533S–7S. doi: 10.1093/ajcn/72.2.533S. [DOI] [PubMed] [Google Scholar]
- 18.Mantzoros CS, Moschos SJ. Leptin: in search of role(s) in human physiology and pathophysiology. Clin Endocrinol. 1998;49:551–67. doi: 10.1046/j.1365-2265.1998.00571.x. [DOI] [PubMed] [Google Scholar]
- 19.Mantovani G, Macciò A, Madeddu C, et al. A phase II study with antioxidants, both in the diet and supplemented, pharmaconutritional support, progestagen, and anti-cyclooxygenase-2 showing efficacy and safety in patients with cancer-related anorexia/cachexia and oxidative stress. Cancer Epidemiol Biomarkers Prev. 2006;15:1030–4. doi: 10.1158/1055-9965.EPI-05-0538. [DOI] [PubMed] [Google Scholar]
- 20.Oken MM, Creech RH, Tormey DC, et al. Toxicity and response criteria of the Eastern Cooperative Oncology Group. Am J Clin Oncol. 1982;5:649–55. [PubMed] [Google Scholar]
- 21.Schlaerth AC, Abu-Rustum NR. Role of minimally invasive surgery in gynaecologic cancers. Oncologist. 2006;11:895–901. doi: 10.1634/theoncologist.11-8-895. [DOI] [PubMed] [Google Scholar]
- 22.Ghezzi F, Cromi A, Uccella S, et al. Laparoscopy versus laparotomy for the surgical management of apparent early stage ovarian cancer. Gynecol Oncol. 2007;105:409–13. doi: 10.1016/j.ygyno.2006.12.025. [DOI] [PubMed] [Google Scholar]
- 23.Rustin GJ. Use of CA-125 to assess response to new agents in ovarian cancer trials. J Clin Oncol. 2006;21:187s–93s. doi: 10.1200/JCO.2003.01.223. [DOI] [PubMed] [Google Scholar]
- 24.Rustin GJ, Quinn M, Thigpen T, et al. Re: New guidelines to evaluate the response to treatment in solid tumors (ovarian cancer) J Natl Cancer Inst. 2004;96:487–8. doi: 10.1093/jnci/djh081. [DOI] [PubMed] [Google Scholar]
- 25.Rustin GJ, Marples M, Nelstrop AE, et al. Use of CA-125 to define progression of ovarian cancer in patients with persistently elevated levels. J Clin Oncol. 2001;19:4054–7. doi: 10.1200/JCO.2001.19.20.4054. [DOI] [PubMed] [Google Scholar]
- 26.Macciò A, Madeddu C, Massa D, et al. Hemoglobin levels correlate with interleukin-6 levels in patients with advanced untreated epithelial ovarian cancer: role of inflammation in cancer-related anemia. Blood. 2005;106:362–7. doi: 10.1182/blood-2005-01-0160. [DOI] [PubMed] [Google Scholar]
- 27.Meier U, Gressner AM. Endocrine regulation of energy metabolism: review of pathobiochemical and clinical chemical aspects of leptin, ghrelin, adiponectin and resistin. Clin Chem. 2004;50:1511–25. doi: 10.1373/clinchem.2004.032482. [DOI] [PubMed] [Google Scholar]
- 28.Balkwill FR. Re: Possible role of ovarian epithelial inflammation in ovarian cancer. J Natl Cancer Inst. 2000;92:162–3. doi: 10.1093/jnci/92.2.162a. [DOI] [PubMed] [Google Scholar]
- 29.Nash MA, Ferrandina G, Gordinier M, et al. The role of cytokines in both the normal and the malignant ovary. Endocr Relat Cancer. 1999;6:93–107. doi: 10.1677/erc.0.0060093. [DOI] [PubMed] [Google Scholar]
- 30.Scambia G, Testa U, Panici PB, et al. Interleukin-6 serum levels in patients with gynecological tumors. Int J Cancer. 1994;57:318–23. doi: 10.1002/ijc.2910570305. [DOI] [PubMed] [Google Scholar]
- 31.Tempfer C, Zeisler H, Sliutz G, et al. Serum evaluation of interleukin-6 in ovarian cancer patients. Gynecol Oncol. 1997;66:27–30. doi: 10.1006/gyno.1997.4726. [DOI] [PubMed] [Google Scholar]
- 32.Berek JS, Chung C, Kaldi K, et al. Serum interleukin-6 levels correlate with disease status in patients with epithelial ovarian cancer. Am J Obstet Gynecol. 1991;164:1038–42. doi: 10.1016/0002-9378(91)90582-c. [DOI] [PubMed] [Google Scholar]
- 33.Glezerman M, Mazot M, Maymon E, et al. Tumor necrosis factor-alpha and interleukin-6 are differently expresses by fresh human cancerous ovarian tissue and primary cell lines. Eur Cytokine Netw. 1998;9:171–9. [PubMed] [Google Scholar]
- 34.Trikha M, Corringham R, Klein B, et al. Targeted anti-interleukin-6 monoclonal antibody therapy for cancer: a review of the rationale and clinical evidence. Clin Cancer Res. 2003;9:4653–65. [PMC free article] [PubMed] [Google Scholar]
- 35.Plante M, Rubin SC, Wong GY, et al. Interleukin-6 level in serum and ascites as a prognostic factor in patients with epithelial ovarian cancer. Cancer. 1994;73:1882–8. doi: 10.1002/1097-0142(19940401)73:7<1882::aid-cncr2820730718>3.0.co;2-r. [DOI] [PubMed] [Google Scholar]
- 36.Oldenburg HS, Rogy MA, Lazarus DD, et al. Cachexia and the acute phase response in inflammation are regulated by interleukin-6. Eur J Immunol. 1993;23:1889–94. doi: 10.1002/eji.1830230824. [DOI] [PubMed] [Google Scholar]
- 37.Deans C, Wigmore SJ. Systemic inflammation, cachexia and prognosis in patients with cancer. Curr Opin Clin Nutr Metab Care. 2005;8:265–9. doi: 10.1097/01.mco.0000165004.93707.88. [DOI] [PubMed] [Google Scholar]
- 38.Argiles JM, Busquets S, Lopez-Soriano FJ. Cytokines in the pathogenesis of cancer cachexia. Curr Opin Clin Nutr Metab Care. 2003;6:401–6. doi: 10.1097/01.mco.0000078983.18774.cc. [DOI] [PubMed] [Google Scholar]
- 39.Collado-Hidalgo A, Bower JE, Ganz PA, et al. Inflammatory biomarkers for persistent fatigue in breast cancer survivors. Clin Cancer Res. 2006;12:2759–66. doi: 10.1158/1078-0432.CCR-05-2398. [DOI] [PubMed] [Google Scholar]
- 40.Macciò A, Lai P, Santona MC, et al. High serum levels of soluble IL-2 receptor, cytokines, and C reactive protein correlate with impairment of T cell response in patients with advanced epithelial ovarian cancer. Gynecol Oncol. 1998;69:248–52. doi: 10.1006/gyno.1998.4974. [DOI] [PubMed] [Google Scholar]
- 41.Costanzo ES, Lutgendorf SK, Sood AK, et al. Psychosocial factors and interleukin-6 among women with advanced ovarian cancer. Cancer. 2005;104:305–13. doi: 10.1002/cncr.21147. [DOI] [PubMed] [Google Scholar]
- 42.Barber MD, McMillan DC, Wallace AM, et al. The response of leptin, interleukin-6 and fat oxidation to feeding in weight-losing patients with pancreatic cancer. Br J Cancer. 2004;90:1129–32. doi: 10.1038/sj.bjc.6601712. [DOI] [PMC free article] [PubMed] [Google Scholar]
- 43.Popa C, Netea MG, Radstake TR, et al. Markers of inflammation are negatively correlated with serum leptin in rheumatoid arthritis. Ann Rheum Dis. 2005;64:1195–8. doi: 10.1136/ard.2004.032243. [DOI] [PMC free article] [PubMed] [Google Scholar]
- 44.Mor G, Visintin I, Lai Y, et al. Serum protein markers for early detection of ovarian cancer. Proc Natl Acad Sci USA. 2005;102:7677–82. doi: 10.1073/pnas.0502178102. [DOI] [PMC free article] [PubMed] [Google Scholar]
- 45.Visintin I, Feng Z, Longton G, et al. Diagnostic markers for early detection of ovarian cancer. Clin Cancer Res. 2008;14:1065–72. doi: 10.1158/1078-0432.CCR-07-1569. [DOI] [PubMed] [Google Scholar]
- 46.Considine RV. Weight regulation, leptin and growth hormone. Horm Res. 1997;48:116–21. doi: 10.1159/000191340. [DOI] [PubMed] [Google Scholar]
- 47.Fantuzzi G. Leptin: nourishment for the immune system. Eur J Immunol. 2006;36:3101–4. doi: 10.1002/eji.200636770. [DOI] [PubMed] [Google Scholar]
- 48.Faggioni R, Feingold KR, Grunfeld C. Leptin regulation of the immune response and the immunodeficiency of malnutrition. FASEB J. 2001;15:2565–71. doi: 10.1096/fj.01-0431rev. [DOI] [PubMed] [Google Scholar]
- 49.Wallace AM, Kelly A, Sattar N, et al. Circulating concentrations of “free” leptin in relation to fat mas and appetite in gastrointestinal cancer patients. Nutr Cancer. 2002;44:157–60. doi: 10.1207/S15327914NC4402_06. [DOI] [PubMed] [Google Scholar]
- 50.Simons JP, Schols AM, Campfield LA, et al. Plasma concentration of total leptin and human lung-cancer-associated cachexia. Clin Sci. 1997;93:273–7. doi: 10.1042/cs0930273. [DOI] [PubMed] [Google Scholar]
- 51.Havel PJ. Update on adipocyte hormones: regulation of energy balance and carbohydrate/lipid metabolism. Diabetes. 2004;53:S143–51. doi: 10.2337/diabetes.53.2007.s143. [DOI] [PubMed] [Google Scholar]
- 52.Keim NL, Stern JS, Havel PJ. Relation between circulating leptin concentrations and appetite during a prolonged, moderate energy deficit in women. Am J Clin Nutr. 1998;68:794–801. doi: 10.1093/ajcn/68.4.794. [DOI] [PubMed] [Google Scholar]
- 53.Dubuc GR, Phinney SD, Stern JS, et al. Changes of serum leptin and endocrine and metabolic parameters after 7 days of energy restriction in men and women. Metabolism. 1998;47:429–34. doi: 10.1016/s0026-0495(98)90055-5. [DOI] [PubMed] [Google Scholar]
- 54.Chan JL, Heist K, DePaoli AM, et al. The role of falling leptin levels in the neuroendocrine and metobolic adaptation to short-term starvation in healthy men. J Clin Invest. 2003;111:1409–21. doi: 10.1172/JCI17490. [DOI] [PMC free article] [PubMed] [Google Scholar]
- 55.Leibel RL, Rosenbaum M, Hirsch J. Changes in energy expenditure resulting from altered body-weight. N Engl J Med. 1995;332:621–8. doi: 10.1056/NEJM199503093321001. [DOI] [PubMed] [Google Scholar]
- 56.van Crevel R, Karyadi E, Netea MG, et al. Decreased plasma leptin concentrations in tubercolosis patients are associated with wasting and inflammation. J Clin Endocrinol Metab. 2002;87:758–63. doi: 10.1210/jcem.87.2.8228. [DOI] [PubMed] [Google Scholar]
- 57.Mueller WM, Stanhope KL, Gregoire F, et al. Effects of metformin and vanadium on leptin secretion from cultured rat adipocytes. Obes Res. 2000;8:530–9. doi: 10.1038/oby.2000.66. [DOI] [PubMed] [Google Scholar]
- 58.Tas F, Duranyildiz D, Argon A, et al. Serum levels of leptin and proinflammatory cytokines in advanced-stage non-small cell lung cancer. Med Oncol. 2005;22:353–8. doi: 10.1385/MO:22:4:353. [DOI] [PubMed] [Google Scholar]
- 59.Jamieson NB, Brown DJ, Michael Wallace A, et al. Adiponectin and the systemic inflammatory response in weight-losing patients with non-small cell lung cancer. Cytokine. 2004;27:90–2. doi: 10.1016/j.cyto.2004.03.017. [DOI] [PubMed] [Google Scholar]
- 60.Alemán MR, Santolaria F, Batista N, et al. Leptin role in advanced lung cancer. A mediator of the acute phase response or a marker of the status of nutrition. Cytokine. 2002;19:21–6. doi: 10.1006/cyto.2002.1051. [DOI] [PubMed] [Google Scholar]