

Abstract
Melanomas remain associated with dismal prognosis because they are naturally resistant to apoptosis and they markedly metastasize. Up-regulated expression of sodium pump α sub-units has previously been demonstrated when comparing metastatic to non-metastatic melanomas. Our previous data revealed that impairing sodium pump α1 activity by means of selective ligands, that are cardiotonic steroids, markedly impairs cell migration and kills apoptosis-resistant cancer cells. The objective of this study was to determine the expression levels of sodium pump α sub-units in melanoma clinical samples and cell lines and also to characterize the role of α1 sub-units in melanoma cell biology. Quantitative RT-PCR, Western blotting and immunohistochemistry were used to determine the expression levels of sodium pump α sub-units. In vitro cytotoxicity of various cardenolides and of an anti-α1 siRNA was evaluated by means of MTT assay, quantitative videomicroscopy and through apoptosis assays. The in vivo activity of a novel cardenolide UNBS1450 was evaluated in a melanoma brain metastasis model. Our data show that all investigated human melanoma cell lines expressed high levels of the α1 sub-unit, and 33% of human melanomas displayed significant α1 sub-unit expression in correlation with the Breslow index. Furthermore, cardenolides (notably UNBS1450; currently in Phase I clinical trials) displayed marked anti-tumour effects against melanomas in vitro. This activity was closely paralleled by decreases in cMyc expression and by increases in apoptotic features. UNBS1450 also displayed marked anti-tumour activity in the aggressive human metastatic brain melanoma model in vivo. The α1 sodium pump sub-unit could represent a potential novel target for combating melanoma.
Keywords: melanoma, sodium pump, cMyc, cardenolides, brain metastasis, chemoresistance
Introduction
The incidence of melanoma is steadily increasing with a present lifetime risk of 1 in 50 among the Caucasian population [1]. Melanomas have a strong propensity to metastasize, in particular into the brain, after which they are highly resistant to therapy [2, 3]. Metastatic melanoma patients have only limited treatment options consisting of mono- or poly-therapy with dacarbazine (DTIC), cisplatin and temozolomide (TMZ) [4]. These produce only marginal clinical improvements and have no substantial impact on overall patient survival. Furthermore, even biological/immunotherapy has not contributed greater clinical benefits than DTIC alone [4]. Therefore, new therapeutic approaches are needed [5–8]. We think that targeting the sodium pump (Na+/K+-ATPase) and more specifically its α1 sub-unit could represent a novel means to combat a significant proportion of melanomas.
The sodium pump, consisting of α and β sub-units, regulates intracellular ion homeostasis when it is associated with the Na+/Ca2+ exchanger in the plasma membrane [9]. However, when located in caveolae and physically associated with caveolin-1 [10], it is no longer concerned with ion homeostasis but is involved in a src-EGFR-controlled signalling complex directly impacting cell proliferation and migration [9, 11]. The natural ligands of the sodium pump are the cardiotonic steroids, which are divided into two chemical groups: cardenolides and bufadienolides [9]. Digitalis compounds (e.g. digoxin, which has been used extensively to treat patients with heart failure) belong to the cardenolide group. The sodium pump α sub-unit acts as a highly selective and sensitive receptor for cardiotonic steroids, whereas the β sub-unit acts as a chaperone for the α sub-unit [9]. There are four α and five β sub-units that have been identified to date. Many cancer types over-express the different α sub-units, including melanoma [12]; α1 sub-units are over-expressed in non-small-cell lung cancer [NSCLC; 13], renal clear cell carcinoma [14] and glioma [10], whereas colon cancer over-express α3 [15]. Inhibiting selectively the expression of the α1 sub-unit in NSCLC [13] and glioma [10] cells markedly impairs both cell proliferation and migration through major disorganization of the actin cytoskeleton, a process that results in lysosomal membrane permeabilization [16] and/or autophagy [10]-related cell death. Metastatic melanomas [17, 18] like glioblastomas [19, 11] are naturally resistant to apoptosis but less to autophagy-related cell death [3, 8, 19].
Over-expression of the cMyc oncogene is also a common feature in melanomas [20–24]. cMyc over-expression in melanomas is associated with a dismal prognosis [21, 22, 25], as well as with resistance to chemotherapy [23, 24] and radiotherapy [20]. Impairing cMyc expression in melanoma cells forces them to undergo apoptosis [5, 26]. Targeting the sodium pump α1 sub-unit markedly impairs cMyc expression, at least in human prostate cancer cells [9]. Taken together, these data prompted us to investigate the levels of expression of the sodium pump α1 sub-unit in a human clinical series of naevi and melanomas and in experimental human melanoma models. We then analyzed the consequences of inhibiting sodium pump α1 sub-unit activity (using anti-α1 siRNA and cardiotonic steroids) in relation to cMyc expression levels and the impact on cell proliferation and death in various experimental melanoma models. The potential use of cardenolides for melanoma treatment was also investigated in human brain metastatic melanoma xenografts.
Materials and methods
Cell cultures and compounds
Established cell lines
The human HT-144 (ATCC code HTB-63), G-361 (ATCC code CRL-1424), C-32 (ATCC code CRL-1585) and SKMEL-28 (ATCC code HTB-72) melanoma cell lines and the mouse B16F10 (ATCC code CRL-6475) melanoma cell line were obtained from the American Type Culture Collection (ATCC; Manassas, VA) and maintained in our laboratory as detailed previously [7, 27].
Primary cell cultures
Primary melanoma cell cultures (VM-1, 7, 10, 21, 23, 24, 28, 30, 47 and 48) were established at the Institute of Cancer Research, Medical University of Vienna, as previously described [28]. Briefly, surgical specimens confirmed by histocytology as primary or metastatic melanoma lesions were blended mechanically and transferred into culture flasks containing growth medium (RPMI 1640, 20% foetal calf serum (FCS), 1% glutamine and 1% penicillin/streptomycin; PAA Laboratories, Linz, Austria). After passage 3, cells were cultured in growth medium containing 10% FCS and 1% glutamine but without antibiotics. The melanocyte origin of the tumour cell cultures was confirmed by electron-microscopy through the presence of melanosomes as well as immunocytochemically by S100 and HMB 45 antigen detection, and biochemically by melanin and tyrosinase determination.
Compounds
Temozolomide (TMZ) was purchased from Schering Plough (Brussels, Belgium), dacarbazine and taxol from Teva Pharma (Wilrijk, Belgium), cisplatin, digoxin and hellebrin from Sigma-Aldrich (Bornem, Belgium), ouabain and digitoxin from Acros Organics (Geel, Belgium) and UNBS1450 was hemi-synthesized at Unibioscreen SA (Brussels, Belgium) as detailed previously [29].
Clinical samples
Immunohistochemical expression of sodium pump α1 sub-units was determined on a series of 139 clinical samples, including 57 naevi and 82 melanomas (Table 1). Samples were obtained from the Pôle de Pathologie (CHRU Lille Hospital, France) and the Erasmus University Hospital (Brussels, Belgium), the latter providing six melanoma metastases for the quantitative determination of mRNA expression of sodium pump α1, α2 and α3 sub-units, as described previously [10].
Table 1.
Immunohistochemical expression of α1 sub-units in clinical naevi and melanoma samples
| Diagnosis | Histological or clinical data | No. of cases analyzed | No. of positive cases | Staining intensity | Area stained (%) | |||
|---|---|---|---|---|---|---|---|---|
| + | ++ | (min-max) | mean | |||||
| Naevi | Dermal | 20 | 2/20 | 2 | 0 | 20–40 | 30 | |
| Junctional | 11 | 0/11 | 0 | 0 | 0 | 0 | ||
| Mixt | 23 | 1/23 | 1 | 0 | 10 | 10 | ||
| Lentigo | 3 | 0/3 | 0 | 0 | 0 | 0 | ||
| TOTAL | 57 | 3/57 | 3 | 0 | 10–40 | 23 | ||
| Melanomas | SSM | 26 | 5/26 | 1 | 4 | 15–80 | 42 | |
| NM | 3 | 1/3 | 1 | 0 | 30 | 30 | ||
| Acral | 5 | 1/5 | 1 | 0 | 80 | 80 | ||
| Dubreuil | 10 | 1/10 | 1 | 0 | 50 | 50 | ||
| Metastases | Lymph nodes | 9 | 2/9 | 0 | 2 | 25–75 | 50 | |
| Brain | 18 | 13/18 | 1 | 12 | 10–80 | 73 | ||
| Others | 11 | 4/11 | 2 | 2 | 25–75 | 53 | ||
| Breslow | <1 mm | 18 | 0/18 | 0 | 0 | 0 | 0 | |
| 1–2 mm | 8 | 1/8 | 1 | 0 | 50 | 50 | ||
| 2–4 mm | 8 | 3/8 | 1 | 2 | 25–30 | 28 | ||
| >4 mm | 10 | 4/10 | 2 | 2 | 15–80 | 59 | ||
| Total | 82 | 27/82 | 7 | 20 | 10–80 | 57 | ||
In vivo xenografts
In vivo xenografts of human melanoma VM-48 cells in nude mice were obtained as described previously in the case of glioma models [30, 31]. All mice (6-week-old female nu/nu mice; 21–23 g; Iffa Credo, Charles Rivers, Arbresle, France) in the study had 1 × 10⁶ VM-48 cells stereotactically implanted into the brain on the same day. Each experimental group contained 11 mice. The in vivo experiment described in the present study was performed on the basis of Authorization no. LA1230509 of the Animal Ethics Committee of the Federal Department of Health, Nutritional Safety and the Environment (Belgium).
Determination of sodium pumpα1 sub-unit immunohistochemical expression
Immunohistochemical analysis of the 139 clinical samples (Table 1) was performed as detailed previously [13]. The primary antibody against the sodium pump α1 sub-unit was obtained from Upstate (Millipore, Brussels, Belgium; dilution 1/400). The positive tissue sample was normal human kidney. The semi-quantitative analysis was performed by a specialized pathologist and assessed in terms of the percentage of area stained and the intensity of staining (0: no staining, +: low staining, ++: marked staining).
Quantitative reverse transcriptase–polymerase chain reaction (qRT-PCR)
qRT-PCR analyses were performed as detailed previously [10] to determine the levels of mRNA expression of the sodium pump α1, α2 and α3 sub-units in 6 human melanoma metastases and in 14 human melanoma cell lines.
Transient transfection with sodium pump anti-α1 siRNAs
A sodium pump anti-α1 siRNA with sense 5′-GGGCAGUGUUUCAGGCUAA-3′ and anti-sense 5′-UUAGCCUGAAACACUGCCC-3′ was used that had already revealed itself to be highly efficient in reducing α1 expression in NSCLC [13] and glioma [10] cells. The control (scrambled) siRNA was sense 5′-UCUACGAGGCACGAGACUU-3′ and anti-sense 5′-AACUCUCGUGCCUCGUAGA-3′[10, 13]. The melanoma cells were transfected twice consecutively (on days 0 and 1) with the Profection Mammalian Transfection System® (Promega, Leiden, The Netherlands) according to the manufacturer’s instructions as previously detailed [7]. Transfecting melanoma cells with anti-α1 siRNA twice on two consecutive days resulted in a decrease of at least 60% in target expression that lasted for at least 3 days, a result not obtained when transfecting the cells only once. The final concentration of the siRNAs applied overnight to the cells for the transfections was 20 nM.
Protein expression measurements
Western blot and immunofluorescence analyses were performed as detailed previously [7, 16, 27, 32]. Negative controls included the omission of the incubation step with primary antibodies. For Western blotting, the integrity and equal loading of the extracts were assessed by means of histone 3 or tubulin immunoblotting. The primary antibodies used for protein level determination, either by Western blot or by immunofluorescence, were as follows: α1 antibody (dilution 1/200 for immunofluorescence and 1/1000 for Western blotting; Upstate), cMyc antibody (1/50 for immunofluorescence and 1/400 for Western blotting; Santa Cruz, Heidelberg, Germany), anti-PARP (poly (ADP-ribose) polymerase) antibody (dilution 1/250; Calbiochem, VWR, Leuven, Belgium), tubulin antibody (dilution 1/2000; Abcam, Cambridge, UK) and histone H3 antibody (1/1000; Cell Signaling, Bioké, Leiden, The Netherlands). Secondary antibodies were purchased from Pierce (PerbioScience, Erembodegem, Belgium) for the Western blots and from Molecular Probes (Invitrogen, Merelbeke, Belgium) for fluorescent detection (Alexa fluor conjugated antibodies). Western blots were developed using the Pierce Supersignal Chemiluminescence system.
Determination of apoptosis
Apoptosis was determined by means of flow cytometry using double annexin V–propidium iodide staining, as detailed elsewhere [33] using the APO AF apoptosis detection kit (Sigma-Aldrich) following the manufacturer’s instructions. Poly ADP ribose protein (PARP: 116 kD) is differentially cleaved into 83–89 kD fragments during apoptosis or into 50–60 kD fragments during necrosis. The expression of native and cleaved proteins was evaluated by Western blot using the Calbiochem antibody (see Protein Expression Measurements section) as previously described [7].
In vitro overall growth determination
Overall cell growth was assessed using the 3-[4,5-dimethylthiazol-2-yl]-diphenyltetrazolium bromide (MTT) (Sigma) colorimetric assay, as detailed elsewhere [10, 29]. All determinations were carried out in sextuplicate.
Computer-assisted phase-contrast microscopy (quantitative videomicroscopy)
Quantitative videomicroscopy was performed as detailed previously [10, 13]. Briefly, 25 cm2 flasks were placed under phase-contrast microscopes located in temperature-controlled incubators for 72 hrs. During this time period, pictures of the same fields were taken every 4 min., thanks to computer assistance. Based on these pictures, we calculated for each cell line and each experimental treatment the global growth rate (GGR), which corresponded to the ratio of the mean number of cells present in the last image captured in the experiment (at 72 hrs) to the number of cells present in the first image (at 0 hr). Furthermore, the 1080 pictures obtained during the 72 hrs of observation were accelerated to give a short film (1 min.) allowing us to observe and monitor the morphological changes and cell migration trajectories induced by the various treatments. Each condition was evaluated in triplicate.
Statistical analyses
Statistical comparison of the expression of sodium pump α1 sub-units between naevi and melanoma groups was undertaken using Fisher’s exact test. The comparison of the Breslow levels in negative versus positive α1 stained melanoma samples was conducted by the Mann–Whitney test. Survival analyses were carried out by means of Kaplan–Meier curves and Gehan’s generalized Wilcoxon test. All the statistical analyses were realized using Statistica (Statsoft, Tulsa, OK).
Results
Characterization of sodium pump α1 sub-unit expression in clinical samples and experimental models of melanoma
Table 1 details the pattern of sodium pump α1 sub-unit expression in a series of 57 naevi and 82 melanomas. The data show that only 3 out of 57 (approximately 5%) naevi display significant immunohistochemical expression of α1 sub-units, whereas 27 out of 82 (33%) of the melanomas were positive for α1 sub-units (P < 0.01). Among the melanoma samples, the Breslow index was significantly higher (P= 0.003) in the α1 sub-unit positive cases (mean Breslow: 6.1 mm) compared with the α1 sub-unit negative cases (mean Breslow: 2.5 mm). Furthermore, 7 out of 18 (39%) melanomas with a Breslow index greater than 2 mm were immunohistochemically positive, whereas this was the case for only 1 out of 27 (4%) when the Breslow index was lower than 2 mm. With regard to melanoma metastases, it is worth noting that 50% were immunohistochemically positive for the α1 sub-unit and the value was 72% for brain metastases, whose treatment still remain a real challenge.
Quantitative determination of mRNA levels of sodium pump α1, α2 and α3 subunits in six melanoma metastases revealed that all samples expressed α1 mRNAs and 5 displayed α3 mRNAs with high variability, but none expressed α2 mRNAs (Fig. 1A). The whole set of 10 melanoma primary cell cultures expressed high levels of α1 mRNA and 5 out of 10 displayed α3 mRNAs, but once again none displayed α2 mRNAs (Fig. 1B). The four established melanoma cell lines obtained from ATCC also displayed significant amounts of α1 and α3 mRNA but not α2 mRNA (Fig. 1C). The high expression of α1 sub-units in melanoma cell lines was further confirmed by Western blot (Fig. 1D). Taken together these data indicate that (i) sodium pump α2 sub-units seem not to be expressed in melanoma cells, (ii) low levels of α3 sub-unit mRNA are expressed in about 50% of the experimental models analyzed, (iii) α1 sub-units are expressed in all the experimental models analyzed and also in approximately 33% of clinical melanoma samples evaluated, (iv) melanomas display a higher proportion of α1 sub-unit-positive samples than naevi and (v) aggressive melanomas (Breslow ≥2 mm) display a higher proportion of α1 sub-unit-positive cases than less aggressive melanomas (Breslow <2 mm). Figures 1E and F illustrate the morphological patterns of sodium pump α1 sub-unit immunohistochemical expression in one case of melanoma and naevus, respectively.
Figure 1.
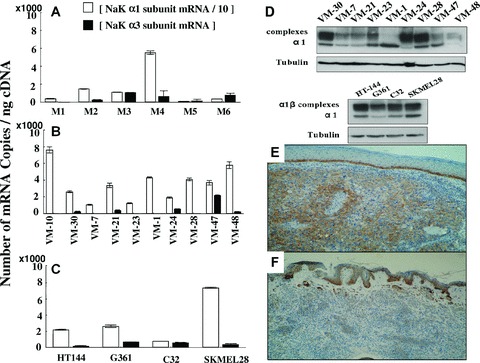
Expression of α1 sub-units in human melanoma and naevi samples. (A–C) Analysis of the mRNA expression of sodium pump α sub-units by quantitative RT-PCR in 6 human melanoma metastases samples (A), 10 human melanoma primary cell cultures (B) and 4 ATCC human melanoma cell lines (C). The histopathological origin of each cell line is given in Table 2. White columns represent the number of mRNA copies of α1 sub-units divided by 10 in order to represent the results for α3 sub-units on the same plot. α2 sub-units were not expressed in these samples. Data are expressed as mean ± S.E.M. (D) α1 protein expression in vitro in investigated melanoma models analyzed by Western blot. Tubulin blots were used to assess equal protein loading. The primary cell culture VM-10 expresses comparable α1 amounts to VM-24 cells (data not shown). (E) Typical staining in brown of α1 sub-units in a human nodular melanoma specimen (G×40). (F) Typical staining in brown of α1 sub-units in a human dermal naevus (G×40).
Inhibiting sodium pump α1 sub-unit expression in melanoma cells confers in vitro marked inhibition of growth
Table 2 details the IC50 values obtained with respect to three anti-melanoma cytotoxic agents, dacarbazine, cisplatin and temozolomide, against 10 human melanoma primary cell cultures, 4 human established melanoma cell lines and 1 mouse melanoma cell line. In addition, use was also made of taxol because although it is not a first-line treatment for melanoma patients, it nevertheless remains one of the most potent anti-cancer drugs available. The IC50 value represents the concentration of the drug that inhibits 50% of the in vitro global growth of a cell line after 3 days’ incubation. Table 2 also details the IC50 values obtained with five sodium pump α sub-unit antagonists (cardiotonic steroids), including four cardenolides: ouabain, digitoxin, digoxin [9] and one hemi-synthetic derivative of 2″-oxovoruscharin [UNBS1450: 29], and one bufadienolide: hellebrin [9]. The data in general show that cardiotonic steroids display higher inhibitory effects on the global growth of human melanoma cells than conventional cytotoxic drugs, and of the four cardenolides, UNBS1450 displayed the most pronounced anti-cancer effects. In contrast, conventional cytotoxic drugs and cardiotonic steroids, with the exception of taxol (IC50: 8 nM), were inactive against mouse B16F10 cell line. Figure 2A illustrates the effects of 100 nM digoxin or UNBS1450 treatment after 72 hrs on VM-21 melanoma cell morphology. UNBS1450 markedly impaired both VM-21 cell proliferation and migration with dramatic cell shrinkage (see the white arrows in Fig. 2Ad), a feature not observed with digoxin (Fig. 2Ab). This impairment in VM-21 cell proliferation and migration was morphologically reproduced using the anti-α1 siRNA (see the white arrows in Fig. 2Bc). The effects observed with the anti-α1 siRNA were less pronounced than with UNBS1450 because the siRNA used did not totally eliminate α1 expression as further illustrated in Figs. 2Bd and 4B.
Table 2.
In vitro compound-induced anti-growth effects on melanoma cells expressed as IC50 values
| Cell line | Origin | DTIC | Cisplatin | Taxol | TMZ | Ouabain | Digitoxin | Digoxin | UNBS1450 | Hellebrin |
|---|---|---|---|---|---|---|---|---|---|---|
| VM-10 | SSM | >10,000 | 9877 | >10,000 | >10,000 | 79 | 99 | 240 | 25 | 90 |
| VM-30 | SSM | >10,000 | >10,000 | >10,000 | >10,000 | 333 | 473 | 1475 | 45 | 703 |
| VM-7 | NM | >10,000 | 3475 | 69 | >10,000 | 22 | 36 | 56 | 5 | 64 |
| VM-21 | NM | >10,000 | 9012 | 46 | >10,000 | 39 | 58 | 94 | 8 | 86 |
| VM-23 | NM | >10,000 | ∼10,000 | 112 | >10,000 | 69 | 326 | 444 | 23 | 273 |
| VM-1 | LN | >10,000 | >10,000 | >10,000 | >10,000 | 122 | 234 | 446 | 35 | 518 |
| VM-24 | LN | >10,000 | 3139 | 4 | >10,000 | 43 | 46 | 270 | 29 | 921 |
| VM-28 | BM | >10,000 | >10,000 | 1000 | >10,000 | 7 | 91 | 350 | 12 | 326 |
| VM-47 | BM | >10,000 | 6687 | 209 | >10,000 | 172 | 236 | 348 | 10 | 41 |
| VM-48 | BM | >10,000 | 9498 | 36 | >10,000 | 70 | 228 | 419 | 23 | 273 |
| IC50 (min–max) | NA | 3139->10,000 | 46->10,000 | NA | 7–333 | 36–473 | 56–1475 | 5–45 | 41–921 | |
| IC50 median | NA | 9688 | 161 | NA | 70 | 164 | 349 | 23 | 273 | |
| IC50 mean | NA | NA | NA | NA | 96 | 183 | 414 | 22 | 330 | |
| HT-144 | MM | >10,000 | 10,000 | 13 | >10,000 | 76 | 263 | 3786 | 353 | 900 |
| G-361 | PM | 9414 | 10,000 | 50 | >10,000 | 90 | 62 | 331 | 48 | 51 |
| C-32 | PM | >10,000 | 10,000 | >10,000 | >10,000 | 103 | 63 | 455 | 49 | 100 |
| SKMEL-28 | PM | >10,000 | >10,000 | 9227 | >10,000 | 280 | 1754 | 467 | 76 | 101 |
| IC50 (min–max) | 9414–10,000 | NA | 13->10,000 | NA | 76–280 | 62–1764 | 455–3786 | 48–353 | 5–900 | |
| IC50 median | NA | 10,000 | 4639 | NA | 97 | 163 | 461 | 63 | 101 | |
| IC50 mean | NA | NA | NA | NA | 137 | 536 | 1260 | 132 | 288 | |
| B16F10 | PM | >10,000 | 9396 | 8 | ∼5000 | >10,000 | >10,000 | >10,000 | 4499 | 2800 |
IC50 (nM) values obtained using the MTT assay. Data are expressed as means; S.E.M.s are less than <5% of the mean values in all cases.
Abbreviations: SSM, superficial spreading melanoma
NM, nodular melanoma
LN, lymph node melanoma metastasis
BM, brain melanoma metastasis
MM, metastatic melanoma
PM, primary melanoma
DTIC, dacarbazine
TMZ, temozolomide
NA, not applicable.
Figure 2.
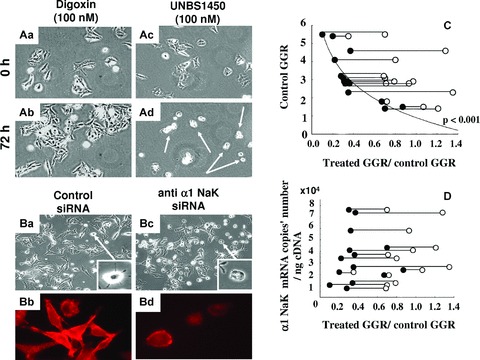
Cardenolide and anti-α1 siRNA effects on melanoma cells. (A) First (0 hr) and last (72 hrs) images of the videomicroscopic analysis of the effects of the cardenolides: digoxin (Aa & Ab) or UNBS1450 (Ac & Ad) both incubated at 100 nM on VM-21 melanoma cells. White arrows indicate the cell shrinkage induced by UNBS1450 treatment. (B) Light microscopy images of VM-21 cells transfected either with scrambled siRNA as a control (Ba) or with a sodium pump anti-α1 siRNA (Bc). The pictures were taken 3 days after the first transfection. Cell shrinkage was also evident in the anti-α1 siRNA transfected cells as indicated in the right corner panel. Immunofluorescent staining revealed a partial decrease in the expression of α1 sub-units in anti-α1 siRNA transfected VM-21 cells (Bd) compared with scrambled siRNA-transfected cells (Bb). (C) Global growth rates (GGR) over 72 hrs for each of the 14 melanoma cell lines evaluated were calculated on the basis of the videomicroscopic images generated under control or compound-treated conditions (see Materials and Methods). The data reported illustrate the relationship between the ratio of the compound-treated GGR values to the control GCR values on the x axis and the control GGR values (y axis). Each cell line is represented by two joined circles: the white ones relate to the digoxin (100 nM) ratio, whereas the black ones relate to the UNBS1450 (100 nM) ratio. A significant correlation fit was obtained for the UNBS1450 response. (D) Attempted correlation between the ratios of the GGR values (same × axis as in C) and the number of sodium pump α1 sub-unit mRNA copies present in each of the 14 melanoma cell lines. No correlation is evident.
Figure 4.
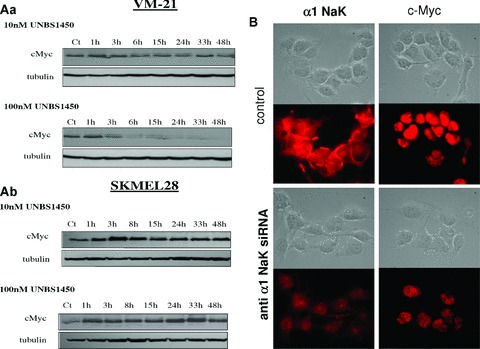
Changes in melanoma cell expression of cMyc on incubation with UNBS1450 or anti-α1 siRNA. (A) The kinetics of the decrease in cMyc expression in VM-21 (Aa) and SKMEL-28 (Ab) cells in the presence of UNBS1450 (10 and 100 nM) were evaluated by Western blot up to 48 hrs. Tubulin was used as the loading control. (B) Immunofluorescent staining of sodium pump α1 and cMyc protein in VM-21 cells either untreated (control) or transfected with the anti-α1 siRNA 3 days before the experiment. The decrease in α1 sub-unit expression is associated with a marked decrease in cMyc expression. The corresponding bright-field pictures are provided.
The GGR values were calculated as detailed above for each drug treatment (i.e. digoxin and UNBS1450) and cell type, and results expressed as the ratio between the treatment GGR values and the control GGR values on the × axis of Fig. 2C. Horizontal lines in Fig. 2C join the two drug treatments performed on a given cell line. The effects of 100 nM UNBS1450 (black circles) compared with 100 nM digoxin (open circles) on the GGRs of 10 human melanoma primary cell cultures and 4 established cell lines after 72 hrs of exposure to each compound were greatly more marked with the former (Fig. 2C). UNBS1450 almost completely blocked cell proliferation in the cell lines and primary cell cultures evaluated, with its efficacy appearing thus to markedly correlate to the growth rates of these melanoma cell lines. However, for both UNBS1450 and digoxin, there appeared to be no relationship between sodium pump α1 sub-unit mRNA copies present in the established cell lines and primary cell cultures and the anti-cancer effects of the two compounds reflected in their GGR ratios (Fig. 2D). This may relate to the high amounts of α1 sub-units in the melanoma cell lines studied (1 to 8 × 10⁴ mRNA copies/ng cDNA).
The in vitro anti-cancer efficacy of sodium pump α1 sub-unit inhibitors directly relates to their efficiency in decreasing cMyc expression
Changes in cell morphology were used to determine time-dependent anti-cancer effects of four cardiotonic steroids (UNBS1450 [UNBS], ouabain [OUA], digoxin [DIGO] and digitoxin [DIGI]) in five melanoma cell lines (VM-21, VM-24, C32, SKMEL-28 and B16F10). Typical illustrations of the anti-cancer effects over 72 hrs are given in Fig. 3 with respect to UNBS1450, the compound that induced the greatest changes in cell morphology. In these experiments, anti-tumour effects were determined to have occurred when more than 50% of melanoma cells present in the cultures presented a ‘rounded shape’ and ‘scrunched’ appearance, which is associated with impairment of both migration and proliferation [10, 13, 32]. Such marked morphological changes were not obtained with the three other cardenolides: ouabain, digoxin and digitoxin (data not shown). Previous work in NSCLC [13] and glioma [10] cell lines had already demonstrated that once tumour cells treated with cardiotonic steroids reach this rounded-shape stage, they irreversibly die from lysosomal membrane permeabilization-related and/or autophagy-related cell death. The rounded-shape morphology induced by cardiotonic steroid treatment is the result of a major disorganization of the actin cytoskeleton due to a dramatic drop in intracellular ATP. This actin disorganization impairs both cell proliferation (cytokinesis) and migration as already demonstrated for NSCLC [13], glioma [10] and prostate cancer [32] cells, and is associated with marked decreases in cMyc expression [32]. In these experiments in which the compounds were incubated at 100 nM, UNBS1450 proved to inhibit cell growth in human cell lines VM-21, VM-24, C32 and SKMEL-28 but not in mouse B16F10 consistent with IC50 data reported in Table 2 (5–76 nM versus 4499 nM, respectively).
Figure 3.
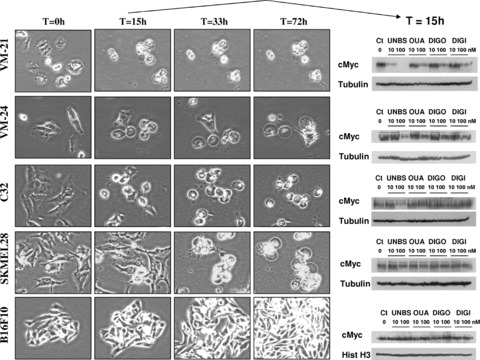
Morphological changes in melanoma cells and their expression of cMyc on incubation with cardenolides. The left panel illustrates the morphological changes seen in different melanoma cell lines (annotated on the left) over 72 hrs when incubated with 100 nM UNBS1450. Human VM-21 cells are the most sensitive, whereas the mouse B16F10 model is completely resistant to the treatment. The right panel corresponds to Western blot analysis of cMyc expression levels in each cell line after 15 hrs of exposure to four different cardenolides (UNBS: UNBS1450, OUA: ouabaïn, DIGO: digoxin and DIG I: digitoxin) at 10 and 100 nM. Although cMyc is down-regulated after UNBS1450 treatment (100 nM) in the VM-21, VM-24 and C32 responding cell lines, this is not the case in the poorly responding or non-responding SKMEL-28 and B16F10 cells. Tubulin or histone H3 blots were used as the loading controls.
After 15 hrs of incubation of VM-21 cells with 100 nM UNBS1450, most of these melanoma cells were of a rounded appearance, and Western blot analysis revealed cMyc expression to have been almost completely abolished; a feature not observed with the remaining three cardiotonic steroids. Similarly, UNBS1450 was more effective in decreasing cMyc expression in this cell line than the other cardenolides when used at 10 nM (Fig. 3). With respect to VM-24 and C32 cells, the majority achieved the rounded appearance at 33 hrs, whereas at 15 hrs only a minority of these cells had undergone this change. Accordingly, the effects of 100 nM UNBS1450 on cMyc expression at 15 hrs in VM-24 and C32 cells were less marked than those observed in VM-21 cells. However, UNBS1450 decreased cMyc expression in VM-21, VM-24 and C32 melanoma cells in a more pronounced manner than the remaining three cardenolides (Fig. 3). SKMEL-28 melanoma cells remained apparently healthy for the first 15 hrs of treatment with 100 nM UNBS1450, and accordingly there was no decrease in cMyc expression at 15 hrs, although by 72 hrs, cells showed the characteristic rounded appearance. This slower effect may relate to the higher UNBS1450 IC50 value against SKMEL-28 melanoma cells (76 nM) compared with that for VM-21 cells (8 nM; Table 2). As expected, given the very high IC50 values against mouse melanoma B16F10 for UNBS1450 and the other cardenolides studied (Table 2), no effect on cMyc was demonstrated in this cell line.
The data in Fig. 4A further confirm a rapid and sustained decrease in cMyc expression level in VM-21 cells when treated with 100 but not 10 nM UNBS1450, even after 3 hrs, whereas no such consistent decrease could be obtained in the SKMEL-28 cells even after 48 hrs of treatment. It thus seems possible that the early determination of cMyc down-regulation of expression (e.g. in vitro 15 hrs after the beginning of compound treatment) may enable one to predict whether a given melanoma cell line will be sensitive to the anti-cancer effects of cardiotonic steroids. Furthermore, cardiotonic steroid-mediated decreases in cMyc expression seem to result at least partly, from the inhibition of sodium pump α1 sub-unit expression and/or activity as assessed by the use of the anti-α1 siRNA in VM-21 melanoma cells (Fig. 4B).
Characterization of UNBS1450-induced effects on apoptosis
Use was made of highly cardenolide-sensitive VM-21 and more cardenolide-resistant SKMEL-28 melanoma cells for apoptosis assays: annexin V/propidium iodide staining and PARP (poly ADP ribose protein) cleavage analysis. Cells were exposed to UNBS1450 for 15 hrs to 40 hrs. After 15 hrs, the data show marked late apoptosis staining revealed by flow cytometry in VM-21 cells following 50 and 100 nM UNBS1450 treatment but effects were markedly less pronounced at 10 nM (Fig. 5Ab and Ba). This result was further validated by PARP cleavage analysis, evidencing characteristic apoptotic fragments notably at 100 nM after 24 hrs (Fig. 5Ca). Although a few populations of SKMEL-28 cells displayed apoptotic features in flow cytometry (Fig. 5Bb), even after 40 hrs of treatment with 100 nM UNBS1450 (Fig. 5Bb), PARP cleavage analysis did not indicate any apoptosis (Fig. 5Cb). Thus, the more resistant SKMEL-28 cells do not seem to undergo apoptotic programmed cell death following 100 nM UNBS1450 treatment. The marked decrease in cMyc expression in VM-21 cells induced by the sodium pump sub-unit targeting approach (Fig. 4) could therefore provoke a cMyc-dependent cellular crisis leading in turn to apoptosis [26], whereas UNBS1450 seems to kill SKMEL-28 cells via other cell death pathways.
Figure 5.
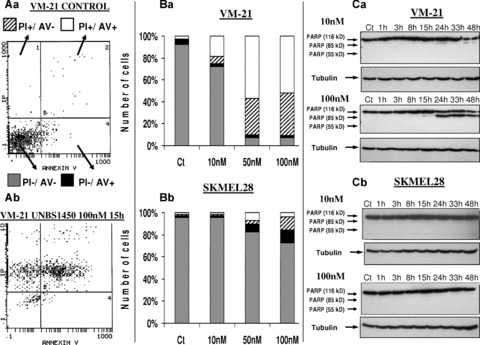
Induction of apoptosis in melanoma cell lines by UNBS1450. Apoptosis induction following UNBS1450 treatment was evaluated by means of double annexin V (AV) and propidium iodide (PI) staining analyzed by flow cytometry in VM-21 and SKMEL-28 cells. (A) Plots generated by flow cytometry for VM-21 cells left untreated (Aa) or treated for 15 hrs with 100 nM UNBS1450 (Ab). (B) Quantitative data for the percentage of cells presenting each staining combination are given for VM-21 cells treated for 15 hrs (Ba) and SKMEL-28 cells treated for 40 hrs (Bb) with 0, 10, 50 or 100 nM UNBS1450 (legend as detailed in [Aa]). (C) PARP cleavage analysis by means of Western blot in VM-21 (Ca) and SKMEL-28 (Cb) cells, respectively, treated either with 10 or 100 nM of UNBS1450 for up to 48 hrs. Apoptotic PARP fragments have a molecular weight of approximately 85 kD, whereas necrotic fragments are approximately 55 kD compared with the native protein, which is 116 kD. Tubulin was used as the loading control.
UNBS1450 improves the survival of immuno-deficient mice bearing human melanoma brain metastases
Given the high expression of sodium pump α1 sub-units in melanoma brain metastases, we investigated whether cardenolides could bring any therapeutic benefits to a new human melanoma brain metastases model. VM-48 cells, originating from human brain melanoma metastases, grafted directly into the brain of immuno-deficient nude mice produced typically invasive brain metastases as indicated in Fig. 6A and B. These VM-48-bearing mice were treated with either reference drugs: dacarbazine (80 mg/kg i.p.) or temozolomide (40 mg/kg i.v.) or with the novel cardenolide UNBS1450 (1 mg/kg i.v.). All drug treatments started 7 days after tumour grafting and employed a schedule of three injections per week (Monday, Wednesday and Friday) for three consecutive weeks. Figure 6C illustrates the survival of animals over time and reveals that in contrast to UNBS1450 (P < 0.01), neither dacarbazine nor temozolomide could bring any significant therapeutic benefit (P > 0.05).
Figure 6.
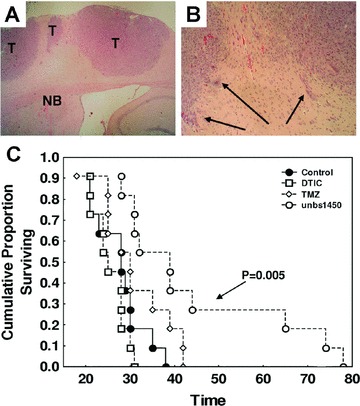
In vivo effects of UNBS1450 treatment in a human melanoma brain metastatic model. (A) Typical histology of melanoma brain metastases developed when grafting VM-48 cells into the brain of nude mice (HE; GX50). T: tumour and NB: normal brain tissue. Higher magnification (G × 100) is provided in (B). Black arrows point to infiltrative tumour cells in the normal brain parenchyma. (C) Kaplan–Meier survival analysis of VM-48-bearing mice either left untreated (control group: black circles) or treated with dacarbazine (DTIC: open squares: 80 mg/kg i.p.), temozolomide (open diamonds: 40 mg/kg i.v.) or UNBS1450 (open circles: 1 mg/kg i.v.) administered three times per week for 3 weeks.
Discussion
Ion channels and transporters play crucial roles in mediating a variety of physiological and pathological processes of cell biology [34]. For example, cell shape and volume changes are of crucial importance in aiding glioma cell migration because extracellular spaces in the brain are very narrow and represent a major obstacle that forces glioma cells to dynamically regulate their volume [35]. Pharmacological inhibition of Cl− channels in glioma cells impairs their ability to migrate and limits tumour progression in experimental tumour models [35]. One Cl−-channel inhibitor, chlorotoxin, has already reached Phase II clinical trials with the goal to treat malignant glioma [34]. K+ channel-dependent migration of B16 mouse [34] and human [36] melanoma cells has also been demonstrated. We have recently demonstrated that the sodium pump α1 sub-unit plays a crucial role in NSCLC [13, 16], glioma [10] and prostate cancer [32] cell biology, all without impacting Na+ and K+ exchange [10]. In fact, inhibiting the activity of the sodium pump α1 sub-unit sharply decreases intracellular ATP concentrations [10, 32], a process known to markedly disorganize the actin cytoskeleton [37], which in turn impairs both proliferation (at the level of cytokinesis) and migration. Inhibiting the activity of α1 sub-units is also known to result in dramatic cancer cell shrinkage [10, 13, 32], a phenomenon observed in the current study in a significant number of melanoma models (Fig. 3). It seems that it is actually α1 and not other α sub-units that are implicated in cardiotonic steroid-induced anti-tumour effects in melanoma cells given that (i) inhibiting α1 expression, even partly, by means of siRNA reproduces the effects observed with a selective α1 sub-unit antagonist, such as UNBS1450 (Fig. 2); (ii) only the α1 sub-unit is expressed in all human melanoma models studied (Fig. 1) and (iii) rodent tumour cells in which the sodium pump α1 sub-unit is twice mutated [32] leads to a 1000-fold decrease in sensitivity towards cardiotonic steroid-mediated anti-cancer effects when compared with human cancer cells [10, 13]. The latter was also observed in the current study with respect to the B16F10 mouse melanoma cells (Fig. 3 and Table 2).
Analysis of clinical samples by semi-quantitative immunohistochemistry revealed that more than 30% of all human melanomas, 50% of all melanoma metastases and 72% of brain melanoma metastases over-expressed sodium pump α1 sub-units compared with only 5% of naevi (Table 1). α1 Sub-unit expression significantly correlates with tumour thickness and disease progression. Furthermore, with respect to the α1 mRNA data obtained in the present study and the results that Boukerche et al.[12] reported in an earlier study, these values may even be underestimates given the immunohistochemical method used.
The in vivo data from the present study strongly suggest that targeting the sodium pump α1 sub-unit by using novel cardenolides such as UNBS1450 could bring greater clinical effectiveness in combating this cancer, in particular brain metastatic melanomas whose treatment still represents one of the biggest challenges in melanoma therapy. This statement is made given the activity of UNBS1450 in the particularly aggressive melanoma model studied, when neither of the two compounds used currently in clinical practice, dacarbazine and temozolomide [8], produced statistically significant activity in this model.
As already emphasized in the introduction, cMyc is an important player in melanoma biology aggressiveness [5, 21, 22, 23, 25, 26]. The data from the present study strongly suggest that UNBS1450 exerts part of its anti-cancer effects in melanoma cells through decreases in cMyc expression (Fig. 3). We recently showed in human prostate cancer cells that UNBS1450 mediates anti-tumour effects in part through the compound’s capacity to disorganize nucleolar structure and to impair CDK and cMyc expression and related signalling pathways [32]. Inhibition of cMyc expression in melanoma cells induces cellular crisis through co-operation between telomerase dysfunction and oxidative stress [26]. Cellular crisis is defined as an increase in cell size, multiple nuclei, vacuolated cytoplasm, induction of senescence-associated β-galactosidase activity and massive apoptosis [26]. The data from the present and previous studies [13, 32] indicate that the UNBS1450-mediated decreases in cMyc expression only partly reconcile the above-described data. Indeed, UNBS1450 induces marked vacuolization processes in cancer cells, causes decreases in cell size [10, 13, 16] and induces oxidative stress [32], features that have been reproduced in the case of melanoma cells in the present study (oxidative stress data not shown). One hundred nanomoles UNBS1450 treatment induced apoptosis in VM-21 melanoma cells, one of the most sensitive models studied (IC50: 8 nM; Table 2 and Fig. 3), while it was not the case with SKMEL-28 cells, one of the more UNBS1450-resistant melanoma models investigated (IC50: 76 nM; Table 2 and Fig. 3). However, UNBS1450 could kill SKMEL-28 cells via lysosomal membrane permeabilization-related cell death as demonstrated in NSCLC cells [16] or autophagy-related cell death as demonstrated in glioma cells [10].
The sodium pump is directly involved in cell migration [38]. cMyc is also implicated in cancer cell migration through Wnt/β-catenin signalling [39, 40]; a process that also involves the transcription factor Snail [40]. Snail binds to a non-canonical E-box in the sodium pump β1 sub-unit (which is biologically functional when associated with α sub-units) promoter and suppresses its promoter activity, a process that is associated with epithelial to mesenchymal transition [41]. Interactions between the sodium pump and the transcription factor Snail modify the expression of E-cadherin [41], which plays a major role in the epithelial–mesenchymal transition [42] observed during melanoma development [43]. Accordingly, modifications to E-cadherin expression are associated with melanoma biological aggressiveness [4, 43, 44].
Regulation of the cMyc oncogene remains unclear [45]. It has been recently emphasized that various microRNAs (miRNAs) modulate cMyc expression [45–47], whereas other miRNAs seem to be implicated in melanoma cell biology [48, 49]. Using an Affymetrix miRNA (High Wycombe, UK) array to investigate whether cardiotonic steroids actually modify the expression of miRNAs that could be implicated in cMyc regulation, treatment of VM-21 melanoma cells with 100 nM UNBS1450 for 4 hrs led to only minor decreases (0–40%) in a very limited number of miRNAs (data not shown). These included hsa-miR-605, hsa-miR-632, hsa-miR-658 and hsa-miR-661, which had already been reported to be part of the colorectal microRNAome [50], but not yet demonstrated, at least to the best of our knowledge, as part of the melanoma microRNAome. It thus seems unlikely that UNBS1450 modifies cMyc expression through marked modification in the expression of specific clusters of miRNAs.
UNBS1450 is a hemi-synthetic derivative of the novel cardiotonic steroid 2″-oxovoruscharin that was identified in the African plant Calotropis procera[29]. UNBS1450 displays a unique structure (a novel sugar double linked to the steroid skeleton) and a ‘flat’ conformation (trans-trans-cis) that confers a much higher binding affinity to sodium pump α sub-units, including the α1 sub-unit than other cardiotonic steroids (including ouabain and digoxin) [10, 13]. Exploratory toxicology in rats and dogs has also revealed that UNBS1450 is not more toxic (cardiotoxic) than digoxin (data not shown) and displays anti-cancer activity that is generally 10–100 times more pronounced than digitoxin [16] and digoxin [13]. These digitalis-related compounds (digitoxin and digoxin) remain important in the treatment of congestive heart failure, and although epidemiological studies had suggested their possible use in oncology, a narrow therapeutic index has prevented their development as anti-cancer agents [9]. UNBS1450, which has entered Phase I clinical trials in cancer patients, seems to be associated with a higher therapeutic index [9, 29, 32] and could be potentially of most benefit to those patients whose melanomas over-express sodium pump α1 sub-units, in particular those individuals with melanoma brain metastases as suggested by the in vivo data reported here.
Acknowledgments
This work has been supported by grants awarded by the Fonds Yvonne Boël (Brussels, Belgium) and by the Région de Bruxelles-Capitale (Brussels, Belgium).
References
- 1.Jemal A, Siegel R, Ward E, et al. Cancer statistics, 2008. CA Cancer J Clin. 2008;58:71–96. doi: 10.3322/CA.2007.0010. [DOI] [PubMed] [Google Scholar]
- 2.Onken MD, Worley LA, Ehlers JP, et al. Gene expression profiling in uveal melanoma reveals two molecular classes and predicts metastatic death. Cancer Res. 2004;64:7205–9. doi: 10.1158/0008-5472.CAN-04-1750. [DOI] [PMC free article] [PubMed] [Google Scholar]
- 3.Lefranc F, Facchini V, Kiss R. Proautophagic drugs: a novel means to combat apoptosis-resistant cancers, with a special emphasis on glioblastomas. Oncologist. 2007;12:1395–403. doi: 10.1634/theoncologist.12-12-1395. [DOI] [PubMed] [Google Scholar]
- 4.Jaeger J, Koczan D, Thiesen HJ, et al. Gene expression signatures for tumor progression, tumor subtype, and tumor thickness in laser-microdissected melanoma tissues. Clin Cancer Res. 2007;13:806–15. doi: 10.1158/1078-0432.CCR-06-1820. [DOI] [PubMed] [Google Scholar]
- 5.Pastorino F, Brignole C, Marimpietri D, et al. Targeted liposomal c-myc antisense oligodeoxynucleotides induce apoptosis and inhibit tumor growth and metastases in human melanoma models. Clin Cancer Res. 2003;9:4595–605. [PubMed] [Google Scholar]
- 6.Lejeune FJ, Rimoldi D, Speiser D. New approaches in metastatic melanoma: biological and molecular targeted therapies. Expert Rev Anticancer Ther. 2007;7:701–13. doi: 10.1586/14737140.7.5.701. [DOI] [PubMed] [Google Scholar]
- 7.Mathieu V, Le Mercier M, De Neve N, et al. Galectin-1 knockdown increases sensitivity to temozolomide in a B16F10 mouse metastatic melanoma model. J Invest Dermatol. 2007;127:2399–410. doi: 10.1038/sj.jid.5700869. [DOI] [PubMed] [Google Scholar]
- 8.Tawbi HA, Kirkwood JM. Management of metastatic melanoma. Semin Oncol. 2007;34:532–45. doi: 10.1053/j.seminoncol.2007.09.008. [DOI] [PubMed] [Google Scholar]
- 9.Mijatovic T, Van Quaquebeke E, Delest B, et al. Cardiotonic steroids on the road to anti-cancer therapy. BBA Rev Cancer. 2007;1776:32–57. doi: 10.1016/j.bbcan.2007.06.002. [DOI] [PubMed] [Google Scholar]
- 10.Lefranc F, Mijatovic T, Kondo Y, et al. Targeting the alpha1 subunit of the sodium pump to combat glioblastoma cells. Neurosurgery. 2008;62:211–21. doi: 10.1227/01.NEU.0000311080.43024.0E. [DOI] [PubMed] [Google Scholar]
- 11.Lefranc F, Kiss R. The sodium pump alpha1 subunit as a potential target to combat apoptosis-resistant glioblastomas. Neoplasia. 2008;10:198–206. doi: 10.1593/neo.07928. [DOI] [PMC free article] [PubMed] [Google Scholar]
- 12.Boukerche H, Su ZZ, Kang DC, et al. Identification and cloning of genes displaying elevated expression as a consequence of metastatic progression in human melanoma cells by rapid subtraction hybridization. Gene. 2004;343:191–201. doi: 10.1016/j.gene.2004.09.002. [DOI] [PubMed] [Google Scholar]
- 13.Mijatovic T, Roland I, Van Quaquebeke E, et al. The alpha-1 subunit of the sodium pump could represent a novel target to combat non-small cell lung cancers. J Pathol. 2007;212:170–9. doi: 10.1002/path.2172. [DOI] [PubMed] [Google Scholar]
- 14.Seligson DB, Rajasekaran SA, Yu H, et al. Na,K-adenosine triphosphatase alpha1-subunit predicts survival of renal clear cell carcinoma. J Urol. 2008;179:338–45. doi: 10.1016/j.juro.2007.08.094. [DOI] [PubMed] [Google Scholar]
- 15.Sakai H, Suzuki T, Maeda M, et al. Up-regulation of Na(+),K(+)-ATPase alpha-3 isoform and down-regulation of the alpha-1 isoform in human colorectal cancer. FEBS Lett. 2004;563:151–4. doi: 10.1016/S0014-5793(04)00292-3. [DOI] [PubMed] [Google Scholar]
- 16.Mijatovic T, Mathieu V, Gaussin JF, et al. Cardenolide-induced lysosomal membrane permeabilization demonstrates therapeutic benefits in experimental human non-small cell lung cancers. Neoplasia. 2006;8:402–12. doi: 10.1593/neo.05850. [DOI] [PMC free article] [PubMed] [Google Scholar]
- 17.La Porta CA. Drug resistance in melanoma: new perspectives. Curr Med Chem. 2007;14:387–91. doi: 10.2174/092986707779941078. [DOI] [PubMed] [Google Scholar]
- 18.Hersey P, Zhuang L, Zhang XD. Current strategies in overcoming resistance of cancer cells to apoptosis: melanoma as a model. Int Rev Cytol. 2006;251:131–58. doi: 10.1016/S0074-7696(06)51004-6. [DOI] [PubMed] [Google Scholar]
- 19.Lefranc F, Brotchi J, Kiss R. Possible future issues in the treatment of glioblastomas: special emphasis on cell migration and the resistance of migrating glioblastoma cells to apoptosis. J Clin Oncol. 2005;23:2411–22. doi: 10.1200/JCO.2005.03.089. [DOI] [PubMed] [Google Scholar]
- 20.Bucci B, D’Agnano I, Amendola D, et al. Myc down-regulation sensitizes melanoma cells to radiotherapy by inhibiting MLH1 and MSH2 mismatch repair proteins. Clin Cancer Res. 2005;11:2756–67. doi: 10.1158/1078-0432.CCR-04-1582. [DOI] [PubMed] [Google Scholar]
- 21.Grover R, Chana J, Grobbelaar AO, et al. Measurement of c-myc oncogene expression provides an accurate prognostic marker for acral lentiginous melanoma. Br J Plast Surg. 1999;52:122–6. doi: 10.1054/bjps.1998.3024. [DOI] [PubMed] [Google Scholar]
- 22.Ramsden AJ, Grover R, Chana J, et al. A prospective analysis of c-myc oncoprotein levels as a prognostic marker in malignant melanoma. J Plast Reconstr Aesthet Surg. 2007;60:626–30. doi: 10.1016/j.bjps.2006.11.001. [DOI] [PubMed] [Google Scholar]
- 23.Tulley PN, Neale M, Jackson D, et al. The relation between c-myc expression and interferon sensitivity in uveal melanoma. Br J Ophthalmol. 2004;88:1563–7. doi: 10.1136/bjo.2003.033498. [DOI] [PMC free article] [PubMed] [Google Scholar]
- 24.Zupi G, Scarsella M, Semple SC, et al. Antitumor efficacy of bcl-2 and c-myc antisense oligonucleotides in combination with cisplatin in human melanoma xenografts: relevance of the administration sequence. Clin Cancer Res. 2005;11:1990–8. doi: 10.1158/1078-0432.CCR-04-1284. [DOI] [PubMed] [Google Scholar]
- 25.Schlagbauer-Wadl H, Griffioen M, van Elsas A, et al. Influence of increased c-Myc expression on the growth characteristics of human melanoma. J Invest Dermatol. 1999;112:332–6. doi: 10.1046/j.1523-1747.1999.00506.x. [DOI] [PubMed] [Google Scholar]
- 26.Biroccio A, Amodei S, Antonelli A, et al. Inhibition of c-Myc oncoprotein limits the growth of human melanoma cells by inducing cellular crisis. J Biol Chem. 2003;278:35693–701. doi: 10.1074/jbc.M304597200. [DOI] [PubMed] [Google Scholar]
- 27.Mathieu V, Mijatovic T, van Damme M, et al. Gastrin exerts pleiotropic effects on human melanoma cell biology. Neoplasia. 2005;10:930–43. doi: 10.1593/neo.05379. [DOI] [PMC free article] [PubMed] [Google Scholar]
- 28.Berger W, Hauptmann E, Elbling L, et al. Possible role of the multidrug resistance-associated protein (MRP) in chemoresistance of human melanoma cells. Int J Cancer. 1997;71:108–15. doi: 10.1002/(sici)1097-0215(19970328)71:1<108::aid-ijc18>3.0.co;2-e. [DOI] [PubMed] [Google Scholar]
- 29.Van Quaquebeke E, Simon G, André A, et al. Identification of a novel cardenolide (2″-oxovoruscharin) from Calotropis procera and the hemisynthesis of novel derivatives displaying potent in vitro antitumor activities and high in vivo tolerance: structure-activity relationship analyses. J Med Chem. 2005;48:849–56. doi: 10.1021/jm049405a. [DOI] [PubMed] [Google Scholar]
- 30.Branle F, Lefranc F, Camby I, et al. Evaluation of the efficiency of chemotherapy in in vivo orthotopic models of human glioma cells with and without 1p19q deletions and in C6 rat orthotopic allografts serving for the evaluation of surgery combined with chemotherapy. Cancer. 2002;95:641–55. doi: 10.1002/cncr.10710. [DOI] [PubMed] [Google Scholar]
- 31.Lefranc F, Mijatovic T, Mathieu V, et al. Characterization of gastrin-induced proangiogenic effects in vivo in orthotopic U373 experimental human glioblastomas and in vitro in human umbilical vein endothelial cells. Clin Cancer Res. 2004;10:8250–65. doi: 10.1158/1078-0432.CCR-04-0343. [DOI] [PubMed] [Google Scholar]
- 32.Mijatovic T, De Nëve N, Gailly P, et al. The nucleolus and c-Myc: potential targets of cardenolide-mediated anti-tumor activity. Mol Cancer Ther. 2008;7:1285–96. doi: 10.1158/1535-7163.MCT-07-2241. [DOI] [PubMed] [Google Scholar]
- 33.Dumont P, Ingrassia L, Rouzeau S, et al. The Amaryllidaceae isocarbostyril narciclasine induces apoptosis by activation of the death receptor and/or mitochondrial pathways in cancer cells but not in normal fibroblasts. Neoplasia. 2007;9:766–76. doi: 10.1593/neo.07535. [DOI] [PMC free article] [PubMed] [Google Scholar]
- 34.Liu LY, Hu CL, Ma LJ, et al. ET-1 inhibits B-16 murine melanoma cell migration by decreasing K(+) currents. Cell Motil Cytoskeleton. 2004;58:127–36. doi: 10.1002/cm.20002. [DOI] [PubMed] [Google Scholar]
- 35.McFerrin MB, Sontheimer H. A role for ion channels in glioma cell invasion. Neuron Glia Biol. 2006;2:39–49. doi: 10.1017/S17440925X06000044. [DOI] [PMC free article] [PubMed] [Google Scholar]
- 36.Schwab A, Reinhardt J, Schneider SW, et al. K(+) channel-dependent migration of fibroblasts and human melanoma cells. Cell Physiol Biochem. 1999;9:126–32. doi: 10.1159/000016309. [DOI] [PubMed] [Google Scholar]
- 37.Molitoris BA, Geerdes A, McIntosh JR. Dissociation and redistribution of Na+,K(+)-ATPase from its surface membrane actin cytoskeletal complex during cellular ATP depletion. J Clin Invest. 1991;88:462–9. doi: 10.1172/JCI115326. [DOI] [PMC free article] [PubMed] [Google Scholar]
- 38.Barwe SP, Anilkumar G, Moon SY, et al. Novel role for Na,K-ATPase in phosphatidylinositol 3-kinase signaling and suppression of cell motility. Mol Biol Cell. 2005;16:1082–94. doi: 10.1091/mbc.E04-05-0427. [DOI] [PMC free article] [PubMed] [Google Scholar]
- 39.Cappellen D, Schlange T, Bauer M, et al. Novel c-Myc target genes mediate differential effects on cell proliferation and migration. EMBO Rep. 2007;8:70–6. doi: 10.1038/sj.embor.7400849. [DOI] [PMC free article] [PubMed] [Google Scholar]
- 40.Larriba MJ, Valle N, Pálmer HG, et al. The inhibition of Wnt/beta-catenin signaling by 1alpha, 25-dihydroxyvitamin D3 is abrogated by Snail1 in human colon cancer cells. Endocr Relat Cancer. 2007;14:141–51. doi: 10.1677/ERC-06-0028. [DOI] [PubMed] [Google Scholar]
- 41.Espineda CE, Chang JH, Twiss J, et al. Repression of Na,K-ATPase beta1-subunit by the transcription factor Snail in carcinoma. Mol Biol Cell. 2004;15:1364–73. doi: 10.1091/mbc.E03-09-0646. [DOI] [PMC free article] [PubMed] [Google Scholar]
- 42.Imamichi Y, Menke A. Signaling pathways involved in collagen-induced disruption of the E-cadherin complex during epithelial-mesenchymal transition. Cells Tissues Organs. 2007;185:180–90. doi: 10.1159/000101319. [DOI] [PubMed] [Google Scholar]
- 43.Robert G, Gaggioli C, Bailet O, et al. SPARC represses E-cadherin and induces mesenchymal transition during melanoma development. Cancer Res. 2006;66:7516–23. doi: 10.1158/0008-5472.CAN-05-3189. [DOI] [PubMed] [Google Scholar]
- 44.Onken MD, Ehlers JP, Worley LA, et al. Functional gene expression analysis uncovers phenotypic switch in aggressive uveal melanomas. Cancer Res. 2006;66:4602–9. doi: 10.1158/0008-5472.CAN-05-4196. [DOI] [PMC free article] [PubMed] [Google Scholar]
- 45.Sampson VB, Rong NH, Han J, et al. MicroRNA Let-7a down-regulates Myc and reverts Myc-induced growth in Burkitt Lymphoma cells. Cancer Res. 2007;67:9762–70. doi: 10.1158/0008-5472.CAN-07-2462. [DOI] [PubMed] [Google Scholar]
- 46.Esquela-Kerscher A, Slack FJ. Oncomirs – microRNAs with a role in cancer. Nat Rev Cancer. 2006;6:259–69. doi: 10.1038/nrc1840. [DOI] [PubMed] [Google Scholar]
- 47.Mendell JT. MicroRNAs. Critical regulators of development, cellular physiology and malignancy. Cell Cycle. 2005;4:1179–84. doi: 10.4161/cc.4.9.2032. [DOI] [PubMed] [Google Scholar]
- 48.Gaur A, Jewell DA, Liang Y, et al. Characterization of microRNA expression levels and their biological correlates in human cancer cell lines. Cancer Res. 2007;67:2456–68. doi: 10.1158/0008-5472.CAN-06-2698. [DOI] [PubMed] [Google Scholar]
- 49.Zhang L, Huang J, Yang N, et al. MicroRNAs exhibit high frequency genomic alterations in human cancer. Proc Natl Acad Sci USA. 2006;103:9136–41. doi: 10.1073/pnas.0508889103. [DOI] [PMC free article] [PubMed] [Google Scholar]
- 50.Cummins JM, He Y, Leary RJ, et al. The colorectal microRNAome. Proc Natl Acad Sci USA. 2006;103:3687–92. doi: 10.1073/pnas.0511155103. [DOI] [PMC free article] [PubMed] [Google Scholar]