

Abstract
The gastrointestinal tract plays a critical role in the regulation of energy homeostasis by initiating neural and hormonal responses to the ingestion of nutrients. In addition to peptide hormones, such as cholecystokinin (CKK) and peptide YY (PYY), the lipid-derived mediator oleoylethanolamide (OEA) has been implicated in the control of satiety. Previous studies in humans and rodent models have shown that obesity is associated with changes in CCK, PYY and other gut-derived peptide hormones, which may contribute to decreased satiety and increased energy intake. In the present study, we show that small-intestinal OEA production is disrupted in the gut of diet-induced obese (DIO) rats and mice. In lean rodents, feeding or duodenal infusion of Intralipid® or pure oleic acid stimulate jejunal OEA mobilization. This response is strikingly absent in DIO rats and mice. Confirming previous reports, we found that feeding rats or mice a high-fat diet for 7 days is sufficient to suppress jejunal OEA mobilization. Surprisingly, a similar effect is elicited by feeding rats and mice a high-sucrose low-fat diet for 7 days. Collectively, our findings suggest that high fat-induced obesity is accompanied by alterations in the post-digestive machinery responsible for OEA biosynthesis, which may contribute to reduced satiety and hyperphagia.
Keywords: Dietary Fat, Diet-Induced Obesity, Oleoylethanolamide, Linoleoylethanolamide, Satiety
1. INTRODUCTION
The gastrointestinal (GI) tract plays a critical role in the regulation of energy homeostasis by releasing hunger- and satiety-inducing peptide hormones, such as ghrelin, cholecystokinin (CCK), and peptide YY (PYY) [1]. In addition to these peptides, food intake also promotes the formation of the lipid-derived mediator, oleoylethanolamide (OEA), which causes satiety, enhances lipid absorption, promotes lipolysis and reduces body weight [2, 3]. Detailed investigations have shown that intake of dietary fat is necessary and sufficient to trigger OEA production, which primarily occurs in jejunal and duodenal enterocytes [4]. Specifically, these studies have demonstrated that diet-derived oleic acid is taken up by enterocytes and used as substrate for the biosynthesis of the membrane phospholipid, N-oleoyl-phosphatidylethanolamine (NOPE), which is cleaved by an N-acylphosphatidylethanolamine-selective phospholipase D (NAPE-PLD) to generate OEA [2, 4]. A substantial body of evidence indicates that OEA elicits long-lasting satiety in animal models, primarily by prolonging the post meal interval and reducing meal frequency [3, 5–10]. These effects differentiate the anorexic actions of OEA from those of CCK, which exclusively affects meal size and duration [11]. The anorexic response caused by OEA was shown to involve: (i) local activation of the nuclear receptor, peroxisome proliferator-activated receptor type-α (PPAR-α); (ii) stimulation of afferent sensory fibers, possibly of the vagus nerve; and (iii) recruitment of appetite-controlling circuits in the brain that use oxytocin and histamine as neurotransmitters [6, 12, 13]. Collectively, the available data indicate that OEA signaling is an important contributor to the post-ingestive regulation of fat intake [2].
In obesity, impairment in gastrointestinal responses to nutrients and subsequent gut peptide secretion may be at least partially responsible for decreased satiety and increased energy intake [14]. Consistent with this idea, postprandial plasma levels of CCK and PYY were found to be reduced in obese human subjects, relative to lean controls [15]. Additionally, an intestinal pre-load with fat (oleic acid) failed to suppress food intake in obese people who exhibit attenuated levels of CCK and PYY, suggesting that gastrointestinal responses to dietary fat are dampened in obesity [16]. The mechanism underlying this defective response to nutrients remains unclear, although specific diets, especially high-fat diet (HFD), are likely involved. Upon prolonged exposure to a moderately HFD (30–45 kcal% as fat), a sub-population of rats develop obesity, whereas the rest remain resistant [17, 18]. Consistent with what is observed in obese humans, diet-induced obese (DIO) rats display reduced levels of CCK and PYY relative to DIO-resistant animals [19]. Further, compared to obesity-resistant rats, DIO rats exhibit a dampened suppression of subsequent energy intake following intragastric administration of Intralipid® [18]. Even further, decreases in plasma glucagon-like peptide-1 (GLP-1) levels and in the sensitivity of GLP-1 receptors was evident as early as 4 weeks into HFD (60 kcal% as fat) maintenance [20].
Previous studies have shown that short-term exposure to a HFD lowers OEA levels in the small intestine of rodents [21, 22]. In the present report, we asked whether diet-induced obesity produces a similar effect. Our results show that jejunal OEA mobilization induced by feeding or intraduodenal fat infusion is completely disrupted in DIO rats and mice.
2. MATERIALS AND METHODS
2.1. Chemicals
Octadecenoyl chlorides (c18:1n-7, t18:1n-7 and t18:1n-9), fatty acids (oleic acid, heptadecanoic acid and heptadecenoic acid), and 1, 2, 3-trihexadecenoyl-sn-glycerol were purchased from Nu-Check Prep (Elysian, MN, USA). Fatty acid ethanolamides (FAEs) [OEA and stearoylethanolamide (SEA)] and deuterium-containing internal standards for FAEs [[2H4]OEA and [2H4]palmitoylethanolamide (PEA)] were obtained from Cayman Chemical (Ann Arbor, MI, USA). Ethanolamine, Intralipid®, sucrose, peptone (from meat, Type I), and liquid chromatography (LC)-grade solvents were from Sigma-Aldrich (St. Louis, MO, USA). Emplex® was a generous gift from Caravan Ingredients (Lenexa, KS, USA). Other chemicals and reagents were purchased from either Sigma-Aldrich or Fisher Scientific (Pittsburgh, PA, USA).
2.2. Chemical synthesis of octadecenoylethanolamides
Octadecenoylethanolamides (c18:1n-7, t18:1n-7 and t18:1n-9) were synthesized by the reaction of fatty acyl chlorides (0.3 μmol) with a 10-fold molar excess of ethanolamine (3 μmol), in dichloromethane (18 ml) [5]. Reactions were conducted on ice for 15 min and the reaction tubes were inverted 3 times during the course of the reaction. The products were washed 4 times with water (20 ml), dehydrated over sodium sulfate, filtered, and dried under N2. The final products were characterized by thin-layer chromatography (TLC) [9] and LC-mass spectrometry (LC-MS), as described below. Purity of the resulting octadecenoylethanolamides was >97%.
2.3. Animals
All experimental procedures were approved by the Animal Care and Use Committee of University of California, Irvine. Male Sprague-Dawley rats (8–12 weeks) were purchased from Charles River Laboratories (Wilmington, MA, USA). Male C57BL/6J mice (10–14 weeks) and male diet-induced obese (DIO) C57BL/6J mice [10 weeks, maintained on 60 kcal% fat diet (Research Diet Inc., New Brunswick, NJ, USA) for 4 weeks] were obtained from Jackson Laboratory (Bar Harbor, ME, USA). Upon arrival, animals were acclimated for at least 1 week in our animal facility (temperature, 22°C; humidity, 30–60%), with a controlled 12 h light/12 h dark cycle (on at 6:30 a.m., off at 6:30 p.m.). Animals were provided with ad libitum access to water and food, except for experiments that involved 24-h food deprivation (details are provided below, under Experimental Design)
2.4. Diets
Rats and mice were fed a HFD diet (60 kcal% as fat and 7 kcal% as sucrose, 5.24 kcal/g, D12492, Research Diets Inc.) for 5 weeks (rats) or 6 weeks (mice). Animals fed a standard rodent chow (16 kcal% as fat, 3.1 kcal/g, 2020X, Harlan, Madison, WI, USA) served as controls. In separate experiments, rats and mice were fed either the HFD or the LF-HSD (35 kcal% as sucrose, 10 kcal% as fat, 3.85 kcal/g, D12450B, Research Diets Inc.) for 7 days, to evaluate short-term effects of the diet per se. Details of fatty acid composition of the diets are shown in Supplemental Table 1.
2.5. Surgery
Catheters were surgically implanted in the duodenum of rats to directly deliver nutrients into the jejunum. Surgical implantation in rats was performed as described previously [23]. Briefly, the animals were anesthetized with ketamine (100 mg/kg, i.p.; Ketaject®, Phoenix Pharmaceutical, Burlingame, CA, USA) and xylazine (10 mg/kg, i.p.; AnaSed®, Lloyd Inc., Shenandoah, IA, USA), and an incision (2.5 cm) was made through the skin and abdominal muscle below the xiphoid process. The duodenum was gently exposed and a small puncture was made using a needle into its ventral wall, 1.5 cm distal to the pylorus. A 1.5 cm Silastic tube (0.012″ ID × 0.037″ OD, Technical Products Inc., Valencia, CA, USA) was inserted through the puncture, facing toward the distal intestine. The tube was fitted 0.5 cm into a slightly larger tube of the same material (0.040″ ID × 0.085″ OD, 20 cm length) with a pre-fabricated 3 mm square piece of monofilament polypropylene mesh (Bard® Mesh, Warwick, RI, USA) around the junction and sealed with silicon adhesive (100% silicone adhesive, DAP Products Inc., Baltimore, MD, USA). Tissue adhesive (Vetbond™, 3M, St. Paul, MN, USA) was applied to the mesh to ease its adhesion to the duodenum. The outer portion of the tube, with the attached square piece of mesh, was subcutaneously routed to the back of the neck, exteriorized, and then sutured to the underlying tissue. The incisions were closed with stainless steel wound clips (World Precision Instruments, Sarasota, FL, USA). The outer end of the duodenal catheter was plugged with a stainless steel nail to avoid leakage of intestinal fluids. The catheter was regularly flushed with sterile saline (0.5 ml) to avoid blockage. Following surgery, rats were individually housed and provided with free access to food and water. They were allowed 7–10 days for surgical recovery before experiments.
2.6. Experimental design
2.6.1. Effects of feeding restriction on FAE and fatty acid levels
At the end of the respective feeding regimen, we determined FAE and fatty acid content in the jejunum mucosa of rats and mice under different feeding conditions. Animals were housed individually in wired-bottom cages to avoid coprophagia and were acclimated to this housing condition for at least 3 days. They were randomly assigned to the following three groups: free-feeding, food deprived and food deprived/refed. Food deprivation was conducted for 24 h (from 9 a.m. to 9 a.m.). Similar to the food-deprived group, animals in the refeeding group were deprived of food for 24 h; however, these animals were provided access to the food for 30 min prior to sacrifice. Animals were anesthetized using isoflurane and the jejunum was collected. The jejunum was opened and rinsed with ice-cold phosphate-buffer saline. The mucosal layer was scraped onto a glass plate using glass slides, and was immediately frozen in liquid N2. All tissue samples were stored at −80°C until time of processing.
2.6.2. Effects of intraduodenal infusions on FAE levels in jejunum of lean and DIO rats
We determined FAE levels in the jejunum of lean and DIO rats following intraduodenal infusion of specific macronutrients. Rats implanted with intraduodenal catheters were housed individually in wired-bottom cages and were acclimated to this housing condition for at least 3 days. They were deprived of food for 24 h (from 9 a.m. to 9 a.m.) prior to intraduodenal infusion of macronutrients or pure fatty acids. Macronutrients used in the current study were: Intralipid® (fat), sucrose (carbohydrate) and peptone (protein). Intralipid® (20% fat emulsion, 2 kcal/ml) was used without dilution, whereas sucrose and peptone were dissolved in water to obtain a final energy content of 2 kcal/ml. Details of the fatty acid composition of Intralipid® are shown in Supplemental Table 1. Pure oleic acid was dissolved in water containing 0.4% Emplex® (a food emulsifier) to obtain a final concentration of 5% w/v. Saline or 0.4% Emplex® solution was used as control. Infusions were conducted at a rate of 0.5 ml/min for 10 min (infusion volume was 5 ml/rat). Rats were sacrificed 30 min after the beginning of the infusion. Jejunum mucosa was removed as previously described, and stored at −80°C until time of processing.
2.7. Lipid extraction
Tissue (20–50 mg) from jejunum mucosa was homogenized in methanol (1 ml) containing the following internal standards: [2H4]OEA (100 pmol), [2H4]PEA (100 pmol) and heptadecanoic acid (500 pmol). Lipids were extracted using chloroform (2 ml) and water (1 ml) [24]. The organic phases were dried under N2, reconstituted in chloroform (2 ml) and applied to open-bed silica gel columns to fractionate lipid groups based on polarity, as described previously [25]. Eluted fractions containing FAEs and fatty acids (chloroform/methanol, 9:1, v/v) were dried under N2 and the residue was reconstituted in a solvent mixture of chloroform and methanol (1:3, v/v) for LC-MS analyses. To analyze fatty acid content in the diets and Intralipid®, total lipids were extracted from the diet (10 mg) or Intralipid® (5 μl) with an appropriate amount of standard (100 nmol of 1, 2, 3-trihexadecenoyl-sn-glycerol). Total lipids in the extracts were hydrolyzed in 90% methanol containing 0.3 M sodium hydroxide for 2 h at 60°C. The samples were washed with n-hexane to remove esterified lipids, acidified with 6 N hydrochloric acid, and non-esterified fatty acids were extracted with n-hexane. The organic phase was removed and dried under N2, and the residues were reconstituted in a solvent mixture of chloroform and methanol (1:3, v/v) for LC-MS analyses.
2.8. FAE analysis
FAE levels were measured using an LC system consisting of an Agilent 1100 system and 1946D mass spectrometer detector equipped with electrospray ionization interface (Agilent Technologies, Santa Clara, CA, USA). FAEs were separated on a ZORBAX Eclipse XDB-C18 column (2.1 ×100 mm, 1.8 μm, Agilent Technologies) using an acetonitrile gradient. Solvent A consisted of water containing 0.1% formic acid, and Solvent B consisted of acetonitrile containing 0.1 % formic acid. The gradient profile of the solvents was as follows: 0–15 min, 65% B; 15–16 min, 65–100% B linear gradient; 16–26 min, 100% B; 26–28 min, 100–65% B linear gradient; 28–30 min, 65% B. The flow rate was 0.3 ml/min, and the column temperature was maintained at 15°C. Electrospray ionization interface was in the positive ionization mode, capillary voltage was set at 3 kV, and the fragmentor voltage was set at 70 V. N2 was used as a drying gas at a flow rate of 12 liters/min and a temperature of 350°C. The nebulizer pressure was set at 40 psi. Selected ion monitoring (SIM) mode was used to monitor protonated molecular ions [M+H]+ of FAEs (endogenous and [2H4]standard). OEA and vaccinoylethanolamide (VEA) were quantified using [2H4]OEA as a standard, and SEA was quantified using [2H4]PEA. Absolute amounts of FAEs were quantified using a calibration curve.
2.9. Fatty acid analysis
Fatty acids were analyzed by LC-MS using a ZORBAX Eclipse XDB-C18 column (4.6 × 50 mm, 1.8 μm, Agilent Technologies). Solvent A consisted of water containing 0.5% acetic acid and 5 mM ammonium acetate, and Solvent B consisted of methanol containing 0.5% acetic acid and 5 mM ammonium acetate. The gradient profile of the solvents was as follows: 0–2.5 min, 90–100% B linear gradient; 2.5–5 min, 100% B; 5–5.5 min, 100–90% B linear gradient, 5.5–7 min, 90% B. The flow rate was 1.5 ml/min and the column temperature was maintained at 40°C. Electrospray ionization interface was in the negative ionization mode, capillary voltage was set at 4 kV, and fragmentor voltage was set at 120 V. N2 was used as a drying gas at a flow rate of 13 liters/min and a temperature of 350°C. The nebulizer pressure was set at 60 psi. SIM mode was used to monitor deprotonated molecular ions [M-H]− of fatty acids. Heptadecanoic acid (m/z 269) was used as an internal standard. Absolute amounts of fatty acids were quantified using a calibration curve that was generated using heptadecenoic acid (m/z 267) and heptadecanoic acid.
2.10. Statistical analyses
Results are expressed as mean ± SEM. Data were analyzed using GraphPad Prism software (GraphPad Software Inc., La Jolla, CA, USA). Differences between groups were considered significant if P < 0.05. Statistical significance was evaluated by unpaired Student’s t-test or one way analysis of variance (ANOVA), as appropriate. Post hoc analyses were conducted using Newman-Keuls multiple comparison test or Dunnett’s test, to compare means when significant differences were found.
3. RESULTS
3.1. LC-MS separation of octadecenoylethanolamide isomers
Several LC-MS methods are available for the measurement of OEA and other long-chain FAEs in biological samples [25, 27]. However, these methods seldom take into consideration the positional and geometrical isomers of the FAE under analysis. Octadecenoylethanolamides present in biological samples derive from oleic acid (c18:1n-9), but also from its positional isomer vaccenic acid (c18:1n-7) and from the trans-octadecenoic acids, elaidic acid (t18:1n-9) and trans-vaccenic acid (t18:1n-7), which are commonly found in dairy products [26]. The presence of these various isomers can confound the quantitative analysis of OEA [27, 28], particularly in an organ such as the gut, which is exposed to a variety of diet-derived lipids. To obviate this problem, we developed an LC-MS protocol that allows for the baseline separation of four main octadecenoylethanolamides: OEA, VEA, trans-VEA and elaidoylethanolamide (EEA) (Fig. 1A). Using the analytical conditions described in the Methods section, VEA eluted from the LC column at 12.2 min, followed by OEA at 12.8 min, tVEA at 13.5 min, and EEA at 14.0 min (Fig. 1A). The calibration curves demonstrated linearity within the range of 0.015–8.3 pmol/injection. Fig. 1B shows a typical SIM chromatogram of endogenous octadecenoylethanolamides extracted from the mucosa of rat jejunum. OEA and VEA are present and well separated in these samples. By contrast, tVEA and EEA are not detectable.
Figure 1.
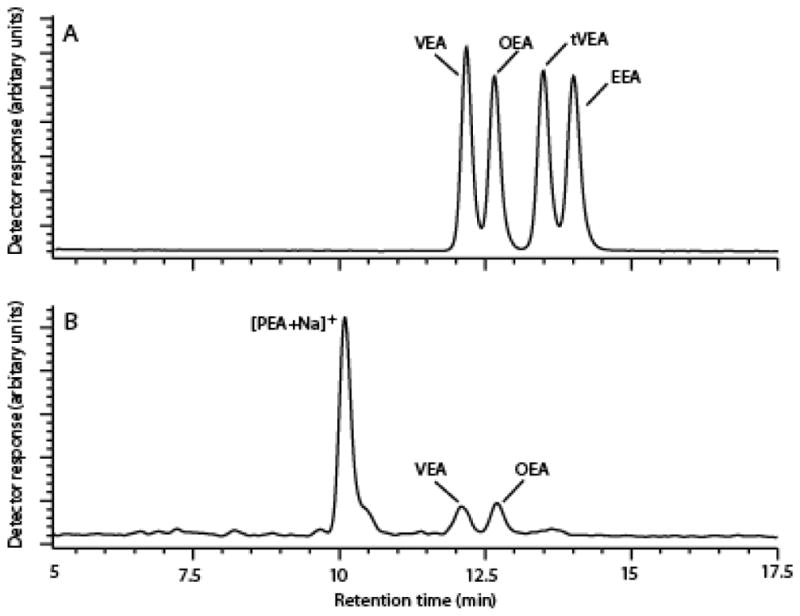
Chromatographic separation of OEA and VEA.
(A) Representative chromatogram of octadecenoylethanolamides (selected-ion monitoring, SIM, m/z 326). Authentic standards of OEA, VEA, tVEA and EEA were injected (0.5 pmol/injection).
(B) Representative SIM chromatogram of octadecenoylethanolamides extracted from rat jejunum mucosa. Five μl of lipid extract prepared from rat jejunum mucosa were injected.
3.2. Effect of obesity on feeding-induced FAE mobilization
We previously reported that food intake stimulates OEA mobilization in the gut of lean mice and rats fed a standard chow [3, 29]. Consistent with those results, we found that food deprivation reduces, and 30 min refeeding reinstates, jejunal OEA levels in chow-fed rats (Fig. 2A1). Jejunal OEA content was 23.3 ± 1.8 pmol/g under food-deprived conditions, and 10 times higher during free feeding (207 ± 25 pmol/g) and refeeding (253 ± 13 pmol/g). Similar changes were seen with LEA (Fig. 2A2), but not with VEA (Fig. 2A3), SEA (Fig. 2A4) and PEA (Fig. 2A5). In striking contrast with these findings, food-induced mobilization of OEA and LEA was markedly blunted or altogether absent in the jejunum of DIO rats (Fig. 2B1–2), in which the levels of VEA and SEA, but not PEA, were also higher than lean rats (Fig. 2B3–5). Similar results were obtained in mice (Table 1). These findings indicate that feeding-induced mobilization of OEA, but not LEA, is selectively disrupted in the gut of DIO rats and mice.
Figure 2.

Effects of HFD-induced obesity on FAE mobilization in rat jejunum.
Effects of free feeding (FF), 24-h food deprivation (FD), and 30-min refeeding (RF) after 24-h food deprivation on jejunal levels of OEA (A1 and B1), LEA (A2 and B2) and VEA (A3 and B3) SEA (A4 and B4) and PEA (A5 and B5) in lean (A) and DIO (B) rats.
Results are expressed as mean ± SEM (n=4–8/feeding condition). ***P<0.001, FF vs. FD and RF vs. FD.
Table 1.
Feeding-induced mobilization of FAEs in the jejunum of lean and DIO mice.
| Lean mice
|
DIO mice
|
|||||
|---|---|---|---|---|---|---|
| FF | FD | RF | FF | FD | RF | |
| pmol/g | ||||||
| OEA | 269 ± 46 | 63 ± 7** | 165 ± 26* | 77 ± 16 | 54 ± 4 | 78 ± 4 |
| LEA | 2412 ± 412 | 147 ± 13*** | 819 ± 107***, ## | 142 ± 17 | 81 ± 15* | 113 ± 5 |
| VEA | 38 ± 4 | 50 ± 3 | 43 ± 9 | 77 ± 16 | 53 ±4 | 78 ± 14 |
| SEA | 104 ± 13 | 105 ± 7 | 79 ± 10 | 193 ± 24 | 183 ± 12 | 142 ± 7 |
| PEA | 690 ± 79 | 1578 ± 469 * | 747 ± 43 # | 156 ± 18 | 164 ± 17 | 187 ± 28 |
Effects of free-feeding (FF), 24-h food deprivation (FD), and 30-min refeeding after 24-h food deprivation (RF) on jejunal levels of OEA, LEA, VEA, SEA and PEA in lean and DIO mice. Results are expressed as mean ± SEM (n=4–5/feeding condition).
P<0.05,
P<0.01 and
P<0.001, compared to FF;
P<0.05 and
P<0.01, compared to FD.
3.3. Effect of diet-induced obesity on 18-carbon fatty acid levels
Next, we measured jejunal 18-carbon fatty acids – oleic and vaccenic acids, which co-eluted using our LC-MS method, and stearic acid – that are precursors/metabolites of OEA, VEA and LEA. In both lean and DIO rats, jejunal levels of octadecenoic acids (18:1, oleic and vaccenic) were reduced following 24-h food deprivation and were rapidly restored by refeeding (Fig. 3A1 and B1). By contrast, food deprivation did not substantially alter jejunal levels of stearic acid (18:0) in either lean or DIO rats (Fig. 3A2 and B2). The fatty-acid composition of the diets utilized in these experiments is reported in Supplemental Table 1. The results suggest that the suppression of OEA mobilization that accompanies HFD-induced obesity cannot be attributed to a reduced overall availability of oleic acid, a precursor for OEA biosynthesis [4].
Figure 3.

Effects of DIO on levels of octadecenoic acids (oleic and vaccenic) and stearic acid in rat jejunum.
Levels of octadecenoic acids (A1 and B1) and stearic acid (A2 and B2) in lean (A) and DIO (B) rats under FF, FD and RF conditions. Oleic and vaccenic acids were not separated under the chromatographic conditions used. Results are expressed as mean ± SEM (n=4–8/feeding condition). *P<0.05, FF vs. FD and RF vs. FD.
3.4. Intraduodenal infusion of Intralipid® or oleic acid fails to mobilize OEA in DIO rats
We confirmed previous results indicating that intraduodenal Intralipid® infusion increases jejunal OEA levels in lean rats, whereas infusion of peptone or sucrose does not (Fig. 4A1) [4]. Jejunal levels of LEA (Fig. 4A2) and SEA (Fig. 4A4) were also increased by lipid infusion, whereas sucrose and peptone had no such effect (Fig. 4A2–A4). No changes in VEA levels were observed under these conditions (Fig. 4A3). In the jejunum of DIO rats, intraduodenal lipid infusion failed to increase OEA and SEA mobilization (Fig. 4B1, 4), but was still able to change the levels of LEA (Fig. 4B2). As previously shown (Fig. 2A4, B4), the baseline jejunal levels of SEA were higher in DIO rats than lean controls (Fig. 4A4, B4). These results are suggestive of a differential regulation of FAE production in response to dietary lipids.
Figure 4.

Effects on intraduodenal lipid infusion on FAE mobilization in jejunum of DIO rats.
Effects of intraduodenal infusion of various macronutrients on jejunal levels of OEA, LEA, VEA and SEA in (A) lean and (B) DIO rats. S, saline; L, Intralipid®; C, sucrose; P, peptone.
Rats were deprived of food for 24 h prior to infusions. Infusions were conducted at 0.5 ml/min for 10 min with nutrients equicaloric at 2 kcal/ml. Jejunum mucosa was harvested 30 min after starting the infusion. Results are expressed as mean ± SEM (n=4–5/infusion). **P<0.01 and ***P<0.001, saline vs. Intralipid®.
Next, we quantified jejunal FAE levels after intraduodenal infusion of oleic acid, a precursor for enterocyte OEA biosynthesis [4], in the gut of lean and DIO rats. We utilized oleic acid emulsions at a concentration of fatty acid that is comparable (5% w/v; 885 μmol/5 ml/rat) to that found in Intralipid® [740 μmol esterified octadecenoic acid (predominantly oleic acid)/5ml of 20% Intralipid®; Supplemental Table 1]. Consistent with prior reports [4], oleic acid infusion increased jejunal levels of OEA in lean rats (Fig. 5A1). This response was abolished in DIO rats (Fig. 5B1). As expected from previous work [4], oleic acid infusion did not affect levels of LEA (Fig. 5A2, B2), VEA (Fig. 5A3, B3) or SEA (Fig. 5A4, B4). These findings indicate that the conversion of dietary oleic acid into OEA is selectively disrupted in diet-induced obesity.
Figure 5.

Effects of intraduodenal oleic acid infusion on FAE mobilization in the jejunum of DIO rats.
Intraduodenal infusion of oleic acid (OA) on jejunal levels of OEA, LEA, VEA and SEA in lean (A) and DIO (B) rats. Rats were deprived of food for 24 h prior to infusions. Infusions were conducted at 0.5 ml/min for 10 min with either vehicle (V) or 5% oleic acid emulsion. Jejunum mucosa was harvested 30 min after starting the infusion. Results are expressed as mean ± SEM (n=3–5/infusion). ***P<0.001, vehicle vs. OA.
3.5. Attenuation of FAE mobilization in the jejunum of rodents fed a HFD for 7 days
Short-term exposure to a HFD decreases total FAE levels, especially PEA and LEA, in the intestine of lean rats [21, 22, 30]. To replicate these findings, we measured jejunal FAE levels in rats and mice fed a HFD for 7 days and then exposed to different feeding conditions (free-feeding, 24-h food deprivation and 30-min refeeding after 24-h food deprivation). The results show that a 7-day exposure to HFD is sufficient to disrupt the food-induced mobilization of OEA and LEA (Fig. 6A, B). Moreover, the levels of OEA and LEA were substantially lower in HFD-exposed rats than controls (Fig. 6A, B). No such changes were seen with other FAEs (Fig. 6C–E). Similar results were obtained in mice (Table 2), such that between-group differences in jejunal FAE levels were statistically insignificant. We conclude that short-term exposure to a HFD disrupts feeding-induced OEA and LEA mobilization in the gut. The selectivity of this effect highlights again the differences in biosynthetic regulation among bioactive FAEs.
Figure 6.

Feeding-dependent FAE mobilization in the jejunum of rats fed a HFD for 7 days.
Levels of OEA (A), LEA (B), VEA (C), SEA (D) and PEA (E) of rats fed a HFD for 7 days. Results are expressed as mean ± SEM (n=5–6/feeding condition).
Table 2.
Feeding-induced mobilization of FAEs in the jejunum mice fed a HFD for 7 days.
| Mice
|
|||
|---|---|---|---|
| FF | FD | RF | |
| pmol/g | |||
| OEA | 53.2 ± 4.9 | 36.2 ± 16.2 | 49.4 ± 6.0 |
| LEA | 177 ± 8 | 228 ± 7 | 160 ± 36 |
| VEA | 42.3 ± 3.6 | 45.3 ± 2.7 | 27.4 ± 5.2 |
| SEA | 82.6 ± 5.3 | 92.3 ± 11.4 | 97.7 ± 31.2 |
| PEA | 94.4 ± 7.6 | 120 ±12 | 139 ± 41 |
Jejunal levels of OEA, LEA, VEA, SEA and PEA in mice. Results are expressed as mean ± SEM (n=4–5/feeding condition).
3.6. Attenuation of FAE mobilization in jejunum of rodents fed a LF-HSD diet for 7 days
The LF-HSD (35 kcal% sucrose and 10 kcal% fat) is often used as a control diet for studies that employ DIO models fed an HFD (7 kcal% sucrose and 60 kcal% fat). However, high-sucrose diets are known to induce hypertriglycemia and insulin resistance, in the absence of pathological diabetes or obesity. We assessed therefore the short-term effects of a LF-HSD on jejunal levels of OEA and other FAEs. Surprisingly, we found that rats or mice fed the LF-HSD diet for 7 days showed an impaired jejunal mobilization of OEA and LEA (Table 3). These findings indicate that short-term exposure to a LF-HSD alters jejunal OEA mobilization in a manner similar to HFD-induced obesity.
Table 3.
Feeding-induced mobilization of FAEs in the jejunum of rats and mice fed a LF-HSD for 7 days.
| Rats | Mice | |||||
|---|---|---|---|---|---|---|
|
| ||||||
| FF | FD | RF | FF | FD | RF | |
| pmol/g | ||||||
| OEA | 60.9 ± 13.0 | 74.8 ± 11.0 | 50.8 ± 13.2 | 55.7 ± 5.5 | 72.6 ± 15.2 | 45.5 ± 5.8 |
| LEA | 522 ± 35 | 403 ± 88 | 646 ± 143 | 142 ± 15 | 149 ± 27 | 143 ± 28 |
| VEA | 41.2 ± 4.3 | 66.8 ± 12.6 | 40.9 ± 2.6 | 26.9 ± 3.4 | 36.9 ± 5.5 | 30.0 ± 6.9 |
| SEA | 103 ± 10 | 121 ± 23 | 111 ± 17 | 123 ± 9 | 121 ± 17 | 94 ± 14 |
| PEA | 241 ± 20 | 458 ± 154 | 303 ± 73 | 233 ± 14 | 309 ± 39 | 248 ± 32 |
Jejunal levels of OEA, LEA, VEA, SEA and PEA in mice. Results are expressed as mean ± SEM; n=5/feeding condition.
4. DISCUSSION
In the present study, we show that feeding-dependent mobilization of OEA and LEA is disrupted in the gut of rats and mice rendered obese by exposure to a HFD. Furthermore, we demonstrate that intraduodenal infusion of Intralipid® or oleic acid fails to mobilize OEA in the jejunum of DIO rats, suggesting that exposure to fat-rich foods can alter the enzymatic machinery involved in OEA and LEA mobilization. Additionally, we report the unexpected finding that 7-day maintenance on a diet high in sucrose can also disable feeding-dependent OEA and LEA mobilization. The results suggest that FAE-mediated satiety signaling is suppressed by high fat or high sucrose in the diet, and that this suppression might contribute to hyperphagia and the development of obesity.
We describe a new LC-MS method that enabled us to separate four major octadecenoylethanolamide isomers: OEA, VEA, EEA, and t-VEA. Developing such a method was necessary because previous studies had reported that OEA and VEA co-elute using current LC-MS protocols [27, 28]. The new procedure allowed us to obtain baseline separation of OEA from VEA and to reliably quantify both analytes in biological samples. The results, showing profound feeding-dependent changes in OEA in the gut of chow-fed rodents, confirmed our previous work [3, 29]. VEA levels did not change in response to feeding and the source of this lipid was not further investigated.
The gastrointestinal tract regulates energy intake by releasing, in response to nutrients, appetite-controlling peptides and lipid mediators. Evidence indicates that peptide signaling is impaired in obesity. For example, postprandial levels of CCK and PYY are attenuated in obese humans and rodents [15, 16, 18, 19]. Furthermore, expression of CCK, PYY and GLP-1 is reduced in the proximal intestine in DIO rats [19]. Despite the widely accepted role of OEA as a gut-derived satiety factor [3, 5–10], the impact of obesity on OEA mobilization has remained undefined. In the present study, we confirmed prior reports [3, 29] indicating that food deprivation reduces and feeding restores jejunal OEA levels in chow-fed rats and mice. We also found that this feeding-dependent process is strikingly absent in DIO animals, suggesting that OEA-mediated satiety signaling is impaired in obesity. Similar to OEA, jejunal LEA was also regulated by feeding and this process was disrupted in DIO rats and mice. These results are consistent with reports indicating that LEA, like OEA, exerts anorexic effects in rats [30]. Interestingly, obesity impaired the ability of Intralipid® to produce OEA, but not LEA, pointing to subtle mechanistic differences in the regulation of these two FAEs.
Our previous work employing the intraduodenal nutrient infusion procedure, which bypasses oral sensory responses [31], identified a post-ingestive mechanism underlying the production of OEA from dietary lipids [4]. Here, we replicated those findings and extended them by showing that Intralipid® and oleic acid-induced OEA mobilization is absent in the obese gut. Importantly, even though DIO rodents were exposed to substantial amounts of dietary octadecenoic acids (oleic and vaccenic acids), the jejunal levels of these lipids were not different between chow-fed and DIO rats. These findings suggest that the dietary composition of fatty acids is not directly correlated with the regulation of specific FAEs.
Intestinal levels of OEA were diminished in rats fed a HFD (38–45 kcal%) for 7 days, compared to controls (11–14 kcal%) [21, 22]. Consistent with those findings, here we show that 7-day feeding of HFD (60 kcal%) decreases OEA levels in the gut of rats and mice, compared to standard chow-fed rodents (16 kcal%). These results suggest that short-term exposure to a HFD reduces OEA-mediated signaling in the gut. Interestingly, 7-day feeding of high fat-high oleic acid diet (45 kcal%, the diet contained oleic acid rich-olive oil) did not reduce intestinal OEA levels, while reducing levels of PEA and LEA [30]. We interpret these findings to indicate that under short-term feeding conditions both fatty acid composition and quantity of dietary fat are critical regulators of OEA-dependent signaling.
In contrast to OEA and LEA, feeding did not mobilize VEA, PEA and SEA in chow-fed or DIO rodents, suggesting that the production of these molecules is differentially regulated in the gut. Interestingly, SEA and VEA levels were increased in jejunum of DIO rodents, compared to chow-fed or 7-day HFD-fed rodents. Previous studies have reported marked accumulation of SEA in injured tissues, including rat testis following cadmium-chloride-induced inflammation [32] and rodent brain following cerebral ischemia or damage associated with neurodegeneration [33, 34]. Also, acute systemic administration of SEA was found to counteract passive cutaneous anaphylaxis in adult mice [35]. These data prompt us to speculate that increased levels of SEA in the gut of DIO rodents may be indicative of a para-inflammatory response induced by long-term exposure to HFD [36].
Our results are consistent with those reported by Tellez et al, who demonstrated the existence of decreases in small-intestinal OEA levels in mice following long-term exposure to HFD (15 weeks, 60 kcal% as fat) compared to control low-fat diet (10 kcal% as fat), which contains high sucrose (35 kcal% as sucrose) [37]. On the other hand, high content of dietary sucrose is known to induce hypertriglycemia, insulin resistance and liver lesions in rodents. Furthermore, our results demonstrate that 7-day exposure to the LF-HSD disrupts feeding-dependent OEA mobilization, suggesting that dietary high sucrose, like dietary fat, influences OEA-dependent satiety signaling. Further experiments will be needed to determine the molecular mechanism underlying this effect.
Specific sensors of nutrients, including lipids, are expressed in the gut and activation of these sensors results in modulation of feeding behavior [2, 38–40]. The polyfunctional transmembrane glycoprotein CD36 is one such lipid sensor and/or transporter that is highly expressed on the brush border membrane of duodenum and jejunum enterocytes [39]. Our prior studies have reported that OEA levels are decreased in the small intestine of CD36-null mice following food consumption [4]. Although the functions of CD36 in the small intestine are likely to be multiple and complex, the available data suggest that this protein plays a critical role in the post-digestive production of OEA. Interestingly, Tran et al reported that luminal lipids cause the disappearance of CD36 from the brush border membrane of the enterocyte through an ubiquitin-mediated degradation pathway [41]. Presumably, HFD-feeding may influence localization of CD36 to the brush boder membrane, likely due to sustained stimulation and subsequent desensitization to luminal lipids. These results raise the intriguing possibility that decreased OEA levels in the DIO gut may be due to, at least in part, alterations in dietary lipid-sensing mechanism mediated through CD36. Future experiments will address this hypothesis.
Our understanding of the enzymatic pathways involved in the production and degradation of OEA remains incomplete. Thus far, NAPE-PLD and glycerophosphodiesterase 1 (GDE1) have been shown to be involved in OEA biosynthesis [42, 43]. Previous studies demonstrated that feeding-dependent mobilization of jejunal OEA is associated with alterations in NAPE-PLD activity and expression in chow-fed rats [29]. Furthermore, NAPE-PLD mRNA and activity of GDE1 are decreased in the jejunum of rats fed a HFD for 7 days [30]. Also, a recent study suggests the possible role of GDE4 in the biosynthesis of FAEs [44]. As far as degradation of OEA is concerned, the hydrolysis of OEA into oleic acid and ethanolamine is considered to be the primary mechanism through which the biological actions of this lipid mediator are terminated. Two intracellular amidases have been implicated in this process, namely, fatty acid amide hydrolase and N-acylethanolamine acid amidase [45, 46]. The present results suggest that prolonged HFD exposure impairs OEA biosynthesis and/or enhances OEA degradation, a possibility that will be investigated in future studies.
In conclusion, the present results reveal that feeding-dependent OEA mobilization is impaired in the gut of obese rodents. Additionally, a similar reduction is evident upon short-term exposure to HFD as well as a LF-HSD, which may contribute to hyperphagia and impaired satiety. Deepening our mechanistic understanding of intestinal OEA signaling in the obese gut will assist in the development of appropriate pharmacological and nutritional strategies to control appetite in obesity.
Supplementary Material
Acknowledgments
This research was supported by National Institute of Diabetes and Digestive and Kidney Diseases (NIDDK 073955).
ABBREVIATIONS
- CCK
Cholecystokinin
- DIO
Diet-induced Obesity
- FAE
Fatty Acid Ethanolamide
- GLP-1
Glucagon-like peptide-1
- LC-MS
Liquid Chromatography-Mass Spectrometry
- LEA
Linoleoylethanolamide
- OEA
Oleoylethanolamide
- PEA
Palmitoylethanolamide
- PYY
Peptide YY
- SEA
Stearoylethanolamide
- VEA
Vaccinoylethanolamide
Footnotes
Publisher's Disclaimer: This is a PDF file of an unedited manuscript that has been accepted for publication. As a service to our customers we are providing this early version of the manuscript. The manuscript will undergo copyediting, typesetting, and review of the resulting proof before it is published in its final citable form. Please note that during the production process errors may be discovered which could affect the content, and all legal disclaimers that apply to the journal pertain.
References
- 1.Stanley S, Wynne K, McGowan B, Bloom S. Hormonal regulation of food intake. Physiological reviews. 2005;85:1131–1158. doi: 10.1152/physrev.00015.2004. [DOI] [PubMed] [Google Scholar]
- 2.Piomelli D. A fatty gut feeling. Trends in endocrinology and metabolism: TEM. 2013;24:332–341. doi: 10.1016/j.tem.2013.03.001. [DOI] [PMC free article] [PubMed] [Google Scholar]
- 3.Rodriguez de Fonseca F, Navarro M, Gomez R, Escuredo L, Nava F, Fu J, Murillo-Rodriguez E, Giuffrida A, LoVerme J, Gaetani S, Kathuria S, Gall C, Piomelli D. An anorexic lipid mediator regulated by feeding. Nature. 2001;414:209–212. doi: 10.1038/35102582. [DOI] [PubMed] [Google Scholar]
- 4.Schwartz GJ, Fu J, Astarita G, Li X, Gaetani S, Campolongo P, Cuomo V, Piomelli D. The lipid messenger OEA links dietary fat intake to satiety. Cell metabolism. 2008;8:281–288. doi: 10.1016/j.cmet.2008.08.005. [DOI] [PMC free article] [PubMed] [Google Scholar]
- 5.Astarita G, Rourke BC, Andersen JB, Fu J, Kim JH, Bennett AF, Hicks JW, Piomelli D. Postprandial increase of oleoylethanolamide mobilization in small intestine of the Burmese python (Python molurus) American journal of physiology. Regulatory, integrative and comparative physiology. 2006;290:R1407–1412. doi: 10.1152/ajpregu.00664.2005. [DOI] [PubMed] [Google Scholar]
- 6.Fu J, Gaetani S, Oveisi F, Lo Verme J, Serrano A, Rodriguez De Fonseca F, Rosengarth A, Luecke H, Di Giacomo B, Tarzia G, Piomelli D. Oleylethanolamide regulates feeding and body weight through activation of the nuclear receptor PPAR-alpha. Nature. 2003;425:90–93. doi: 10.1038/nature01921. [DOI] [PubMed] [Google Scholar]
- 7.Gaetani S, Oveisi F, Piomelli D. Modulation of meal pattern in the rat by the anorexic lipid mediator oleoylethanolamide. Neuropsychopharmacology: official publication of the American College of Neuropsychopharmacology. 2003;28:1311–1316. doi: 10.1038/sj.npp.1300166. [DOI] [PubMed] [Google Scholar]
- 8.Nielsen MJ, Petersen G, Astrup A, Hansen HS. Food intake is inhibited by oral oleoylethanolamide. Journal of lipid research. 2004;45:1027–1029. doi: 10.1194/jlr.C300008-JLR200. [DOI] [PubMed] [Google Scholar]
- 9.Oveisi F, Gaetani S, Eng KT, Piomelli D. Oleoylethanolamide inhibits food intake in free-feeding rats after oral administration. Pharmacological research: the official journal of the Italian Pharmacological Society. 2004;49:461–466. doi: 10.1016/j.phrs.2003.12.006. [DOI] [PubMed] [Google Scholar]
- 10.Proulx K, Cota D, Castaneda TR, Tschop MH, D’Alessio DA, Tso P, Woods SC, Seeley RJ. Mechanisms of oleoylethanolamide-induced changes in feeding behavior and motor activity. American journal of physiology. Regulatory, integrative and comparative physiology. 2005;289:R729–737. doi: 10.1152/ajpregu.00029.2005. [DOI] [PubMed] [Google Scholar]
- 11.Wren AM, Bloom SR. Gut hormones and appetite control. Gastroenterology. 2007;132:2116–2130. doi: 10.1053/j.gastro.2007.03.048. [DOI] [PubMed] [Google Scholar]
- 12.Provensi G, Coccurello R, Umehara H, Munari L, Giacovazzo G, Galeotti N, Nosi D, Gaetani S, Romano A, Moles A, Blandina P, Passani MB. Satiety factor oleoylethanolamide recruits the brain histaminergic system to inhibit food intake. Proceedings of the National Academy of Sciences of the United States of America. 2014;111:11527–11532. doi: 10.1073/pnas.1322016111. [DOI] [PMC free article] [PubMed] [Google Scholar]
- 13.Gaetani S, Fu J, Cassano T, Dipasquale P, Romano A, Righetti L, Cianci S, Laconca L, Giannini E, Scaccianoce S, Mairesse J, Cuomo V, Piomelli D. The fat-induced satiety factor oleoylethanolamide suppresses feeding through central release of oxytocin. The Journal of neuroscience: the official journal of the Society for Neuroscience. 2010;30:8096–8101. doi: 10.1523/JNEUROSCI.0036-10.2010. [DOI] [PMC free article] [PubMed] [Google Scholar]
- 14.Maljaars J. Overeating makes the gut grow fonder; new insights in gastrointestinal satiety signaling in obesity. Current opinion in gastroenterology. 2013;29:177–183. doi: 10.1097/MOG.0b013e32835d9fe0. [DOI] [PubMed] [Google Scholar]
- 15.Zwirska-Korczala K, Konturek SJ, Sodowski M, Wylezol M, Kuka D, Sowa P, Adamczyk-Sowa M, Kukla M, Berdowska A, Rehfeld JF, Bielanski W, Brzozowski T. Basal and postprandial plasma levels of PYY, ghrelin, cholecystokinin, gastrin and insulin in women with moderate and morbid obesity and metabolic syndrome. Journal of physiology and pharmacology: an official journal of the Polish Physiological Society. 2007;58(Suppl 1):13–35. [PubMed] [Google Scholar]
- 16.Stewart JE, Seimon RV, Otto B, Keast RS, Clifton PM, Feinle-Bisset C. Marked differences in gustatory and gastrointestinal sensitivity to oleic acid between lean and obese men. The American journal of clinical nutrition. 2011;93:703–711. doi: 10.3945/ajcn.110.007583. [DOI] [PubMed] [Google Scholar]
- 17.Levin BE. Sympathetic activity, age, sucrose preference, and diet-induced obesity. Obesity research. 1993;1:281–287. doi: 10.1002/j.1550-8528.1993.tb00622.x. [DOI] [PubMed] [Google Scholar]
- 18.Duca FA, Zhong L, Covasa M. Reduced CCK signaling in obese-prone rats fed a high fat diet. Hormones and behavior. 2013;64:812–817. doi: 10.1016/j.yhbeh.2013.09.004. [DOI] [PubMed] [Google Scholar]
- 19.Duca FA, Swartz TD, Sakar Y, Covasa M. Decreased intestinal nutrient response in diet-induced obese rats: role of gut peptides and nutrient receptors. Int J Obes (Lond) 2013;37:375–381. doi: 10.1038/ijo.2012.45. [DOI] [PubMed] [Google Scholar]
- 20.Williams DL, Hyvarinen N, Lilly N, Kay K, Dossat A, Parise E, Torregrossa AM. Maintenance on a high-fat diet impairs the anorexic response to glucagon-like-peptide-1 receptor activation. Physiology & behavior. 2011;103:557–564. doi: 10.1016/j.physbeh.2011.04.005. [DOI] [PMC free article] [PubMed] [Google Scholar]
- 21.Artmann A, Petersen G, Hellgren LI, Boberg J, Skonberg C, Nellemann C, Hansen SH, Hansen HS. Influence of dietary fatty acids on endocannabinoid and N-acylethanolamine levels in rat brain, liver and small intestine. Biochimica et biophysica acta. 2008;1781:200–212. doi: 10.1016/j.bbalip.2008.01.006. [DOI] [PubMed] [Google Scholar]
- 22.Diep TA, Madsen AN, Krogh-Hansen S, Al-Shahwani M, Al-Sabagh L, Holst B, Hansen HS. Dietary non-esterified oleic Acid decreases the jejunal levels of anorectic N-acylethanolamines. PloS one. 2014;9:e100365. doi: 10.1371/journal.pone.0100365. [DOI] [PMC free article] [PubMed] [Google Scholar]
- 23.DiPatrizio NV, Astarita G, Schwartz G, Li X, Piomelli D. Endocannabinoid signal in the gut controls dietary fat intake. Proceedings of the National Academy of Sciences of the United States of America. 2011;108:12904–12908. doi: 10.1073/pnas.1104675108. [DOI] [PMC free article] [PubMed] [Google Scholar]
- 24.Folch J, Lees M, Sloane Stanley GH. A simple method for the isolation and purification of total lipides from animal tissues. The Journal of biological chemistry. 1957;226:497–509. [PubMed] [Google Scholar]
- 25.Astarita G, Piomelli D. Lipidomic analysis of endocannabinoid metabolism in biological samples. Journal of chromatography. B, Analytical technologies in the biomedical and life sciences. 2009;877:2755–2767. doi: 10.1016/j.jchromb.2009.01.008. [DOI] [PMC free article] [PubMed] [Google Scholar]
- 26.Seppanen-Laakso T, Laakso I, Backlund P, Vanhanen H, Viikari J. Elaidic and trans-vaccenic acids in plasma phospholipids as indicators of dietary intake of 18:1 trans-fatty acids. Journal of chromatography. B, Biomedical applications. 1996;687:371–378. doi: 10.1016/s0378-4347(96)00256-3. [DOI] [PubMed] [Google Scholar]
- 27.Balvers MG, Wortelboer HM, Witkamp RF, Verhoeckx KC. Liquid chromatography-tandem mass spectrometry analysis of free and esterified fatty acid N-acyl ethanolamines in plasma and blood cells. Analytical biochemistry. 2013;434:275–283. doi: 10.1016/j.ab.2012.11.008. [DOI] [PubMed] [Google Scholar]
- 28.Lehtonen M, Storvik M, Malinen H, Hyytia P, Lakso M, Auriola S, Wong G, Callaway JC. Determination of endocannabinoids in nematodes and human brain tissue by liquid chromatography electrospray ionization tandem mass spectrometry. Journal of chromatography. B, Analytical technologies in the biomedical and life sciences. 2011;879:677–694. doi: 10.1016/j.jchromb.2011.02.004. [DOI] [PubMed] [Google Scholar]
- 29.Fu J, Astarita G, Gaetani S, Kim J, Cravatt BF, Mackie K, Piomelli D. Food intake regulates oleoylethanolamide formation and degradation in the proximal small intestine. The Journal of biological chemistry. 2007;282:1518–1528. doi: 10.1074/jbc.M607809200. [DOI] [PMC free article] [PubMed] [Google Scholar]
- 30.Diep TA, Madsen AN, Holst B, Kristiansen MM, Wellner N, Hansen SH, Hansen HS. Dietary fat decreases intestinal levels of the anorectic lipids through a fat sensor. FASEB journal: official publication of the Federation of American Societies for Experimental Biology. 2011;25:765–774. doi: 10.1096/fj.10-166595. [DOI] [PubMed] [Google Scholar]
- 31.Greenberg D, Smith GP. The controls of fat intake. Psychosomatic medicine. 1996;58:559–569. doi: 10.1097/00006842-199611000-00004. [DOI] [PubMed] [Google Scholar]
- 32.Kondo K, Yamasoba T, Suzuki I. Internal auditory canal inflammation: a cause of sudden vertigo. Otolaryngology--head and neck surgery: official journal of American Academy of Otolaryngology-Head and Neck Surgery. 1998;119:138–140. doi: 10.1016/S0194-5998(98)70186-X. [DOI] [PubMed] [Google Scholar]
- 33.Berger C, Schmid PC, Schabitz WR, Wolf M, Schwab S, Schmid HH. Massive accumulation of N-acylethanolamines after stroke. Cell signalling in acute cerebral ischemia? Journal of neurochemistry. 2004;88:1159–1167. doi: 10.1046/j.1471-4159.2003.02244.x. [DOI] [PubMed] [Google Scholar]
- 34.Degn M, Lambertsen KL, Petersen G, Meldgaard M, Artmann A, Clausen BH, Hansen SH, Finsen B, Hansen HS, Lund TM. Changes in brain levels of N-acylethanolamines and 2-arachidonoylglycerol in focal cerebral ischemia in mice. Journal of neurochemistry. 2007;103:1907–1916. doi: 10.1111/j.1471-4159.2007.04892.x. [DOI] [PubMed] [Google Scholar]
- 35.Dalle Carbonare M, Del Giudice E, Stecca A, Colavito D, Fabris M, D’Arrigo A, Bernardini D, Dam M, Leon A. A saturated N-acylethanolamine other than N-palmitoyl ethanolamine with anti-inflammatory properties: a neglected story. Journal of neuroendocrinology. 2008;20(Suppl 1):26–34. doi: 10.1111/j.1365-2826.2008.01689.x. [DOI] [PubMed] [Google Scholar]
- 36.Medzhitov R. Origin and physiological roles of inflammation. Nature. 2008;454:428–435. doi: 10.1038/nature07201. [DOI] [PubMed] [Google Scholar]
- 37.Tellez LA, Medina S, Han W, Ferreira JG, Licona-Limon P, Ren X, Lam TT, Schwartz GJ, de Araujo IE. A gut lipid messenger links excess dietary fat to dopamine deficiency. Science. 2013;341:800–802. doi: 10.1126/science.1239275. [DOI] [PubMed] [Google Scholar]
- 38.Janssen S, Depoortere I. Nutrient sensing in the gut: new roads to therapeutics? Trends in endocrinology and metabolism: TEM. 2013;24:92–100. doi: 10.1016/j.tem.2012.11.006. [DOI] [PubMed] [Google Scholar]
- 39.Ibrahimi A, Abumrad NA. Role of CD36 in membrane transport of long-chain fatty acids. Current opinion in clinical nutrition and metabolic care. 2002;5:139–145. doi: 10.1097/00075197-200203000-00004. [DOI] [PubMed] [Google Scholar]
- 40.Hansen HS, Rosenkilde MM, Holst JJ, Schwartz TW. GPR119 as a fat sensor. Trends in pharmacological sciences. 2012;33:374–381. doi: 10.1016/j.tips.2012.03.014. [DOI] [PubMed] [Google Scholar]
- 41.Tran TT, Poirier H, Clement L, Nassir F, Pelsers MM, Petit V, Degrace P, Monnot MC, Glatz JF, Abumrad NA, Besnard P, Niot I. Luminal lipid regulates CD36 levels and downstream signaling to stimulate chylomicron synthesis. The Journal of biological chemistry. 2011;286:25201–25210. doi: 10.1074/jbc.M111.233551. [DOI] [PMC free article] [PubMed] [Google Scholar]
- 42.Tsuboi K, Ikematsu N, Uyama T, Deutsch DG, Tokumura A, Ueda N. Biosynthetic pathways of bioactive N-acylethanolamines in brain. CNS & neurological disorders drug targets. 2013;12:7–16. doi: 10.2174/1871527311312010005. [DOI] [PubMed] [Google Scholar]
- 43.Wellner N, Diep TA, Janfelt C, Hansen HS. N-acylation of phosphatidylethanolamine and its biological functions in mammals. Biochimica et biophysica acta. 2013;1831:652–662. doi: 10.1016/j.bbalip.2012.08.019. [DOI] [PubMed] [Google Scholar]
- 44.Tsuboi K, Okamoto Y, Rahman IA, Uyama T, Inoue T, Tokumura A, Ueda N. Glycerophosphodiesterase GDE4 as a novel lysophospholipase D: a possible involvement in bioactive N-acylethanolamine biosynthesis. Biochimica et biophysica acta. 2015;1851:537–548. doi: 10.1016/j.bbalip.2015.01.002. [DOI] [PubMed] [Google Scholar]
- 45.Cravatt BF, Giang DK, Mayfield SP, Boger DL, Lerner RA, Gilula NB. Molecular characterization of an enzyme that degrades neuromodulatory fatty-acid amides. Nature. 1996;384:83–87. doi: 10.1038/384083a0. [DOI] [PubMed] [Google Scholar]
- 46.Tsuboi K, Sun YX, Okamoto Y, Araki N, Tonai T, Ueda N. Molecular characterization of N-acylethanolamine-hydrolyzing acid amidase, a novel member of the choloylglycine hydrolase family with structural and functional similarity to acid ceramidase. The Journal of biological chemistry. 2005;280:11082–11092. doi: 10.1074/jbc.M413473200. [DOI] [PubMed] [Google Scholar]
Associated Data
This section collects any data citations, data availability statements, or supplementary materials included in this article.