

Abstract
The rates at which biological interactions occur can provide important information concerning the mechanism and behavior of these processes in living systems. This review discusses several analytical methods that can be used to examine the kinetics of biological interactions. These techniques include common or traditional methods such as stopped-flow analysis and surface plasmon resonance spectroscopy, as well as alternative methods based on affinity chromatography and capillary electrophoresis. The general principles and theory behind these approaches are examined, and it is shown how each technique can be utilized to provide information on the kinetics of biological interactions. Examples of applications are also given for each method. In addition, a discussion is provided on the relative advantages or potential limitations of each technique regarding its use in kinetic studies.
Keywords: Biological interactions, Kinetics, Stopped-flow analysis, Surface plasmon resonance spectroscopy, Affinity chromatography, Capillary electrophoresis
1. Introduction
Biological interactions are important in determining many of the processes that occur in living systems. For example, enzymes catalyze reactions by binding and modifying their substrates, transport proteins bind to and carry lipids, hormones or nutrients within the circulatory system, and antibodies are utilized by the immune system to bind and remove foreign substances from the body. Many of these events make use of non-covalent binding and may involve proteins, peptides, lipids, nucleic acids, lipids, metal ions, hormones or drugs [1–8]. Because of the widespread occurrence and importance of these interactions, various techniques have been developed to investigate and characterize such reactions [4–19]. The overall strength, or thermodynamics, of these processes is one item of interest in these studies; however, the rate of these interactions, or their kinetics, is also important to consider [1–8]. Obtaining such information can provide a better understanding of the function of individual interactions in a biological system, the mechanisms through which these interactions occur, and the effects that a change in conditions may have on these processes [1–8].
This review examines several analytical techniques that have been used in kinetic studies of biological interactions. The methods that will be discussed include common or traditional techniques such as stopped-flow analysis and surface plasmon resonance (SPR) spectroscopy, as well as separation-based approaches that make use of affinity chromatography or capillary electrophoresis (CE) [1,3,7,20]. The general principles and theory behind each of these techniques will be described, with particular attention being given to the use of each method for investigating the rates of biological interactions. An overview of the conditions and models that are used in each technique for kinetic studies will be provided, and examples of applications will be given to illustrate each approach. Finally, the advantages and possible limitations of each method will be discussed with regards to use of the technique in studying the rate of a biological interaction.
2. Stopped-Flow Analysis
2.1. General Principles
Many methods for kinetic studies are based on the measurement of a change in the concentration of a reagent or product as a function of time after the reagents have been mixed [21–27]. This approach requires that the process of interest be slow enough to give a reaction time that is longer than the time needed for reagent mixing and instrument activation. However, many biological interactions can occur within seconds (s) or milliseconds (ms), a fact which has limited the application of many traditional kinetic methods to such systems [21].
Stopped-flow analysis is one technique that can be employed to study the kinetics of biological interactions. The mixing time for samples and reagents in stopped-flow analysis can be as short as 1–2 ms, making this approach useful for examining interactions that occur even on the millisecond-to-second timescale. Examples of biological interactions that have been investigated with this method in kinetic studies are protein folding [28–30], enzyme inhibition [31,32], and the binding of proteins or DNA to hormones, drugs, or small molecules [33–40]. The reactants that can be used in stopped-flow analysis include proteins, DNA, drugs, hormones, and metal ions, among others [28–80].
In this technique, a small volume of each desired reagent is rapidly applied by a device such as a syringe and passed through a mixer to initiate the reaction (see Fig. 1). This mixture is then moved into an observation chamber, and the flow is stopped. Data acquisition of a signal that is produced by one of the components in the observation chamber is begun at this time. The time interval between the mixing of the reagents and the beginning of signal observation is usually only 1–2 ms and is referred to as the “dead time” [21,24].
Figure 1.

General design of an instrument for carrying out stopped-flow analysis, as illustrated here for a device that can be used with either fluorescence or absorbance detection. This figure is based on information that was obtained from Refs. [22–24].
Detection in stopped-flow analysis can be accomplished by using various methods that are able to selectively monitor a reagent or product in the reaction. Absorbance and fluorescence are two common detection methods that are employed for this type of experiment [21,25,28]. For instance, reactants or products with a specific chromophore or fluorophore (e.g., NADH, pyridoxal phosphate, or tryptophan residues on a protein) can be used to follow the rate of a biological reaction [21]. Alternatively, a tag such as fluorescein can be added to one of the reagents to monitor the progress of the reaction [21]. Circular dichroism has also been used in stopped-flow analysis for studies involving protein folding and unfolding [28–30]. In addition, fluorescence lifetime measurements [47,48], nuclear magnetic resonance spectroscopy [41,42,49,50], and small-angle X-ray scattering [51] have been coupled with stopped-flow analysis to study the kinetics of protein folding or drug metabolite degradation.
Once the response has been obtained, the data from a stopped-flow experiment are fit to one or more reaction models to obtain rate constants for the desired interaction. These models can range from reactions that involve the conversion of a single type of molecule from one form to another, to a bimolecular interaction or a multistep reaction [21]. Each of these models and applications will be discussed in more detail in the following sections.
2.2. Applications Involving Single-molecule Reactions
The simplest type of reversible reaction that can be examined by stopped-flow analysis is the change of a single molecule from one form or conformation into another. This type of unimolecular reaction is represented by the model in Eq. (1). In this model, the reversible conversion of molecule P (e.g., a protein) into form P* is described by the first-order forward and reverse rate constants k1 and k−1. The ratio of these rate constants also provides the equilibrium constant for this process (K1), where K1 = k1/k−1 [21].
| (1) |
An appropriate detector is used during this experiment to monitor the concentration of the probed molecule in either its initial or final form (i.e., P or P*). The observed signal (S) as a function of the reaction time (t) is then obtained and can be fit to the following equation [21,24].
| (2) |
In Eq. (2), S(t) is the signal measured at time t, S0 is the signal observed at the beginning of the experiment (t = 0), Seq is the signal obtained at a sufficiently long time that equilibrium has been reached, and (Seq − S0) is the total change in signal during the reaction. The term kobs is the observed rate constant for the reaction. This latter parameter is related inversely to τ, the “relaxation time” for the system, where kobs = 1/τ.
In a unimolecular reaction, the value of kobs in Eq. (2) will be equal to the sum of k−1 and k1, regardless of the concentrations of P and P* [21]. The values of k−1 and k1 can be obtained from kobs if the value of K1 is also known, as can be accomplished by using the expressions in Eqs. (3) and (4) [21].
| (3) |
| (4) |
A unimolecular model has been found to describe some conformational changes in proteins. For example, this model has been used to study the conformational changes that occur in apotransferrrin following the binding of this protein with Fe2+ or Zn2+, as illustrated in Fig. 2 [52].
Figure 2.

Fluorescence intensity measured over time for apotransferrin after mixing a solution of this protein with an excess of Zn2+. The observed processes include (a) a rapid interaction between apotransferrin and Zn2+ (i.e., the “1st rapid kinetic process”), as described by Eq. (5); and (b–c) changes in the conformation of apotransferrin (i.e., the “2nd” and “3rd” kinetic processes), as described by Eq. (1). The graph in (d) shows a plot of kobs (or τ−1) vs. the concentration of Zn2+ during studies of the first kinetic process, which follows the linear relationship that is predicted by Eq. (6). Adapted with permission from Ref. [52].
2.3. Applications Involving Bimolecular Reactions
Another type of reaction that can be examined by stopped-flow analysis is the reversible interaction between two molecules to form a new species. For instance, Eq. (5) describes a bimolecular reaction between a molecule or protein (P) and a second molecule or ligand (L) that forms the reversible complex or product PL.
| (5) |
The terms k1 and k−1 in this reaction are the second-order association rate constant and first-order dissociation rate constant for the interaction of P with L, respectively. The ratio of these rate constants gives the association equilibrium constant for this reaction (K1, where K1 = k1/k−1) [21].
A bimolecular reaction is often examined in stopped-flow analysis by using conditions that convert this process into a pseudo first-order reaction. This can be achieved by using at least a ten-fold higher concentration of one reagent (X) versus the other reagent. Under these conditions, the concentration of the excess reagent, [Xtot], changes negligibly during the reaction and is approximately constant. The result is that the product of this concentration and the second-order rate constant k1 can now be used to describe a pseudo first-order rate constant that is equal to k1 [Xtot]. The observed rate constant, kobs, that is measured for this reaction by stopped-flow analysis is described by Eq. (6) [21,53].
| (6) |
The value of the observed rate constant, kobs, is obtained by fitting the stopped-flow analysis data to the expression that was given earlier in Eq. (2). However, experiments are now usually carried out at various concentrations of X, which is still in excess of the other reagent, and a plot is made of kobs versus [Xtot]. If the reaction between P and L is described by Eqs. (5–6), a linear relationship should be obtained for this plot, with a slope that is equal to k1 and a y-intercept that is equal to k−1 [21,53].
Fig. 3 shows an example of this approach, in which stopped-flow analysis and fluorescence detection were used to investigate the kinetics of a DNA-protein interaction. This particular application examined the binding of high-mobility group (HMG) domain proteins with cisplatin-modified DNA [54]. A platinum-containing, fluorescent DNA probe was mixed with an excess of HMG1 or a domain from this protein, which were prepared at various concentrations. The data gave a good fit to Eq. (2) and the resulting values of kobs were plotted against the total concentrations of HMG1 or its domains in various mixtures. This latter plot provided the association and dissociation rate constants for the DNA-protein interaction.
Figure 3.
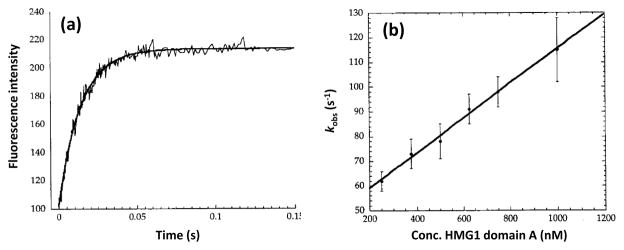
Stopped-flow kinetic studies of the reaction between high-mobility group (HMG) 1 domain A and platinated 16-mer DNA probes containing a fluorescein-dU label. The plot in (a) shows the change in fluorescence over time after the mixing of HMG1 domain A with the DNA probes. The plot in (b) shows the relationship that was seen between the observed rate constant (kobs) and the concentration of HMG1 domain A. Eq. (6) was used with this second plot to determine association and dissociation rate constants for this protein-DNA reaction. Adapted with permission from Ref. [54].
This type of method has also been used in drug-protein binding studies. Interactions of the drug warfarin with the protein human serum albumin (HSA) have been investigated by using stopped-flow analysis under pseudo first-order conditions (i.e., by mixing HSA with solutions containing a known excess of warfarin) [53]. The enhancement in the fluorescence of warfarin when binding to HSA was used to examine the kinetics of this interaction. Kinetic data for the interactions between isonicotinic hydrazide and its analogues with Mycobacterium tuberculosis catalase-peroxidase (KatG) have also been obtained and analyzed according to this technique, by detecting the change in the absorbance of KatG as it binds to hydrazide [55]. In addition, a bimolecular reaction model has been used to investigate enzyme interactions with peptides [56] or coenzymes [57,58], protein-protein interactions [59], the binding of ATP with proteins [60], and lipid-protein interactions [61].
Even though, in theory, both the association and dissociation rate constants for a bimolecular reaction can be estimated by using Eq. (6), this equation does have some limitations when it is used to study reactions with relatively high equilibrium constants. For instance, the small dissociation rate constants that can be present for this type of reaction may make it difficult or impractical to determine k−1 from the intercept of Eq. (6). This problem has been noted in the use of stopped-flow analysis to examine the interactions of some drugs or metal ions with proteins and in some enzyme-peptide or protein-protein interactions [52,53,56,59].
2.4. Applications Involving Competition Studies
Competition experiments can also be utilized in stopped-flow analysis to examine the rates of biological interactions. For instance, this might involve a bimolecular reaction like the one between P and L in Eq. (5), along with the use of a competing agent (C) that is known to bind to the same site on P as L. In this situation, the addition of C to a pre-incubated mixture of P and L will cause C to displace some of L from its complex with P. The reactions that take place in this system are shown in Eq. (7).
| (7) |
In these reactions, k1 and k−1 are again the second-order association and first-order dissociation rate constants for the reversible interaction of P with L, while k2 and k−2 are the corresponding association and dissociation rate constants for the reversible interaction of P with C at the same binding region that can be occupied by L [21].
To study the dissociation rate of L from P in this type of system, the concentration of L in the premixed solution of P and L is chosen to ensure that there is a reasonable, initial saturation of P. However, the concentration of C that is added needs to be present in a large excess compared to the concentrations of both P and L, thus avoiding re-association of L after it has been dissociated from its complex with P. A signal is then measured that reflects a change in one of the products or reactants, and this signal is analyzed according to an expression like Eq. (2). Ideally, experimental conditions should be selected so that if C and L do compete for sites on P and the concentration of C is sufficiently large, the observed rate constant kobs will be equal to k−1 and independent of the concentration of C [21,53].
Stopped-flow analysis and the model in Eq. (7) can be further used to determine the dissociation rate constant for the interaction of C with P. This can be achieved by using a large excess of L to displace C from P in a solution that initially contains a pre-incubated mixture of P and C. Another binding agent, P′, which is able to bind to C, can also be used to displace C from its complex with P by forming the alterative complex, P′C [21].
Competition experiments in stopped-flow analysis has been used to examine the rates of interactions such as drug-protein, DNA-protein, protein-protein, and enzyme-peptide binding [53, 54, 56,59,62–65]. For instance, phenylbutazone has been utilized as a competing agent in kinetic studies of warfarin’s interactions with HSA. The observed rate constant was then used to estimate the dissociation rate constant for warfarin from HSA [53]. This general approach was also used to measure the dissociation rate constant for DNA from HMG1 domain A, in which a DNA sequence without a fluorescent tag was used as the competing agent [54]. A similar technique was employed to follow the dissociation of pyrene-labelled actin and ADP from their complexes with myosin by using unlabeled actin or ATP as a competing agent [62–65].
Competition experiments can be modified to measure the association rate constants for the interactions of L and C with P. This can be carried out by premixing solutions of C and L, followed by the addition of P. If the dissociation rate constants for this system (k−1 and k−2) are small compared to the pseudo first-order association rate constants, the observed rate constant will now be described by Eq. (8).
| (8) |
In this type of experiment, the concentration of C ([Ctot]) is varied and mixed with L that has been prepared at a fixed concentration, [Ltot]. Both the concentrations of C and L are selected so that they are much higher than the concentration of P that will be present. After P has been added to the premixed solution of C and L, the change in signal for the system is measured as a series of kobs values are obtained for various mixtures of C and L. A plot of kobs versus [Ctot] is then prepared according to Eq. (8), resulting in a linear relationship with a slope that provides k2 and a y-intercept that is equal to k1 [Ltot].
Another use for Eq. (8) has been in examining the type of competition that solutes may have at their binding sites on a protein. In one report, podophyllotoxin (POD) was used as a competing agent to study binding by tubulin to two analogs of colchicine (2,3,4-trimethoxy-4′-carbomethoxy-1,1′-biphenyl, or TCB, and 2,3,4-trimethoxy-4′-acetyl-1,1′-biphenyl, or TKB); this reaction was followed through stopped-flow analysis by monitoring the increase in fluorescence that occurred upon binding [66]. A plot of kobs versus the concentration of POD was then made according to Eq. (8). The linear relationships in this plot indicated that POD was competing with both TCB and TKB for their binding sites on tubulin and provided the association rate constant for POD with this protein. If this system had instead given a non-linear relationship, this would have indicated that a different binding site was involved in the interactions of C and L with P or that a process other than simple direct competition was present in the system [66,67].
2.5. Applications Involving Multistep Reactions
Even though a reversible bimolecular interaction like the one in Eq. (5) can be utilized to describe many types of biological interactions, there are situations in which additional steps are needed to provide a suitable description of the system. For instance, the fast binding of P with L to form PL may be followed by a slower conformational change to create an alternative form of this product, PL*, as is shown in Eq. (9).
| (9) |
The first step of this process is described by the second-order association and first-order dissociation rate constants k1 and k−1. The second step, involving a unimolecular change, is described by the first-order forward and reverse rate constants k2 and k−2, respectively [21].
The experimental conditions that can be used in stopped-flow analysis to examine this type of system are similar to those described for a simple bimolecular reaction in Section 2.3. One of the reagents (e.g., L) is prepared at a series of concentrations that are much higher than the concentration of the other reagent (e.g., P). To detect a two-step reaction like the one in Eq. (9), a comparison can be made when the data are fit to both the single-exponential expression in Eq. (2) and the double-exponential expression given in Eq. (10), where these two expressions represent one- or two-phase association models [66–72].
| (10) |
In Eq. (10), the terms Ff and Fs are the fractions of the change in response due to the fast and slow reaction steps, where the sum of these fractions is equal to one. In this type of multistep system, the observed rate constant for the fast bimolecular reaction, kobs1, should increase in a linear manner with the value of [Lot] when PL is forming, as is described by Eq. (6). The term kobs2, which is the observed rate constant for the slower unimolecular reaction, should have a non-linear relationship with [Lot], as indicated by Eq. (11) for a case in which the concentration of L is much larger than that of P [21,68–70,73–75].
| (11) |
The term K−1 in Eq. (11) is the dissociation equilibrium constant for the fast bimolecular reaction, where K−1 = k−1/k1.
This method has been used to examine the interactions of genome-linked protein with wheat germ translation initiation factors [68]. It was further employed in a study examining the reactions between J-binding protein 1 and its J-DNA-binding domain with DNA oligomers that contained base J or glucosylated 5-hydroxymethylcytosine [69]. The rate constants for the binding of phosphatidylserine-containing vesicles to lactadherin have also been determined by using Eqs. (10–11) [70]. In addition, other biological interactions (e.g., enzyme catalysis) have been investigated by using stopped-flow analysis and a multistep model [73–75].
If the dissociation equilibrium constant K−1 is small compared to [Ltot], the value of kobs2 in Eq. (11) will become independent of [Ltot] and approximately equal to the sum of k2 and k−2. The kinetic parameters for each step in the reaction can then be determined by employing Eq. (6) or Eqs. (3–4) to analyze data acquired over appropriate time periods during the experiment. This type of analysis has been used in kinetic studies of the binding of Fe2+ and Zn2+ to human serum transferrin, as illustrated earlier in Fig. 2 [52]. This model has also been used to investigate the binding and subsequent change in conformation that occurs for the complex between melittin and Ca2+-saturated calmodulin [76], as well as the interaction of a transcriptional activator-DNA complex with a coactivator [77], and the interaction of N-phenyl-1-naphthylamine with pheromone-binding proteins [78].
If the value of k−2 is small, Eq. (11) can be simplified to one of the forms shown in Eqs. (12–13). For instance, Eq. (13) indicates that such a system will provide a linear relationship between 1/kobs2 and 1/[Ltot], which can be used to find the values of k2 and K−1.
| (12) |
| (13) |
This type of analysis has been utilized to study the interaction kinetics when an excess of rifampicin is combined with RNA polymerase [72]. These equations have also been used to study protein-protein interactions [79].
2.6. Advantages and Potential Limitations
As has been shown in this section, stopped-flow analysis can be applied in studying the kinetics of various biological interactions, including both simple and relatively complex systems. In addition, this technique can be used to examine either slow or relatively fast events. Rate constants that have been determined by stopped-flow analysis have ranged from 10−6 to 106 s−1 for first-order reactions and from 1 to 109 M−1s−1 for second-order reactions [40,62,71,76]. It is necessary, however, for the observed reaction to have a half-life that is longer than the mixing time and dead time of the stopped-flow instrument, which limits the use of this method in the study of some very fast reactions [80].
An important advantage of stopped-flow analysis is it can be used directly with solution-phase reactions, provided some means is available to selectively monitor a change in the concentration of a reactant or product in this reaction (e.g., through fluorescence or absorbance detection). It is also necessary to have sufficient volumes of the reagents for use in the solution delivery component of the stopped-flow instrument. A sufficient concentration of the reagents and/or products is also needed for a change in these components to be measured over time. This latter requirement, and the detectable range of the reagent or product, will depend on the detection method that is employed. However, a relatively low detection limit (e.g., low nM levels) can be obtained when a method such as fluorescence is used in stopped-flow analysis [21,24,59,69].
3. Surface Plasmon Resonance
3.1. General Principles
Surface plasmon resonance (SPR) spectroscopy is another method that has been widely used for the analysis of biological interactions [81]. This method has been utilized to study systems such as protein-ligand, protein-protein, and protein-DNA interactions [3–5,82,83]. Fig. 4(a) shows a typical SPR instrument that is used for biological interaction studies. This particular device makes use of prism coupling, but other possible configurations include those based on optical waveguide coupling and grating coupling [82,83].
Figure 4.

(a) Typical design for a surface plasmon resonance (SPR) biosensor based on a prism configuration. The plot in (b) shows a typical experimental cycle and general response (or sensorgram) that can be obtained with this type of instrument in a kinetic analysis for an applied target that is interacting with an immobilized binding agent to form a reversible complex. This figure is based on information that was obtained from Ref. [4].
In an SPR system, a binding agent such as a protein is immobilized onto the sensor surface, which typically consists of a thin film of a metal (e.g., gold or silver) that is placed onto a glass surface [82,83]. This sensor surface is then placed within a flow cell. A target, or ligand, that is to be tested for its binding to the immobilized agent is then applied to the flow cell and in the presence of an appropriate buffer. Surface plasmons are generated when an incident beam of light is directed towards the metal surface at a critical angle. This critical angle depends on the refractive index of the medium near the surface and changes when targets bind to the immobilized binding agents at this surface [84]. The change in the refractive index at the surface, as a result of the interaction between the applied target and immobilized agent, is then measured and provides an index of the extent of binding that has occurred [81–85].
Fig. 4(b) shows a general plot (or sensorgram) that is obtained with this type of instrument. In this plot, an increase in response is generated as the applied target binds to the immobilized agent in the flow cell. A plateau in this response is obtained as equilibrium is reached between the applied target and the immobilized binding agent. Dissociation of the target from the immobilized binding agent can also be monitored as the bound target is later washed away from the surface. After the bound target has been removed, the surface and binding agent can often be regenerated and are placed back in contact with the initial buffer prior to the application of more target [4,83,85].
3.2. Data Analysis Methods
For a bimolecular reaction between P and L, as described earlier in Eq. (5), the change in the concentration of product PL with time can be described by using Eq. (14) [83,86–87].
| (14) |
In this equation, k1 is the second-order association rate constant for the interaction of P with L, and k−1 is the first-order dissociation rate constant for this interaction, as defined earlier in Section 2.2. This binding event, and the concentration of PL, is monitored by using the change in the refractive index at the surface of the sensor.
By varying [L], the SPR response for the system in Eq. (14) can be fit to the following integrated rate expression [83,86–87].
| (15) |
In Eq. (15), Rt is the response measured at time t, and Rmax is the maximum response that is obtained upon the saturation of P with L. If the value of [L] is varied, a fit of Eq. (15) to these curves will provide a series of observed rate constants (kobs), in which kobs is equal to the following set of terms [83,86–87].
| (16) |
A plot of kobs versus [L] can then be made according to Eq. (16), and the values of k1 and k−1 can be determined from the slope and the y-intercept of the best-fit line.
To accurately determine k−1 and k1 by this method, an appropriate range for the concentrations of L should be used. One study examined how kobs varied with the concentration of L during the binding of a 50 kDa target ligand to immobilized chymotrypsin [86]. Ligand depletion occurred at low ligand concentrations and resulted in curvature in the kinetic plots. This deviation became more pronounced at a higher value for Rmax and lead to an underestimation of k1 and an overestimation of k−1. It was determined that these errors could be minimized by using ligand concentrations that were 1–100 times that of the dissociation equilibrium constant for the system (K−1, where K−1 = k−1/k1) [86].
Data generated during the dissociation step in SPR can be used to provide additional kinetic information. This can be accomplished by using a first-order expression to describe the release of L from P, as shown in Eq. (17) [86,87].
| (17) |
Most of the terms in this relationship are the same as in Eq. (15), with the additional term R0 representing the response at the beginning of the dissociation step. Eq. (17) is applicable only in the case of the simple, monophasic dissociation of PL, and where the re-association of L to the immobilized binding agent P is negligible after L has dissociated from the surface of the SPR sensor [87].
3.3. Applications in Kinetic Studies
SPR has been widely utilized in dissociation and association rate measurements for various biological systems [3–5,88]. One recent report examined the choice of suitable conditions for the kinetic analysis of G-protein signaling, based on the use of immobilized native rhodopsin (Rho, a G-protein coupled receptor) and transducin [89]. A number of antibody-antigen interactions have been examined by using SPR [90–92], and this technique has been applied in studying the DNA-protein interactions [93,94]. For instance, SPR has been used to measure the interaction rates of DNA-based aptamers with human immunoglobulin E [93].
SPR has been further employed in investigating the interaction kinetics between biomacromolecules and small targets [3,85,88,95,96]. For instance, SPR has been used to examine the interactions of human carbonic anhydrase I with various sulfonamide inhibitors [93]. One report used SPR to study the kinetics of small target interactions with modified binding sites on an inverse agonist stabilized receptor of the adenosine A2A receptor [96]. In another paper, a group of investigators used a commercial SPR instrument to separately characterize the rate constants and binding constants for 10 sulfonamide inhibitors with the enzyme carbonic anhydrase II [97].
SPR has been used in some situations with a small immobilized binding agent. This format was employed to measure rate constants for the interactions between small targets and FK506 binding protein 12. The results suggested that the use of immobilized targets for the SPR experiments eliminated subtle constraints to the protein’s rotational and diffusional freedom that would have been present if the protein were instead immobilized [98]. Another report that used small immobilized targets involved kinetic studies on the binding of streptavidin to mixed biotin-containing alkylthiolate monolayers [99].
Several variations of SPR systems have been reported. A method for SPR imaging (or SPR microscopy) has been developed for simultaneously monitoring thousands of biomolecular interactions [88,104]. Fig. 5 shows an example of an image that was generated for a 1020-spot protein microarray. In this case, twenty different proteins were spotted across the surface of the array and utilized to generate a series of kinetic curves. The results suggested that SPR imaging could be used to carry out kinetic measurements on more than 1000 spots with a one second time resolution, making this approach of interest in applications such as proteomic analysis and drug discovery [88,99,101]. SPR has also been combined with mass spectrometry, which has been used to provide structural information on interacting proteins [81,101–103].
Figure 5.

(a) A 1020-spot protein microarray as imaged by SPR microscopy, and (b) sensorgrams that were obtained at some of the spots in this protein microarray following the application of streptavidin, anti-bovine serum albumin (BSA) antibodies or human immunoglobulin G (IgG). Adapted with permission from Ref. [88].
3.4. Advantages and Potential Limitations
There are several advantages in the use of SPR for kinetic studies. One advantage is that this method can be carried out using commercial systems that provide flexible platforms for examining both the equilibrium constants and rate constants for biological interactions [104]. These systems require only a small amount of the binding agent and applied target. The fact that the binding agent is immobilized can also help minimize batch-to-batch variations when the same sensor is used for multiple studies.
The use of SPR as a detection mode is appealing in that it provides a “label free” means for following the course of a biological interaction [4,5,85]. However, this does require a specific type of surface for the analysis (i.e., one containing a thin metal film such as gold), and it is necessary to immobilize one of the agents that is taking part in the interaction. There are several immobilization methods available for this purpose [3,104]. Common methods for protein immobilization include the coupling of groups such as amines or thiols on a protein to a coating of dextran on the sensor [81]. It is also possible to capture a biotinylated agent on a surface that contains immobilized streptavidin, or to capture a histidine-labeled agent on a surface that contains immobilized nitrilotriacetic acid and its complex with nickel ions [3,81,103]. For small molecules, the number and types of functional groups that are present may limit the options for immobilization. If the coupling conditions are not properly selected, whether it is for a large or small molecule, this can lead to some changes in the binding properties of the immobilized agent [3,5,89]. Validation of SPR with reference methods is ideally required when this system is used to study what is normally a solution-phase interaction. However, if the immobilization method and conditions are properly selected, the results obtained by SPR can give good agreement with those seen in solution and by other techniques [89,97].
SPR has been used to investigate biological interactions with a wide range of rate constants. This has included second-order association rate constants ranging from 102 to 108 M−1 s−1 and first-order dissociation rate constants that have spanned from 10−6 to 1 s−1) [4,81]. The level of accuracy and precision of SPR does depend on the rates and affinity of the system being examined, since this will determine the time period over which useful data can be acquired. Systems that have moderate-to-weak interactions (i.e., K1 values of 104 to 105 M−1 or less) and fast association or dissociation rates are the most difficult to measure by this approach [97,106]. In addition, mass transfer effects that occur during the transport of the target in solution should be considered when examining the kinetics of biological interactions by SPR [81,97,104,106].
4. Affinity Chromatography
4.1. General Principles
Affinity chromatography is a liquid chromatographic technique in which a biologically-related agent known as the “affinity ligand” is used as the stationary phase [107–111]. The retention and separation of a target analyte from other sample components by this method is based on the specific and reversible interactions that occur in many biological interactions [6,8,9,107–111]. High-performance affinity chromatography (HPAC) is a type of affinity chromatography that uses the supports and instrumentation of high-performance liquid chromatography to provide both rapid and efficient separations based on biological interactions and affinity ligands [112]. The development of HPAC has also lead to the creation of various new or improved techniques that can use affinity chromatography to study the kinetics and thermodynamics of biological interactions [6,112,113].
Fig. 6 shows some general ways in which affinity chromatography can be employed for studying biological interactions. Affinity chromatography and HPAC are most often used to examine the binding and/or dissociation of an applied target with an immobilized binding agent, as represented by the scheme in Fig. 6(a). However, it is also possible to use affinity methods to examine solution-phase interactions, as shown in Fig. 6(b). These chromatographic-based experiments are similar to SPR in that they can provide information on both binding affinities and association or dissociation rates under typical sample application conditions. It is further possible to use affinity chromatography to examine the binding strength and association/dissociation kinetics under other conditions, such as those that might be used for target elution or for the release of this target from the immobilized binding agent [7,106].
Figure 6.

General models for the use of affinity chromatography for kinetic analysis of interactions between (a) an applied target and an immobilized binding agent, or (b) between the target and a soluble binding that is present in the applied sample. The terms k1 and k−1 represent the association rate constant and dissociation rate constant, respectively, for the target with the given binding agent.
4.2. Band Broadening Methods
The use of band broadening measurements was the first method developed in affinity chromatography for kinetic studies of biological interactions [7,106]. Two variations on this approach are the plate height method and peak profiling [106]. In the plate height method, the total plate height for a small amount of an applied target is measured at several flow rates on both a column that contains an immobilized binding agent and on a control column that contains no binding agent. The resulting plate height and flow rate data are then used to determine the plate height contribution due to the process of stationary phase mass transfer (Hs).
This latter process is of interest because it is directly related to the kinetics for the binding of the applied target with the immobilized binding agent. This process is described by the reaction given earlier in Eq. (5) and the plate height equation that is shown in Eq. (18) [7,106].
| (18) |
In Eq. (18), u is the linear velocity of the mobile phase in the column, k is the retention factor of the injected target, and k−1 is the dissociation rate constant for the target from the immobilized binding agent. When a plot of Hs versus (u k)/(1 + k)2 is prepared, the result is a linear relationship that can provide the value of k−1 from the slope.
The plate height method has been used in HPAC to examine the interaction kinetics for drugs and solutes such as R/S-warfarin and D/L-tryptophan with HSA [114,115]. Similar experiments were performed to look at the effects of temperature on the rates of these processes [114,115], as well as the effects of pH, ionic strength and solvent polarity on the interaction rates of D/L-tryptophan with HSA [115]. This method has also been employed in evaluating the use of small affinity columns and monoliths for screening the interactions of HSA with drugs or solutes such as carbamazepine, L-tryptophan and R-warfarin [116,117].
The plate height method has generally been used to study systems that have relatively fast interaction rates compared to the time of the chromatographic analysis. For instance, the dissociation rate constants that have been determined by this method have ranged from roughly 10−2 to 101 s−1 [6,114,117]. This method also has been successfully used with systems that have weak-to-moderate binding (i.e., K1 values of 105 M−1 or less) [6,7,106,114–117]. The injection of only a small amount of the target is needed and desirable in this method to ensure that linear elution conditions are present. Also, columns and support materials should be selected for this technique that will minimize or provide reproducible values for other plate height contributions, such as those due to mobile phase mass transfer, eddy diffusion, longitudinal diffusion, and stagnant mobile phase mass transfer [6,7,106].
Peak profiling is a related method that examines the band broadening of a target and a non-retained solute on an affinity column (and possibly on a control column) under linear elution conditions [106,112]. Eq. (19) is often used in peak profiling studies to provide information on the dissociation rate constant k−1 from band broadening data [112,118–120].
| (19) |
In this equation, HR and HM refer to the plate heights for the retained target and a non-retained solute on the affinity column, respectively, although the plate height for the target on a control column is also sometimes used for HM. Eq. (19) can be used with data obtained at a single flow rate to calculate the value of k−1, or data acquired at several flow rates can be used to construct a plot of (HR − HM) versus (u k)/(1 + k)2 and the dissociation rate constant can be obtained from the slope of the best-fit response [112,118–120].
Peak profiling has been used to investigate the dissociation rates of several drugs and small solutes from serum proteins. For example, this method has been used to measure the dissociation rate constants for carbamazepine, imipramine and L-tryptophan with HSA. [112,118]. A typical plot of (HR − HM) vs. (u k)/(1 + k)2 that was obtained in this work is provided in Fig. 7 [118]. In addition, this method has been used to simultaneously determine the dissociation rate constants of HSA with two chiral metabolites of the drug phenytoin: 5-(3-hydroxyphenyl)-5-phenylhydantoin and 5-(4-hydroxyphenyl)-5-phenylhydantoin [121]. The rate constants for the interactions of β-cyclodextrin with acetaminophen and sertraline have also been measured by this method [122].
Figure 7.

Peak profiling plots based on Eq. (19) for describing the dissociation of carbamazepine from immobilized HSA in a high-performance affinity column. Reproduced with permission from Ref. [118].
Peak profiling has similar requirements, advantages and limitations to the plate height method. For instance, peak profiling is again mainly used for systems with relative fast association and dissociation rates and weak-to-moderate strength binding. The dissociation rate constants that have been determined by this method have been in the range of 10−1 to 101 s−1 [112,118,121,122]. One advantage of peak profiling is it can sometimes be conducted at only a single flow rate, or at higher flow rates than the plate height method. However, a fast sampling rate and stable response is required for work at high flow rates to provide an accurate measure of peak variances and consistent plate height values [106].
4.3. Peak Fitting Methods
Peak fitting has also been used for kinetic analysis in affinity chromatography. This approach differs from those described in the last section in that the amount of applied target can now be sufficiently high to create non-linear elution conditions [106]. Peak fitting can be conducted with either narrow injections of the target (i.e., zonal elution) or continuous application of the target (i.e., frontal analysis) [106]. When this method is used with zonal elution, Eq. (20) can be used to fit the resulting elution profiles [123,124].
| (20) |
In this equation, y is the intensity of the measured signal at a given point in time in the peak profile, x is the reduced retention time at which y is measured, T is the switching function, and I1 is a modified Bessel function. The terms a0, a1, a2 and a3 are the best-fit parameters to be obtained by fitting the experimental data to Eq. (20). These fitted results are then used to estimate the rate constants and equilibrium constant for the interaction between the injected target and immobilized binding agent. For instance, the dissociation rate constant and association equilibrium constant (k−1 and K1) for the system are represented by the terms 1/a2tM and a3/C0, respectively, where tM is the column void time and C0 is a term related to the concentration of the injected target [106,125].
This form of peak fitting has been used to examine the interaction kinetics of the drug verapamil with nicotinic acetylcholine receptor [126]. Related peak fitting methods have been utilized to estimate the dissociation rate constant for IgG from immobilized protein A in the presence of a pH 3.0 buffer [127]. A similar approach has been utilized to examine the elution of lysozyme from a Cibacron Blue 3GA column in the presence of buffers that contained various concentrations of sodium chloride [128].
Peak fitting can also be used with frontal analysis to examine the interaction kinetics between an applied target and an immobilized binding agent. As an example, the apparent association rate constant (k1,app) can be measured and used to determine the true association rate constant (k1) by using Eq. (21). This equation makes use of the reaction model in Eq. (5), with an assumption that dissociation of the target for the binding agent is negligible on the timescale of the experiment [106,129].
| (21) |
In this equation, nmt is the global mass transfer coefficient (which is dependent on the packing size and column dimensions), F is the flow rate, VM is the column void volume, and qx is the column loading capacity per unit volume of the mobile phase. A plot of 1/k1,app versus qx that is made according to Eq. (21) should give a linear relationship with an intercept that is equal to k1 [129]. This method makes it possible to correct for the effects of stagnant mobile phase mass transfer on the apparent association rate constant and has been used to estimate the association rate constant of HSA with immobilized anti-HSA antibodies [129].
Another peak fitting approach that makes use of frontal analysis is based on Eq. (22).
| (22) |
The terms VA and VA* in this equation are the breakthrough volumes for the retained target and a non-retained solute, respectively, and σA2 is the variance of the breakthrough curve for the target. When using Eq. (22), a plot of σA2 versus F should give a response that has a slope equal to (dσA2/dF) [106]. This type of experiment can be conducted at several concentrations of the applied target to provide a series of (dσA2/dF) values, which can then be used to find k−1 [106]. This method has been used to measure the dissociation rate constant for p-nitrophenyl-α-D-mannopyranoside from immobilized concanavalin A [130,131].
One advantage of peak fitting methods is they can be carried out with both zonal elution and frontal analysis under non-linear elution conditions and to study systems with weak-to-moderate binding affinities [106]. The association and dissociation rate constants that have been measured by peak fitting have been in the range of 104 to 107 M−1s−1 and 10−1 to 10 s−1, respectively [106,116,123,128,131,132]. However, it is necessary to test and verify any assumptions that are made in this approach, such as whether mobile phase mass transfer is negligible or needs to be considered when examining the rate of a target’s interaction with the immobilized binding agent [106,129–131].
4.4. Split-Peak Method
The split-peak method is another technique for carrying out kinetic studies by affinity chromatography [7,106]. This approach is based on the finite probability that a small fraction of an applied target may elute from the affinity column without interacting with the stationary phase. This effect can be utilized to provide information on the association rate constant k1 for an injected target with an immobilized binding agent by using an expression such as Eq. (23) [133].
| (23) |
In this equation, f is the non-retained fraction of the target, F is the flow rate, mL is the moles of immobilized and active binding sites in the column, and Ve is the excluded volume in the column. The term km1 is the forward mass transfer rate constant for the target as it moves from the flowing mobile phase to the stagnant mobile phase within the support. According to Eq. (23), a plot of −1/ln(f) versus F should give a linear relationship when a small amount of target is applied to the column [7]. If adsorption of the target to the immobilized binding agent is the rate-limiting step in retention, the slope of Eq. (23) will be 1/(k1 mL), which can provide the value of the association rate constant k1 if the value of mL is also known or obtained through some other means [106,133].
The split-peak method was initially used to examine the binding rate of rabbit immunoglobulin G (IgG) to various columns containing immobilized protein A [133,134]. This method was also used to provide rate information for the optimization of an affinity-based analysis for human IgG in clinical samples [135], and to evaluate the association rate constants for IgG on columns containing protein A, protein G, or a mixed-bed of protein A and protein G [136]. The split-peak method has been modified for use under non-linear elution conditions when the rate-limiting step is the association of a target with the immobilized binding agent. This latter approach has been used to examine the association rates of HSA with immobilized anti-HSA antibodies [137–139]. The association rate constants that have been determined by this method have ranged from 104 to 106 M−1 s−1 [131–139].
A significant advantage of the split-peak method in kinetic studies is it only requires the measurement of peak areas. This feature makes it easier to perform in comparison with the previous chromatographic methods, in which peak variances or profiles are required [106]. However, the split-peak method can only be used for systems with relatively high affinities and/or slow dissociation rates, which is needed to allow a good separation to be obtained between the non-retained and retained target fractions [106]. In addition, this technique needs to be carried out under experimental conditions that make it possible to observe the split-peak effect. As shown by Eq. (23), this effect can be enhanced by increasing the application flow rate for the target or decreasing the size of the column, as well as lowering the amount of active binding agent that is present [106].
4.5. Peak Decay Method
The peak decay method is used to determine the dissociation rate constant for the release of a target from an immobilized binding agent [6,7,106]. In this technique, the target is first applied to a column that contains the binding agent. One variation of the peak decay method then has a mobile phase applied that contains a high concentration of a competing agent, which will bind to the immobilized agent and prevent the re-association of any target that dissociates from this binding agent [6,7]. Another variation of this method uses small affinity columns and a large amount of target that is initially applied to the column, which also minimizes the chance that any dissociated target will rebind to the immobilized ligand [7,106]. In both of these approaches, a high flow rate is usually used during the dissociation step to minimize the effects of stagnant mobile phase mass transfer during dissociation and to prevent the released target from coming into further contact with the immobilized binding agent [106].
Work under these conditions results in elution of the target from the affinity column in the form of a decay curve. This elution profile can then be converted into a plot of the logarithm of the response versus time, as is described by Eq. (24) [7,106].
| (24) |
In this equation, mEo is the initial moles of target that was retained by the immobilized binding agent, mEe is the moles of target that elutes from the column at time t after the competing agent has been applied or the dissociation step has begun, and k−1 is the dissociation rate constant for the target from the immobilized binding agent. Based on Eq. (24) the slope that is obtained for a plot of the natural logarithm of the response versus time should provide the dissociation rate constant k−1 [6,140].
The peak decay method was first used to estimate the dissociation rate constant for concanavalin A with the sugar 4-methylumbelliferyl α-D-mannopyranoside by using 4-methylumbelliferyl α-D-galactopyranoside as a competing agent [141]. In more recent work, the peak decay method has been adapted to measure the dissociation rate constants of drugs from serum proteins. This is illustrated in Fig. 8 for racemic warfarin that had been applied to immobilized HSA in a small silica monolith column [142]. Other drugs (e.g., diazepam, imipramine, acetohexamide, tolbutamide, amitriptyline, quinidine, verapamil, amitriptyline, lidocaine, and nortriptyline) and binding agents (e.g., alpha1-acid glycoprotein) have also been studied with this method [142,143]. The peak decay method has further been employed to study the dissociation rates of various targets from immobilized antibodies during the selection of elution conditions for immunoaffinity chromatography [144]. In addition, this method has been used to characterize the elution kinetics of thyroxine from columns containing anti-thyroxine antibodies or aptamers, and the dissociation of IgG-class antibodies from immobilized protein G [145,146].
Figure 8.

Typical results for a peak decay experiment, as obtained from the application of racemic warfarin onto a control monolith column and a monolith column containing immobilized human serum albumin (HSA). The results in (a) give the original elution profiles and the plots in (b) show the natural logarithm of these elution profiles. These results were obtained for a 100 μL injection of 10 μM racemic warfarin. Reproduced with permission from Ref. [143].
The peak decay method has been used with application buffers to examine several systems with weak-to-moderate affinities (i.e., K1 < 106 M−1) [140–144]. It has also been used to study the elution conditions needed for systems with stronger binding (e.g., protein G, antibodies and aptamers) [145,146]. The dissociation rate constants that have been measured by the peak decay method have ranged from 10−2 to 101 s−1 [6,106,140–146]. Data analysis in this method is relatively easy to carry out, because it is based on linear regression of a logarithmic elution profile, and this method is valuable in characterizing elution conditions. However, non-specific interactions of the target within the column must be considered and corrected for by using a control column, especially for targets that may have weak-to-moderate interactions with the immobilized binding agent. This tends to limit the use of this method in these latter cases to the measurement of dissociation rate constants that are less than about 1–2 s−1 [144]. Moreover, the experimental conditions that are required to make dissociation the rate-determining step in elution, and target re-association negligible, may be difficult to obtain for some systems [141–144].
4.6. Ultrafast Affinity Extraction
Ultrafast affinity extraction is utilized to measure the free (or non-bound) fraction of a target in a mixture of this target with a soluble binding agent. This method has previously been used to estimate the equilibrium constants for various drug- or hormone-protein interactions [147,148] and has recently been modified to provide information on both the kinetics and thermodynamics of drug-protein interactions in solution [149]. In this latter type of measurement, a drug (or target) is injected onto a microcolumn that contains an immobilized protein (or binding agent) for the target and in either the presence or absence of an excess of a soluble protein/binding agent. When a low-to-moderate flow rate is used for sample injection, a portion of the protein-bound drug may dissociate from the drug-protein complex as it passes through the column. This process can be described by the following equation
| (25) |
where PL, P, and L represent the drug-protein complex, solution-phase protein, and free drug, respectively. The term k1 is the association rate constant for P with L in solution, and k−1 is the dissociation rate constant for the complex PL.
The dissociation of PL during passage of the sample through the column results in an increase in the apparent free fraction of L. If the extraction of L by the immobilized binding agent is much faster than the association of P and L, it is possible to derive an integrated rate expression based on Eq. (25) without considering the re-association process. This results in the equivalent expressions that are shown in Eqs. (26–27) [149].
| (26) |
| (27) |
In these equations, f represents the apparent free fraction of L in the mixture of P and L, as is determined by comparing the retained peak areas for injections of the P/L mixture or of L alone onto the affinity column. The term t is the column residence time for the sample. The value of f0 represents the free fraction of L in the mixture of P/L at equilibrium (e.g., as can be measured at high flow rates, which avoids dissociation of L from its complex with P in the sample), and ft is the apparent free fraction that is measured when low-to-moderate flow rates are used for sample injection.
Eqs. (26–27) indicate that a linear relationship would be expected during ultrafast affinity extraction when a plot is made of either ln[(1 − f0)/(1 − ft)] or ln[1/(1 − ft)] versus t. The dissociation rate constant k−1 can be obtained from the slope of either plot. An example of such a graph is shown in Fig. 9. This method has been used to examine dissociation by the drugs warfarin, verapamil, tolbutamide, acetohexamide, gliclazide and chlorpromazine from soluble HSA [149].
Figure 9.

Measurement of the dissociation rate constant for verapamil and soluble HSA at pH 7.4 and 37 °C, by using ultrafast affinity extraction and Eq. (27). Adapted with permission from Ref. [149].
Dissociation rate constants in the range of 10−2 to 10 s−1 have been measured by this method for interactions with affinities spanning from 103 to 105 M−1 [149]. Systems with even slower dissociation rates and higher affinities may be amenable to this approach as well. One advantage of ultrafast affinity extraction is it requires only microliter-size samples. It also makes use of small columns and moderate flow rates, which allows measurements to be made within a few minutes of injection. In addition, this technique can directly examine the interaction between a target and a solution-phase binding agent. The fact that this method makes use of peak area or peak height measurements, rather than peak variances or peak shapes, is another attractive feature. However, this method does require a column and experimental conditions that can be used to at least partially separate the free and bound fractions of a target in the injected samples [149].
4.7. Advantages and Potential Limitations
One general advantage of using affinity chromatography or HPAC to examine the kinetics of a biological interaction is the ability to reuse the same immobilized binding agent for many experiments [6–10]. This feature helps to improve the reproducibility of the method and lowers the cost per analysis. The variety of approaches that are available for kinetic measurements in affinity chromatography is another valuable feature of this technique. Altogether, the chromatographic methods that were described in this section have been used to measure association rate constants that have spanned from 103 to 107 M−1 s−1 and dissociation rate constants that have ranged from 10−2 to 101 s−1. Several of these techniques work well with systems that have relatively weak interactions, a feature which makes these methods complementary to SPR for such work [97,106].
Like SPR, these affinity methods are usually “label free” but often use an immobilized binding agent as one of the interacting partners [6–10,19]. One difference from SPR is that various supports and surfaces can now be used for the immobilizing binding agent since detection is carried out after the target or other sample components have eluted from the column [6–10,19]. Many detection methods can be used with these affinity columns (e.g., absorbance, fluorescence, or mass spectrometry), which further aids in allowing this group of methods to be used in examining a variety of biological systems [6–10].
Various immobilization methods are available for coupling binding agents within affinity columns. These methods might again involve the use of amines, thiols, or other groups for the immobilization of proteins or alternative binding agents. It is further possible to use capturing agents such as immobilized streptavidin for biotin-labeled binding agents or protein A for immunoglobulins [81,107,111,113,150]. The correct selection and validation of the immobilization conditions are needed to provide a binding agent in the affinity column that is a good model for the same binding agent in its native environment. However, as was noted for SPR, there are now many studies that have shown that affinity columns can be used successfully in kinetic studies and as models for solution-phase binding agents [7,8,106]. The possible use of affinity chromatography to directly look at solution-phase reactions, as demonstrated with ultrafast affinity extraction, is another important advantage of this approach [149].
5. Capillary Electrophoresis
5.1. General Principles
CE is a second separation technique that has been used to investigate the kinetics of biological interactions. In CE, a narrow-bore capillary is filled with a running buffer or electrolytic solution. A defined volume of sample is then introduced into the capillary, and an electric field is applied across this capillary. The components of the sample are separated based on their differences in migration rates and electrophoretic mobilities. A detector, which is located at the opposite side of the capillary, is used to monitor the migration of these components [151].
When CE is used in kinetic studies, the free forms of P or L in a sample can be separated from their complex PL if there are differences in the electrophoretic mobilities and migration rates of these reactants and product in the capillary. The rate of the interaction for P with L, or for the dissociation of PL, can be determined by monitoring the changes in one or more of these peaks as a function of reaction time [151–160]. Various formats for carrying out such studies are discussed in this section.
5.2. Analysis of Slow Biological Reactions
One way CE can be used for kinetic measurements is to study interactions that have long reaction times (e.g., hours) and small dissociation rate constants (i.e., k−1 values in the range of 10−3 to 10−6 s−1) [151–157]. To investigate this type of reaction, the target and binding agent can be mixed prior to their injection onto the CE system. Samples of this reaction mixture are injected at known times. The non-bound and bound target are then separated based on the differences in their electrophoretic mobilities, with the results being used to determine the amount of complex that has formed between the target and binding agent at various reaction times.
For a reaction that is slow on the timescale of the CE separation and that has slow dissociation, the interaction of target L with binding agent P can be approximately described by the following equation.
| (28) |
In this equation, [PL] is the measured concentration of the complex at time t, [Ltot] is the total concentration of L, and kobs is the observed rate constant for this interaction.
Fig. 10 shows an electropherogram that was obtained in this type of experiment. This particular study examined the interaction of a ruthenium(III)-containing drug with HSA and transferrin, with detection being carried out by CE coupled with inductively coupled plasma-mass spectrometry [152]. A similar method has been used to determine rate constants for the interactions of ruthenium(III)-containing drugs with holo-transferrin [153] and for platinum(II)-containing drugs with HSA [154]. Another report examined the reaction of cisplatin with 2′-deoxyguanosine 5′-monophosphate, as based on the use of CE coupled with electrospray ionization mass spectrometry [158].
Figure 10.
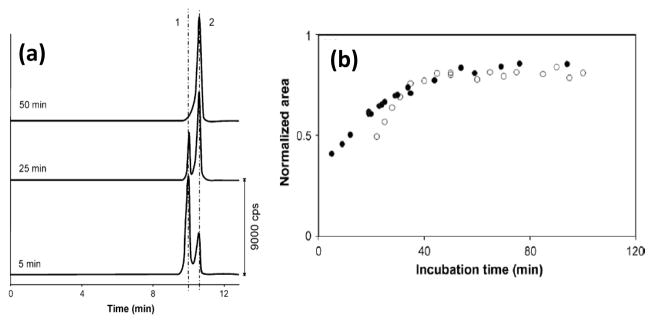
(a) Electropherograms used to study the interaction kinetics of albumin with indazolium trans-[tetrachlorobis(1H-indazole)ruthenate(III)](KP1019): peaks, (1) trans-[RuCl4(1H-indazole)2]−, and (2) ruthenum (III)–albumin complex. The plots in (b) show the relative peak areas for the ruthenium (III)-protein complexes as a function of reaction time for experiments conducted with KP1019 and albumin (black circles) or transferrin (open circles). Adapted with permission from Ref. [152].
5.3. Kinetic Capillary Electrophoresis
Kinetic capillary electrophoresis (KCE) is another method that can be used to determine kinetic parameters for biological interactions. This is a type of CE in which the species in the system of interest are interacting during their separation [20,159–162]. Various types of KCE have been developed to measure kinetic and thermodynamic parameters for biological interactions. These methods include non-equilibrium capillary electrophoresis of equilibrium mixtures (NECEEM), continuous NECEEM (cNECEEM), sweeping capillary electrophoresis (SweepCE), short SweepCE (sSweepCE), short SweepCE of equilibrium mixtures (sSweepCEEM), plug-plug KCE (ppKCE), and equilibrium capillary electrophoresis of equilibrium mixtures (ECEEM) [20,159–162]. A few examples of these methods are shown in Fig. 11.
Figure 11.

Some typical methods used in kinetic capillary electrophoresis, along with their simulated concentration profiles and initial or boundary conditions. The methods that are illustrated here are (a) non-equilibrium capillary electrophoresis of equilibrium mixture (NECEEM), (b) sweeping capillary electrophoresis (SweepCE), and (c) plug-plug KCE (ppKCE). Adapted with permission from Ref. [160].
The main model that is used in KCE methods for the measurement of rate constants is the biomolecular reaction between P and L to form PL, as described earlier in Eq. (5). KCE methods are based on the separation of P, L, and PL according to the differences in their electrophoretic velocities, as represented by vL, vP, and vPL, respectively. This separation can be described by the following set of partial differential equations [20,159–162].
| (29) |
| (30) |
| (31) |
In these equations, [P], [L] and [PL] are the concentrations of P, L and PL at time t (i.e., the time that has elapsed since the beginning of separation), and x is the distance from the injection end of the capillary.
The solution to the expressions in Eqs. (29–31) is found by using the initial and boundary conditions for the given separation system. These conditions include the initial distribution of L, P, and PL along the length of the capillary, and the manner in which L, P and PL are injected into and eluted from the capillary. Based on these conditions, the solution to Eqs. (29–31) can be determined through numerical or non-numerical methods and by making certain assumptions [159,160,163]. This solution can then be tested by fitting the experimental data to the predicted electropherograms, and the binding parameters can be determined through non-linear regression [159,160,163].
Fig. 11 includes the initial conditions and boundary conditions for some representative KCE methods [20,160]. The simulated concentration profiles for these methods are also provided. For example, in NECEEM the capillary is originally filled with only a running buffer. A small sample plug containing a mixture of P and L at equilibrium is injected into this capillary. Separation of the components in this mixture (P, L and PL) occurs as the sample passes through the capillary. However, during this separation the initial equilibrium is disturbed and dissociation occurs for the complex PL, which is reflected in the shape of the resulting electropherogram.
Fig. 12 shows a typical electropherogram for an NECEEM experiment, as obtained in experiments investigating the interaction of the AlkB protein from E. coli with a fluorescent labeled DNA aptamer [164]. As the protein-aptamer complex dissociated during the CE separation, the result was a distribution of the aptamer between the peaks for the complex and free aptamer. The areas of the peaks and overlapping regions in the electrophoreograms, which were related to the concentrations of the reacting components, were measured and used to find the rate constants for this system [164].
Figure 12.

Electropherogram obtained in studies of the interaction between the AlkB protein and its DNA aptamer by using non-equilibrium capillary electrophoresis of equilibrium mixtures (NECEEM). Adapted with permission from Ref. [164].
Examples of applications using other KCE methods can be found in Refs. [20,160–162,165]. KCE has been utilized to provide binding strengths and rate constants for several systems, including protein-oligonucleotide, protein-peptide, protein-small molecule, and oligonucleotide-small molecule interactions [20,159,160,162,164–171]. These methods have been used to measure dissociation rate constants that have ranged from 10−4 to 1 s−1 [159,160,166,172] and association rate constants that have ranged from 101 to 107 M−1 s−1 [164,165,167,168,169–172].
A multi-method KCE toolbox has also been developed to examine biological interactions. This approach involves proposing a reaction model between L and P, such as the one in Eq. (5), and then testing this model with several KCE methods. If a significant deviation is seen between the predicted results and the data for one or more methods, the reaction model is modified until a satisfactory fit is obtained by each KCE method. This approach has been used with six KCE methods to study the interactions between single-stranded DNA and ssDNA-binding protein. The results indicated that both specific and non-specific interactions were present in this system [20,160].
5.4. Advantages and Potential Limitations
Advantages to using CE for the study of biological interactions are the efficiency, speed and small sample requirements of this method [151,154–156]. One essential requirement for this approach is that a suitable difference in electrophoretic mobility must be present between the reactants and products of the interaction. The degree of separation of these species and their concentrations must also be sufficient to allow a measurable signal to be obtained that is related to the change in concentration of one or more of these chemicals over time [173].
The CE methods that were discussed in this section have been used to examine a number of systems with a relatively large range of rate constants. For instance, the overall range of dissociation rate constants that have been measured by CE is 10−6 to 1 s−1 [149–151,159,160,166,172], and the association rate constants have spanned from 1 to 107 M−1 s−1 [164,165,167,168,169–172].
CE allows biological interactions to be studied in solution without the need for immobilization of one of the reagents. It is important to remember, however, that some biomolecules such as proteins can adsorb to bare silica capillaries, as are often used in CE. This may lead to a loss in peak area or create peak tailing. If present, this effect needs to be considered by adding in an additional term into the differential equations in KCE methods. Alternatively, the running buffer’s composition or pH can be modified or a coating on the capillary wall can be employed to minimize this adsorption [160,174].
6. Conclusions
This review examined various techniques that are used in the study of biological interactions. Traditional or common methods such as stopped-flow analysis and SRP were considered, as well as separation-based measurements based on affinity chromatography or CE. The general principles of these techniques were described, and it was shown how each approach could be utilized to provide information on the rate constants for a biological interaction. Several applications were also provided, and the advantages or potential limitations of each method were discussed, as summarized in Table 1.
Table 1.
Advantages and potential limitations various methods used in the kinetic studies of biological interactions
| Method | Types of Binding Agents & Range of Measured Rate Constants | Advantages | Potential Limitations |
|---|---|---|---|
| Stopped-Flow Analysis | Solution-phase binding agent First-order reactions: 10−6 – 106 s−1 Second-order reactions: 1 – 109 M−1s−1 |
|
|
| Surface Plasmon Resonance Spectroscopy | Immobilized binding agent First-order reactions: 10−6 – 1 s−1 Second-order reactions: 102 – 108 M−1 s−1 |
|
|
| Affinity Chromatography | Immobilized or solution-phase binding agent First-order reactions: 10−2 – 101 s−1 Second-order reactions: 103 – 107 M−1 s−1 |
|
|
| Capillary Electrophoresis | Solution-phase binding agent First-order reactions: 10−6 – 1 s−1 Second-order reactions: 1 – 107 M−1s−1 |
|
|
Most of these methods are used to examine reversible bimolecular interactions or the dissociation of biological complexes. However, some of these approaches are also suitable for examining unimolecular interactions and multistep processes. Some of these techniques (e.g., stopped-flow analysis and CE) are used with solution-phase interactions, while others require an immobilized binding agent (SPR) or can be used with either an immobilized binding agent or a solution-phase reaction (affinity chromatography). These methods have been used to examine many processes, including the interactions of enzymes with peptides or coenzymes, protein-protein interactions, and the binding of proteins with DNA, RNA or small solutes (e.g., lipids, hormones, drugs, and metal ions). A broad range of rate constants can also be measured by this set of techniques.
The selection of an analytical method for such measurements will depend on the nature of the system being studied, the anticipated rate and complexity of the reaction, and the detectability and concentrations of the reactants or products, among other factors. However, given the set of tools that are already available, it is expected that kinetic measurements of biological systems will continue to grow in their scope and availability as work continues in this field. These efforts should make it possible to obtain even more detailed information on the rates and mechanisms of biological interactions, which should be valuable in areas such as pharmaceutical science, clinical chemistry, and biomedical research.
Highlights.
Various methods are available for kinetic studies of biological interactions.
Stopped-flow analysis is useful in examining solution-phase interactions.
Surface plasmon resonance is a flexible tool for kinetic and binding studies.
Affinity chromatography is a separation-based method for kinetic studies.
Capillary electrophoresis has been adapted for solution-phase kinetic studies.
Acknowledgments
Portions of this work were supported by the NIH under grants R01 GM044931 and R01 DK069629, the University of Nebraska UCARE program, and the NSF/EPSCoR program under grant EPS-1004094.
Footnotes
Publisher's Disclaimer: This is a PDF file of an unedited manuscript that has been accepted for publication. As a service to our customers we are providing this early version of the manuscript. The manuscript will undergo copyediting, typesetting, and review of the resulting proof before it is published in its final citable form. Please note that during the production process errors may be discovered which could affect the content, and all legal disclaimers that apply to the journal pertain.
References
- 1.Williams MA. Protein-ligand interactions: fundamentals. In: Williams MA, Daviter T, editors. Protein-Ligand Interactions, Methods and Applications. Springer; New York: 2013. pp. 3–34. [Google Scholar]
- 2.Schreiber G, Haran G, Zhou HX. Fundamental aspects of protein-protein association kinetics. Chem Rev. 2009;109:839–860. doi: 10.1021/cr800373w. [DOI] [PMC free article] [PubMed] [Google Scholar]
- 3.Frostell A, Vinterback L, Sjobom H. Protein-ligand interactions using SPR systems. In: Williams MA, Daviter T, editors. Protein-Ligand Interactions, Methods and Applications. Springer; New York: 2013. pp. 139–165. [DOI] [PubMed] [Google Scholar]
- 4.Myszka DG, Rich RL. Implementing surface plasmon resonance biosensors in drug discovery. Pharm Sci Technol Today. 2000;3:310–317. doi: 10.1016/s1461-5347(00)00288-1. [DOI] [PubMed] [Google Scholar]
- 5.Vuignier K, Schappler J, Veuthey J, Carrupt P, Martel S. Drug-protein binding: a critical review of analytical tools. Anal Bioanal Chem. 2010;398:53–66. doi: 10.1007/s00216-010-3737-1. [DOI] [PubMed] [Google Scholar]
- 6.Chaiken IM. Analytical Affinity Chromatography. CRC Press; Boca Raton: 1987. [Google Scholar]
- 7.Zheng X, Li Z, Beeram S, Podariu M, Matsuda R, Pfaunmiller EL, White CJ, II, Carter N, Hage DS. Analysis of biomolecular interactions using affinity microcolumns: a review. J Chromatogr B. 2014;968:49–63. doi: 10.1016/j.jchromb.2014.01.026. [DOI] [PMC free article] [PubMed] [Google Scholar]
- 8.Hage DS. Affinity chromatography. In: Corradini D, Katz E, Eksteen R, Shoenmakers P, Miller N, editors. Handbook of HPLC. Marcel Dekker; New York: 1998. pp. 483–498. [Google Scholar]
- 9.Schiel JE, Mallik R, Soman S, Joseph KS, Hage DS. Applications of silica supports in affinity chromatography. J Sep Sci. 2006;29:719–737. doi: 10.1002/jssc.200500501. [DOI] [PubMed] [Google Scholar]
- 10.Mallik R, Hage DS. Affinity monolith chromatography. J Sep Sci. 2006;29:1686–1704. doi: 10.1002/jssc.200600152. [DOI] [PubMed] [Google Scholar]
- 11.Kwong TC. Free drug measurements: methodology and clinical significance. Clin Chim Acta. 1985;151:193–216. doi: 10.1016/0009-8981(85)90082-8. [DOI] [PubMed] [Google Scholar]
- 12.Svensson CK, Woodruff MN, Baxter JG, Lalka D. Free drug concentration monitoring in clinical practice rationale and current status. Clin Pharmacokin. 1986;11:450–469. doi: 10.2165/00003088-198611060-00003. [DOI] [PubMed] [Google Scholar]
- 13.Carter DC, Ho JX. Structure of serum albumin. Adv Prot Chem. 1994;45:153–203. doi: 10.1016/s0065-3233(08)60640-3. [DOI] [PubMed] [Google Scholar]
- 14.Whitlam JB, Brown KF. Ultrafiltration in serum protein binding determinations. J Pharm Sci. 1981;70:146–150. doi: 10.1002/jps.2600700208. [DOI] [PubMed] [Google Scholar]
- 15.Liu S, Zhang L, Zhang X. Interaction between fluoroquinolones and bovine serum albumin studied by affinity capillary electrophoresis. Anal Sci. 2006;22:1515–1518. doi: 10.2116/analsci.22.1515. [DOI] [PubMed] [Google Scholar]
- 16.Day YSN, Myszka DG. Characterizing a drug’s primary binding site on albumin. J Pharm Sci. 2003;92:333–343. doi: 10.1002/jps.10293. [DOI] [PubMed] [Google Scholar]
- 17.Sulkowska A, Bojko B, Rownicka J, Rezner P, Sulkoxski WW. The competition of drugs to serum albumin in combination chemotherapy: NMR study. J Mol Struct. 2005;744–747:781–787. [Google Scholar]
- 18.Shortridge MD, Mercier KS, Hage DS, Harbison GS, Powers R. Estimating protein-ligand binding affinity using high-throughput screening by NMR. J Comb Chem. 2008;10:948–958. doi: 10.1021/cc800122m. [DOI] [PMC free article] [PubMed] [Google Scholar]
- 19.Hage DS, Jackson A, Sobansky MR, Schiel JE, Yoo MJ, Joseph KS. Characterization of drug-protein interactions in blood using high-performance affinity chromatography. J Sep Sci. 2009;32:835–853. doi: 10.1002/jssc.200800640. [DOI] [PMC free article] [PubMed] [Google Scholar]
- 20.Krylov SN. Kinetic CE: foundation for homogeneous kinetic affinity methods. Electrophoresis. 2007;28:69–88. doi: 10.1002/elps.200600577. [DOI] [PubMed] [Google Scholar]
- 21.Martin SR, Schilstra MJ. Rapid mixing kinetic techniques. In: Williams MA, Daviter T, editors. Protein-Ligand Interactions, Methods and Applications. Springer; New York: 2013. pp. 119–138. [DOI] [PubMed] [Google Scholar]
- 22.Espenson JH. Chemical Kinetics and Reaction Mechanisms. McGraw-Hill; New York: 1981. [Google Scholar]
- 23.Mottola HA. Kinetic Aspects of Analytical Chemistry. Wiley; New York: 1988. [Google Scholar]
- 24.Gomez-Hens A, Perez-Bendito D. The stopped-flow technique in analytical chemistry. Anal Chim Acta. 1991;242:147–177. [Google Scholar]
- 25.Perez-Bendito D, Gomez-Hens A, Silva M. Advances in drug analysis by kinetic methods. J Pharm Biomed Anal. 1996;14:917–930. doi: 10.1016/0731-7085(95)01673-2. [DOI] [PubMed] [Google Scholar]
- 26.Pardue HL. Kinetic aspects of analytical chemistry. Anal Chim Acta. 1989;216:69–107. [Google Scholar]
- 27.Perez-Bendito D, Silva M. Kinetic Methods in Analytical Chemistry. Ellis Horwood; Chichester: 1988. [Google Scholar]
- 28.Roder H, Maki K, Cheng H, Shastry MCR. Rapid mixing methods for exploring the kinetics of protein folding. Methods. 2004;34:15–27. doi: 10.1016/j.ymeth.2004.03.003. [DOI] [PubMed] [Google Scholar]
- 29.Mason JM, Hagemann UB, Arndt KM. Improved stability of the jun-fos activator protein-1 coiled coil motif: a stopped-flow circular dichroism kinetic analysis. J Biol Chem. 2007;282:23015–23024. doi: 10.1074/jbc.M701828200. [DOI] [PubMed] [Google Scholar]
- 30.Youngman KM, Spencer DB, Brems DN, DeFelippis MR. Kinetic analysis of the folding of human growth hormone. Influence of disulfide bonds. J Biol Chem. 1995;270:19816–19822. doi: 10.1074/jbc.270.34.19816. [DOI] [PubMed] [Google Scholar]
- 31.Wang Z, Watt W, Brooks NA, Harris MS, Urban J, Boatman D, McMillan M, Kahn M, Heinrikson RL, Finzel BC, Wittwer AJ, Blinn J, Kamtekar S, Tomasselli AG. Kinetic and structural characterization of caspase-3 and caspase-8 inhibition by a novel class of irreversible inhibitors. Biochim Biophys Acta. 2010;1804:1817–1831. doi: 10.1016/j.bbapap.2010.05.007. [DOI] [PubMed] [Google Scholar]
- 32.Shin JS, Yu MH. Kinetic dissection of α1-antitrypsin inhibition mechanism. J Biol Chem. 2002;277:11629–11635. doi: 10.1074/jbc.M111168200. [DOI] [PubMed] [Google Scholar]
- 33.Chi CN, Bach A, Gottschalk M, Kristensen AS, Stromgaard K, Jemth P. Deciphering the kinetic binding mechanism of dimeric ligands using a potent plasma-stable dimeric inhibitor of postsynaptic density protein-95 as an example. J Biol Chem. 2010;285:28252–28260. doi: 10.1074/jbc.M110.124040. [DOI] [PMC free article] [PubMed] [Google Scholar]
- 34.Isin EM, Guengerich FP. Kinetics and thermodynamics of ligand binding by cytochrome P450 3A4. J Biol Chem. 2006;281:9127–9136. doi: 10.1074/jbc.M511375200. [DOI] [PubMed] [Google Scholar]
- 35.Adams A, Guss JM, Collyer CA, Denny WA, Prakash AS, Wakelin LP. Acridinecarboxamide topoisomerase poisons: structural and kinetic studies of the DNA complexes of 5-substituted 9-amino-(N-(2-dimethylamino)ethyl)acridine-4-carboxamides. Mol Pharmacol. 2000;58:649–658. doi: 10.1124/mol.58.3.649. [DOI] [PubMed] [Google Scholar]
- 36.Isin EM, Guengerich FP. Multiple sequential steps involved in the binding of inhibitors to cytochrome P450 3A4. J Biol Chem. 2007;282:6863–6874. doi: 10.1074/jbc.M610346200. [DOI] [PubMed] [Google Scholar]
- 37.Garcon A, Bermingham A, Lian LY, Derrick JP. Kinetic and structural characterization of a product complex of 6-hydroxymethyl-7, 8-dihydropterin pyrophosphokinase from Escherichia coli. Biochem J. 2004;380:867–873. doi: 10.1042/BJ20031850. [DOI] [PMC free article] [PubMed] [Google Scholar]
- 38.Bandwar RP, Patel SS. Peculiar 2-aminopurine fluorescence monitors the dynamics of open complex formation by bacteriophage T7 RNA polymerase. J Biol Chem. 2001;276:14075–14082. doi: 10.1074/jbc.M011289200. [DOI] [PubMed] [Google Scholar]
- 39.Oertle M, Richter C, Winterhalter KH, Di lorio EE. Kinetics of carbon monoxide binding to phenobarbital-induced cytochrome P-450 from rat liver microsomes: a simple bimolecular process. Proc Natl Acad Sci USA. 1985;82:4900–4904. doi: 10.1073/pnas.82.15.4900. [DOI] [PMC free article] [PubMed] [Google Scholar]
- 40.Gray RD. Kinetics of CO binding to and dissociation from microsomal cytochrome P-450 induced by phenobarbital in rat liver. J Biol Chem. 1978;253:4364–4369. [PubMed] [Google Scholar]
- 41.Corcoran O, Mortensen RW, Hansen SH, Troke J, Nicholson JK. HPLC/1H NMR spectroscopic studies of the reactive α-1-O-acyl isomer formed during acyl migration of S-naproxen β-1-O-acyl glucuronide. Chem Res Toxicol. 2001;14:1363–1370. doi: 10.1021/tx010015q. [DOI] [PubMed] [Google Scholar]
- 42.Mortensen RW, Corcoran O, Cornett C, Sidelmann UG, Lindon JC, Nicholson JK, Hansen SH. S-Naproxen-β-1-O-acyl glucuronide degradation kinetic studies by stopped-flow high-performance liquid chromatography-1H NMR and high-performance liquid chromatography-UV. Drug Metab Dispos. 2001;29:375–380. [PubMed] [Google Scholar]
- 43.Mahdavian E, Spencer HT, Dunlap RB. Kinetic studies on drug-resistant variants of Escherichia coli thymidylate synthase: functional effects of amino acid substitutions at residue 4. Arch Biochem Biophys. 1999;368:257–264. doi: 10.1006/abbi.1999.1319. [DOI] [PubMed] [Google Scholar]
- 44.Inobe T, Arai M, Nakao M, Ito K, Kamagata K, Makio T, Amemiya Y, Kihara H, Kuwajima K. Equilibrium and kinetics of the allosteric transition of GroEL studied by solution X-ray scattering and fluorescence spectroscopy. J Mol Biol. 2003;327:183–91. doi: 10.1016/s0022-2836(03)00087-1. [DOI] [PubMed] [Google Scholar]
- 45.Gazaryan IG, Krasnikov BF, Ashby GA, Thorneley RN, Kristal BS, Brown AM. Zinc is a potent inhibitor of thiol oxidoreductase activity and stimulates reactive oxygen species production by lipoamide dehydrogenase. J Biol Chem. 2002;277:10064–10072. doi: 10.1074/jbc.M108264200. [DOI] [PubMed] [Google Scholar]
- 46.Wang W, Smith DK, Moulding K, Chen HM. The dependence of membrane permeability by the antibacterial peptide cecropin B and its analogs, CB-1 and CB-3, on liposomes of different composition. J Biol Chem. 1998;273:27438–27448. doi: 10.1074/jbc.273.42.27438. [DOI] [PubMed] [Google Scholar]
- 47.Beechem JM, James L, Brand L. Time-resolved fluorescence studies of the protein folding process: new instrumentation, analysis, and experimental approaches. SPIE Proc. 1990;1204:686–698. [Google Scholar]
- 48.Jones BE, Beechem JM, Matthews CR. Local and global dynamics during the folding of Escherichia coli dihydrofolate reductase by time-resolved fluorescence spectroscopy. Biochemistry. 1995;34:1867–1877. doi: 10.1021/bi00006a007. [DOI] [PubMed] [Google Scholar]
- 49.Balbach J, Forge V, van Nuland NAJ, Winder SL, Hore PJ, Dobson CM. Following protein folding in real time using NMR spectroscopy. Nat Struct Biol. 1995;2:865–870. doi: 10.1038/nsb1095-865. [DOI] [PubMed] [Google Scholar]
- 50.Frieden C. The kinetics of side chain stabilization during protein folding. Biochemistry. 2003;42:12439–12446. doi: 10.1021/bi030192l. [DOI] [PubMed] [Google Scholar]
- 51.Segel DJ, Bachmann A, Hofrichter J, Hodgson KO, Doniach S, Kiefhaber T. Characterization of transient intermediates in lysozyme folding with time-resolved small-angle X-ray scattering. J Mol Biol. 1999;288:489–499. doi: 10.1006/jmbi.1999.2703. [DOI] [PubMed] [Google Scholar]
- 52.Terpstra T, McNally J, Han TH, Ha-Duong NT, El-Hage-Chahine JM, Bou-Abdallah F. Direct thermodynamic and kinetic measurements of Fe2+ and Zn2+ binding to human serum transferrin. J Inorg Biochem. 2014;136:24–32. doi: 10.1016/j.jinorgbio.2014.03.007. [DOI] [PubMed] [Google Scholar]
- 53.Maes V, Engelborghs Y, Hoebeke J, Maras Y, Vercruysse A. Fluorimetric analysis of the binding of warfarin to human serum albumin. Equilibrium and kinetic study. Mol Pharmacol. 1982;21:100–107. [PubMed] [Google Scholar]
- 54.Jamieson ER, Lippard SJ. Stopped-flow fluorescence studies of HMG-domain protein binding to cisplatin-modified DNA. Biochemistry. 2000;39:8426–8438. doi: 10.1021/bi000342h. [DOI] [PubMed] [Google Scholar]
- 55.Zhao X, Yu S, Magliozzo RS. Characterization of the binding of isoniazid and analogues to mycobacterium tuberculosis catalase-peroxidase. Biochemistry. 2007;46:3161–3170. doi: 10.1021/bi062218p. [DOI] [PubMed] [Google Scholar]
- 56.Feng Y, Xie N, Jin M, Stahley MR, Stivers JT, Zheng YG. A transient kinetic analysis of PRMT1 catalysis. Biochemistry. 2011;50:7033–7044. doi: 10.1021/bi200456u. [DOI] [PMC free article] [PubMed] [Google Scholar]
- 57.Nijvipakul S, Ballou DP, Chaiyen P. Reduction kinetics of a flavin oxidoreductase LuxG from Photobacterium leiognathi (TH1): half-sites reactivity. Biochemistry. 2010;49:9241–9248. doi: 10.1021/bi1009985. [DOI] [PMC free article] [PubMed] [Google Scholar]
- 58.Moxley MA, Becker DF. Rapid reaction kinetic of proline dehydrogenase in the multifunctional proline utilization A protein. Biochemistry. 2012;51:511–520. doi: 10.1021/bi201603f. [DOI] [PMC free article] [PubMed] [Google Scholar]
- 59.Barbero N, Napione L, Visentin S, Alvaro M, Veglio A, Bussolino F, Viscardi G. A transient kinetic study between signaling proteins: the case of the MEK-ERK interaction. Chem Sci. 2011;2:1804–1809. [Google Scholar]
- 60.Eaton AK, Stewart RC. Kinetics of ATP and TNP-ATP binding to the active site of CheA from Thermotoga maritima. Biochemistry. 2010;49:5799–5809. doi: 10.1021/bi100721b. [DOI] [PubMed] [Google Scholar]
- 61.Reeder BJ, Svistunenko DA, Wilson MT. Lipid binding to cytoglobin leads to a change in haem co-ordination: a role for cytoglobin in lipid signalling of oxidative stress. Biochem J. 2011;434:483–492. doi: 10.1042/BJ20101136. [DOI] [PubMed] [Google Scholar]
- 62.Adamek N, Geeves MA. Use of pyrene-labelled actin to probe actin-myosin interactions: kinetic and equilibrium studies. EXS. 2014;105:87–104. doi: 10.1007/978-3-0348-0856-9_5. [DOI] [PubMed] [Google Scholar]
- 63.Furch M, Geeves MA, Manstein DJ. Modulation of actin affinity and actomyosin adenosine triphosphatase by charge changes in the myosin motor domain. Biochemistry. 1998;37:6317–6326. doi: 10.1021/bi972851y. [DOI] [PubMed] [Google Scholar]
- 64.Iorga B, Adamek N, Geeves MA. The slow skeletal muscle isoform of myosin shows kinetic features common to smooth and non-muscle myosin. J Biol Chem. 2007;282:3559–3570. doi: 10.1074/jbc.M608191200. [DOI] [PubMed] [Google Scholar]
- 65.Bloemink M, Deacon J, Langer S, Vera C, Combs A, Leinwand L, Geeves MA. The hypertrophic cardiomyopathy myosin mutation R453C alters ATP binding and hydrolysis of human cardiac β-myosin. J Biol Chem. 2014;289:5158–5167. doi: 10.1074/jbc.M113.511204. [DOI] [PMC free article] [PubMed] [Google Scholar]
- 66.Dumortier C, Gorbunoff MJ, Andreu JM, Engelborghs Y. Different kinetic pathways of the binding of two biphenyl analogues of colchicine to tubulin. Biochemistry. 1996;35:4387–4395. doi: 10.1021/bi952451f. [DOI] [PubMed] [Google Scholar]
- 67.Dumortier C, Potenziano JL, Bane S, Engelborghs Y. The mechanism of tubulin-colchicine recognition - a kinetic study of the binding of a bicyclic colchicine analogue with a minor modification of the A ring. Eur J Biochem. 1997;249:265–269. doi: 10.1111/j.1432-1033.1997.t01-1-00265.x. [DOI] [PubMed] [Google Scholar]
- 68.Khan MA, Miyoshi H, Ray S, Natsuaki T, Suehiro N, Goss DJ. Interaction of genome-linked protein (VPg) of turnip mosaic virus with wheat germ translation initiation factors eIFiso4E and eIFiso4F. J Biol Chem. 2007;281:28002–28010. doi: 10.1074/jbc.M605479200. [DOI] [PubMed] [Google Scholar]
- 69.Heidebrecht T, Fish A, von Castelmur E, Johnson KA, Zaccai G, Borst P, Perrakis A. Binding of the J-binding protein to DNA containing glucosylated hmU (base J) or 5-hmC: evidence for a rapid conformational change upon DNA binding. J Am Chem Soc. 2012;134:13357–13365. doi: 10.1021/ja303423t. [DOI] [PubMed] [Google Scholar]
- 70.Otzen DE, Blans K, Wang H, Gilbert GE, Rasmussen JT. Lactadherin binds to phosphatidylserine-containing vesicles in a two-step mechanism sensitive to vesicle size and composition. Biochim Biophys Acta. 2012;1818:1019–1027. doi: 10.1016/j.bbamem.2011.08.032. [DOI] [PubMed] [Google Scholar]
- 71.Garland DL. Kinetics and mechanism of colchicine binding to tubulin: evidence for ligand-induced conformational changes. Biochemistry. 1978;17:4266–4272. doi: 10.1021/bi00613a024. [DOI] [PubMed] [Google Scholar]
- 72.Yarbrough LR, Wu FY, Wu CW. Molecular mechanism of the rifampicin-RNA polymerase interaction. Biochemistry. 1976;15:2669–2676. doi: 10.1021/bi00657a029. [DOI] [PubMed] [Google Scholar]
- 73.Verhamme IM, Bock PE. Rapid-reaction kinetic characterization of the pathway of streptokinase-plasmin catalytic complex formation. J Biol Chem. 2008;283:26137–26147. doi: 10.1074/jbc.M804038200. [DOI] [PMC free article] [PubMed] [Google Scholar]
- 74.Scott DJ, Ferguson AL, Gallegos MT, Pitt M, Buck M, Hoggett JG. Interaction of sigma factor σN with Escherichia coli RNA polymerase core enzyme. Biochem J. 2000;352:539–547. [PMC free article] [PubMed] [Google Scholar]
- 75.Zhao L, Pence MG, Eoff RL, Yuan S, Fercu CA, Guengerich FP. Elucidation of kinetic mechanisms of human translesion DNA polymerase κ using tryptophan mutants. FEBS J. 2014;281:4394–4410. doi: 10.1111/febs.12947. [DOI] [PMC free article] [PubMed] [Google Scholar]
- 76.Kovacs E, Toth J, Vertessy BG, Liliom K. Dissociation of calmodulin-target peptide complexes by the lipid mediator sphingosylphosphorylcholine: implications in calcium signaling. J Biol Chem. 2010;285:1799–1808. doi: 10.1074/jbc.M109.053116. [DOI] [PMC free article] [PubMed] [Google Scholar]
- 77.Wands AM, Wang N, Lum JK, Hsieh J, Fierke CA, Mapp AK. Transient-state kinetic analysis of transcriptional activator·DNA complexes interacting with a key coactivator. J Biol Chem. 2011;286:16238–16245. doi: 10.1074/jbc.M110.207589. [DOI] [PMC free article] [PubMed] [Google Scholar]
- 78.Gong Y, Tang H, Bohne C, Plettner E. Binding conformation and kinetics of two pheromone-binding proteins from the Gypsy month Lymantria dispar with biological and nonbiological ligands. Biochemistry. 2010;49:793–801. doi: 10.1021/bi901145a. [DOI] [PubMed] [Google Scholar]
- 79.Ecevit O, Khan MA, Gross DJ. Kinetic analysis of the interaction of b/HLH/Z transcription factors Myc, Max, and Mad with cognate DNA. Biochemistry. 2010;49:2627–2635. doi: 10.1021/bi901913a. [DOI] [PMC free article] [PubMed] [Google Scholar]
- 80.Kalidas C. Chemical Kinetic Methods: Principles of Fast Reaction Techniques and Applications. 2. New Age International; Delhi, India: 2005. [Google Scholar]
- 81.Long SD, Myszka DG. Affinity-based optical biosensors. In: Hage DS, editor. Handbook of Affinity Chromatography. 2. CRC Press; Boca Raton, FL: 2006. pp. 685–696. [Google Scholar]
- 82.Homola J, Yee SS, Gauglitz G. Surface plasmon resonance sensors: review. Sensors Actuators B: Chem. 1999;54:3–15. [Google Scholar]
- 83.Daghestani HN, Day BW. Theory and applications of surface plasmon resonance, resonant mirror, resonant waveguide grating, and dual polarization interferometry biosensors. Sensors. 2010;10:9630–9646. doi: 10.3390/s101109630. [DOI] [PMC free article] [PubMed] [Google Scholar]
- 84.Van Der Merwe PA. Surface plasmon resonance. In: Harding SE, Chowdhry BZ, editors. Protein-Ligand Interactions: Hydrodynamics and Calorimetry. 1. Oxford University Press; UK: 2001. pp. 137–170. [Google Scholar]
- 85.Patching SG. Surface plasmon resonance spectroscopy for characterisation of membrane protein-ligand interactions and its potential for drug discovery. Biochim Biophys Acta. 2014;1838:43–55. doi: 10.1016/j.bbamem.2013.04.028. [DOI] [PubMed] [Google Scholar]
- 86.Edwards PR, Maule CH, Leatherbarrow RJ, Winzor DJ. Second-order kinetic analysis of IAsys biosensor data: its use and applicability. Anal Biochem. 1998;263:1–12. doi: 10.1006/abio.1998.2814. [DOI] [PubMed] [Google Scholar]
- 87.George AJT, French RR, Glennie MJ. Measurement of kinetic binding constants of a panel of anti-saporin antibodies using a resonant mirror biosensor. J Immunol Methods. 1995;183:51–63. doi: 10.1016/0022-1759(95)00031-5. [DOI] [PubMed] [Google Scholar]
- 88.Campbell CT, Kim G. SPR microscopy and its applications to high-throughput analyses of biomolecular binding events and their kinetics. Biomaterials. 2007;28:2380–2392. doi: 10.1016/j.biomaterials.2007.01.047. [DOI] [PubMed] [Google Scholar]
- 89.Komolov KE, Aguila M, Toledo D, Manyosa J, Garriga P, Koch KW. On-chip photoactivation of heterologously expressed rhodopsin allows kinetic analysis of G-protein signaling by surface plasmon resonance spectroscopy. Anal Bioanal Chem. 2010;397:2967–2976. doi: 10.1007/s00216-010-3876-4. [DOI] [PubMed] [Google Scholar]
- 90.Bich C, Scott M, Panagiotidis A, Wenzel RJ, Nazabal A, Zenobi R. Characterization of antibody-antigen interactions: comparison between surface plasmon resonance measurements and high-mass matrix-assisted laser desorption/ionization mass spectrometry. Anal Biochem. 2008;375:35–45. doi: 10.1016/j.ab.2007.11.016. [DOI] [PubMed] [Google Scholar]
- 91.Hearty S, Leonard P, O’Kennedy R. Measuring antibody-antigen binding kinetics using surface plasmon resonance. Methods Mol Biol. 2012;907:411–442. doi: 10.1007/978-1-61779-974-7_24. [DOI] [PubMed] [Google Scholar]
- 92.Zhao H, Gorshkova II, Fu GL, Schuck P. A comparison of binding surfaces for SPR biosensing using an antibody–antigen system and affinity distribution analysis. Methods. 2013;59:328–335. doi: 10.1016/j.ymeth.2012.12.007. [DOI] [PMC free article] [PubMed] [Google Scholar]
- 93.Pollet J, Delport F, Janssen KP, Jans K, Maes G, Pfeiffer H, Wevers M, Lammertyn J. Fiber optic SPR biosensing of DNA hybridization and DNA-protein interactions. Biosens Bioelectron. 2009;25:864–869. doi: 10.1016/j.bios.2009.08.045. [DOI] [PubMed] [Google Scholar]
- 94.Vacha P, Zuskova I, Bumba L, Herman P, Vecer J, Obsilova V, Obsil T. Detailed kinetic analysis of the interaction between the FOXO4-DNA-binding domain and DNA. Biophys Chem. 2013;184:68–78. doi: 10.1016/j.bpc.2013.09.002. [DOI] [PubMed] [Google Scholar]
- 95.Jecklin MC, Schauer S, Dumelin CE, Zenobi R. Label-free determination of protein-ligand binding constants using mass spectrometry and validation using surface plasmon resonance and isothermal titration calorimetry. J Mol Recognit. 2009;22:319–329. doi: 10.1002/jmr.951. [DOI] [PubMed] [Google Scholar]
- 96.Zhukov A, Andrews SP, Errey JC, Robertson N, Tehan B, Mason JS, Marshall FH, Weir M, Congreve M. Biophysical mapping of the adenosine A2A receptor. J Med Chem. 2011;54:4312–4323. doi: 10.1021/jm2003798. [DOI] [PMC free article] [PubMed] [Google Scholar]
- 97.Papalia GA, Leavitt S, Bynum MA, Katsamba PS, Wilton R, Qiu H, Steukers M, Wang S, Bindu L, Phogat S, Giannetti AM, Ryan TE, Pudlak VA, Matusiewicz K, Michelson KM, Nowakowski A, Pham-Baginski A, Brooks J, Tieman BC, Bruce BD, Vaughn M, Baksh M, Cho YH, Wit MD, Smets A, Vandersmissen J, Michiels L, Myszka DG. Comparative analysis of 10 small molecules binding to carbonic anhydrase II by different investigators using Biacore technology. Anal Biochem. 2006;359:94–105. doi: 10.1016/j.ab.2006.08.021. [DOI] [PubMed] [Google Scholar]
- 98.Tassa C, Liong M, Hilderbrand S, Sandler JE, Reiner T, Keliher EJ, Weissleder R, Shaw SY. On-chip bioorthogonal chemistry enables immobilization of in situ modified nanoparticles and small molecules for label-free monitoring of protein binding and reaction kinetics. Lab Chip. 2012;12:3103–3110. doi: 10.1039/c2lc40337d. [DOI] [PMC free article] [PubMed] [Google Scholar]
- 99.Jung LS, Nelson KE, Campbell CT, Stayton PS, Yee SS, Pérez-Luna V, López GP. Surface plasmon resonance measurement of binding and dissociation of wild-type and mutant streptavidin on mixed biotin-containing alkylthiolate monolayers. Sensors Actuators B: Chem. 1999;54:137–144. [Google Scholar]
- 100.Boozer C, Kim G, Cong S, Guan H, Londergan T. Looking towards label-free biomolecular interaction analysis in a high-throughput format: a review of new surface plasmon resonance technologies. Curr Opin Biotechnol. 2006;17:400–405. doi: 10.1016/j.copbio.2006.06.012. [DOI] [PubMed] [Google Scholar]
- 101.Karlsson R. SPR for molecular interaction analysis: a review of emerging application areas. J Mol Recogn. 2004;17:151–161. doi: 10.1002/jmr.660. [DOI] [PubMed] [Google Scholar]
- 102.Jimenez-Castells C, Defaus S, Moise A, Przbylski M, Andreu D, Gutierrez-Gallego R. Surface-based and mass spectrometric approaches to deciphering sugar-protein interactions in a galactose-specific agglutinin. Anal Chem. 2012;84:6515–6520. doi: 10.1021/ac300766z. [DOI] [PubMed] [Google Scholar]
- 103.Natsume T, Nakayama H, Jansson O, Isobe T, Takio K, Mikoshiba K. Combination of biomolecular interaction analysis and mass spectrometric amino acid sequencing. Anal Chem. 2000;72:4193–4198. doi: 10.1021/ac000167a. [DOI] [PubMed] [Google Scholar]
- 104.Hahnefeld C, Drewianka S, Herberg F. Determination of kinetic data using surface plasmon resonance biosensors. In: Decler J, Reischl U, editors. Molecular Diagnosis of Infectious Diseases. Humana Press; 2004. pp. 299–320. [DOI] [PubMed] [Google Scholar]
- 105.Winzor DJ. Quantitative affinity chromatography: recent theoretical developments. In: Hage DS, editor. Handbook of Affinity Chromatography. 2. CRC Press; Boca Raton, FL: 2006. pp. 629–662. [Google Scholar]
- 106.Schiel JE, Hage DS. Kinetic studies of biological interactions by affinity chromatography. J Sep Sci. 2009;32:1507–1522. doi: 10.1002/jssc.200800685. [DOI] [PMC free article] [PubMed] [Google Scholar]
- 107.Hage DS, Ruhn PF. An introduction to affinity chromatography. In: Hage DS, editor. Handbook of Affinity Chromatography. 2. CRC Press; Boca Raton, FL: 2006. pp. 3–13. [Google Scholar]
- 108.Walters RR. Affinity chromatography. Anal Chem. 1985;57:1099A–1114A. doi: 10.1021/ac00288a001. [DOI] [PubMed] [Google Scholar]
- 109.Cuatrecasas P, Wilchek M, Anfinsen CB. Selective enzyme purification by affinity chromatography. Proc Natl Acad Sci USA. 1968;61:636–643. doi: 10.1073/pnas.61.2.636. [DOI] [PMC free article] [PubMed] [Google Scholar]
- 110.Turkova J. Affinity Chromatography. Elsevier; Amsterdam: 1978. [Google Scholar]
- 111.Hage DS. Handbook of Affinity Chromatography. 2. CRC Press; Boca Raton, FL: 2006. [Google Scholar]
- 112.Schiel JE, Ohnmacht CM, Hage DS. Measurements of drug-protein dissociation rates by high-performance affinity chromatography and peak profiling. Anal Chem. 2009;81:4320–4333. doi: 10.1021/ac9000404. [DOI] [PMC free article] [PubMed] [Google Scholar]
- 113.Hage DS, Chen J. Quantitative affinity chromatography: practical aspects. In: Hage DS, editor. Handbook of Affinity Chromatography. 2. CRC Press; Boca Raton, FL: 2006. pp. 595–628. [Google Scholar]
- 114.Loun B, Hage DS. Chiral separation mechanisms in protein-based HPLC columns. 2. Kinetic studies of (R)- and (S)-warfarin binding to immobilized human serum albumin. Anal Chem. 1996;68:1218–1225. doi: 10.1021/ac950827p. [DOI] [PubMed] [Google Scholar]
- 115.Yang J, Hage DS. Effect of mobile phase composition on the binding kinetics of chiral solutes on a protein-based high-performance liquid chromatography column: interactions of d- and l- tryptophan with immobilized human serum albumin. J Chromatogr A. 1997;766:15–25. doi: 10.1016/s0021-9673(96)01040-0. [DOI] [PubMed] [Google Scholar]
- 116.Yoo MJ, Hage DS. Evaluation of silica monoliths in affinity microcolumns for high-throughput analysis of drug-protein interactions. J Sep Sci. 2009;32:2776–2785. doi: 10.1002/jssc.200900346. [DOI] [PMC free article] [PubMed] [Google Scholar]
- 117.Yoo MJ, Schiel JE, Hage DS. Evaluation of affinity microcolumns containing human serum albumin for rapid analysis of drug-protein binding. J Chromatogr B. 2010;878:1707–1713. doi: 10.1016/j.jchromb.2010.04.028. [DOI] [PMC free article] [PubMed] [Google Scholar]
- 118.Tong Z, Schiel JE, Papastavros E, Ohnmacht CM, Smith QR, Hage DS. Kinetic studies of drug-protein interactions by using peak profiling and high-performance affinity chromatography: examination of multi-site interactions of drugs with human serum albumin columns. J Chromatogr A. 2011;1218:2065–2071. doi: 10.1016/j.chroma.2010.10.070. [DOI] [PMC free article] [PubMed] [Google Scholar]
- 119.Talbert AM, Tranter GE, Holmes E, Francis PL. Determination of drug-plasma protein binding kinetics and equilibria by chromatographic profiling: exemplification of the method using L-tryptophan and albumin. Anal Chem. 2002;74:446–452. doi: 10.1021/ac010643c. [DOI] [PubMed] [Google Scholar]
- 120.Fitos I, Visy J, Kardos J. Stereoselective kinetics of warfarin binding to human serum albumin: effect of an allosteric interaction. Chirality. 2002;14:442–448. doi: 10.1002/chir.10113. [DOI] [PubMed] [Google Scholar]
- 121.Tong Z, Hage DS. Characterization of interaction kinetics between chiral solutes and human serum albumin by using high-performance affinity chromatography and peak profiling. J Chromatogr A. 2011;1218:6892–6897. doi: 10.1016/j.chroma.2011.08.026. [DOI] [PMC free article] [PubMed] [Google Scholar]
- 122.Li H, Ge J, Guo T, Yang S, He Z, York P, Sun L, Xu X, Zhang J. Determination of the kinetic rate constant of cyclodextrin supramolecular systems by high performance affinity chromatography. J Chromatogr A. 2013;1305:139–148. doi: 10.1016/j.chroma.2013.07.010. [DOI] [PubMed] [Google Scholar]
- 123.Wade JL, Bergold AF, Carr PW. Theoretical description of nonlinear chromatography, with applications to physicochemical measurements in affinity chromatography and implications for preparative-scale separations. Anal Chem. 1987;59:1286–1295. [Google Scholar]
- 124.Thomas HC. Heterogeneous ion exchange in a flowing system. J Am Chem Soc. 1944;66:1664–1666. [Google Scholar]
- 125.Moaddel R, Wainer I. Conformational mobility of immobilized proteins. J Pharm Biomed Anal. 2007;43:399–406. doi: 10.1016/j.jpba.2006.08.021. [DOI] [PubMed] [Google Scholar]
- 126.Moaddel R, Jozwiak K, Yamaguchi R, Wainer IW. Direct chromatographic determination of dissociation rate constants of ligand-receptor complexes: assessment of the interaction of noncompetitive inhibitors with an immobilized nicotinic acetylcholine receptor-based liquid chromatography stationary phase. Anal Chem. 2005;77:5421–5426. doi: 10.1021/ac0504464. [DOI] [PubMed] [Google Scholar]
- 127.Lee WC, Chuang CY. Performance of pH elution in high-performance affinity chromatography of proteins using non-porous silica. J Chromatogr A. 1996;721:31–39. [Google Scholar]
- 128.Lee WC, Chen CH. Predicting the elution behavior of proteins in affinity chromatography on non-porous particles. J Biochem Biophys Methods. 2001;49:63–82. doi: 10.1016/s0165-022x(01)00189-0. [DOI] [PubMed] [Google Scholar]
- 129.Renard J, Vidal-Madjor C, Lapresle C. Determination by chromatographic methods of the adsorption rate constant of HSA on immobilized polyclonal and monoclonal antibodies. J Coll Inter Sci. 1995;174:61–67. [Google Scholar]
- 130.Munro PD, Winzor DJ, Cann JR. Allowance for kinetics of partition in the determination of rate constant by affinity chromatography. J Chromatogr A. 1994;659:267–273. [Google Scholar]
- 131.Munro PD, Winzor DJ, Cann JR. Experimental and theoretical studies of rate constant evaluation by affinity chromatography: determination of rate constants for the interaction of saccharides with concanavalin A. J Chromatogr. 1993;646:3–15. [Google Scholar]
- 132.de Lucena SL, Carbonell RG, Santana CC. Peptide affinity chromatography process for the adsorption of fibrinogen. Powder Technol. 1999;101:173–177. [Google Scholar]
- 133.Hage DS, Walters RR, Hethcote HW. Split-peak affinity chromatographic studies of the immobilization-dependent adsorption kinetics of protein A. Anal Chem. 1986;58:274–279. doi: 10.1021/ac00293a003. [DOI] [PubMed] [Google Scholar]
- 134.Hage DS, Walters RR. Non-linear elution effect in split-peak chromatography: I. Computer simulations for the cases of irreversible diffusion- and adsorption-limited kinetics. J Chromatogr A. 1988;436:111–135. [Google Scholar]
- 135.Hage DS, Walters RR. Dual-column determination of albumin and immunoglobulin G in serum by high-performance affinity chromatography. J Chromatogr. 1987;386:37–49. doi: 10.1016/s0021-9673(01)94582-0. [DOI] [PubMed] [Google Scholar]
- 136.Rollag JG, Hage DS. Non-linear elution effects in split-peak chromatography: II. Role of ligand heterogeneity in solute binding to columns with adsorption-limited kinetics. J Chromatogr A. 1998;795:185–198. doi: 10.1016/s0021-9673(97)00975-8. [DOI] [PubMed] [Google Scholar]
- 137.Renard J, Vidal-Madjar C, Sebille B, Labresle C. Chromatographic kinetic measurements of human serum albumin adsorption on monoclonal antibodies. J Mol Recognit. 1995;8:85–89. doi: 10.1002/jmr.300080115. [DOI] [PubMed] [Google Scholar]
- 138.Renard J, Vidal-Madjar C. Kinetic study of the adsorption of human serum albumin on immobilized antibody using the split-peak effect in immunochromatography. J Chromatogr A. 1994;661:35–42. doi: 10.1016/0021-9673(94)85174-3. [DOI] [PubMed] [Google Scholar]
- 139.Vidal-Madjar C, Jaulmes A, Renard J, Peter D, Lafaye P. Chromatographic study of the adsorption kinetics of albumin on monoclonal and polyclonal immunoadsorbents. Chromatographia. 1997;45:18–24. [Google Scholar]
- 140.Chen J, Schiel JE, Hage DS. Noncompetitive peak decay analysis of drug-protein dissociation by high-performance affinity chromatography. J Sep Sci. 2009;32:1632–1641. doi: 10.1002/jssc.200900074. [DOI] [PMC free article] [PubMed] [Google Scholar]
- 141.Moore RM, Walters RR. Peak-decay method for the measurement of dissociation rate constants by high-performance affinity chromatography. J Chromatogr. 1987;384:91–103. [Google Scholar]
- 142.Yoo MJ, Hage DS. High-throughput analysis of drug dissociation from serum proteins using affinity silica monoliths. J Sep Sci. 2011;34:2255–2263. doi: 10.1002/jssc.201100280. [DOI] [PMC free article] [PubMed] [Google Scholar]
- 143.Yoo MJ, Hage DS. Use of peak decay analysis and affinity microcolumns containing silica monoliths for rapid determination of drug-protein dissociation rates. J Chromatogr A. 2011;1218:2072–2078. doi: 10.1016/j.chroma.2010.09.070. [DOI] [PMC free article] [PubMed] [Google Scholar]
- 144.Nelson MA, Moser A, Hage DS. Biointeraction analysis by high-performance affinity chromatography: kinetic studies of immobilized antibodies. J Chromatogr B. 2010;878:165–171. doi: 10.1016/j.jchromb.2009.04.004. [DOI] [PMC free article] [PubMed] [Google Scholar]
- 145.Pfaunmiller E, Moser AC, Hage DS. Biointeraction analysis of immobilized antibodies and related agents by high-performance immunoaffinity chromatography. Methods. 2012;56:130–135. doi: 10.1016/j.ymeth.2011.08.016. [DOI] [PMC free article] [PubMed] [Google Scholar]
- 146.Anguizola JA. PhD Dissertation. University of Nebraska-Lincoln; Lincoln, Nebraska: 2013. Affinity Chromatographic Studies of Drug-Protein Binding in Personalized Medicine. [Google Scholar]
- 147.Mallik R, Yoo MJ, Briscoe CJ, Hage DS. Analysis of drug-protein binding by ultrafast affinity chromatography using immobilized human serum albumin. J Chromatogr A. 2010;1217:2796–2803. doi: 10.1016/j.chroma.2010.02.026. [DOI] [PMC free article] [PubMed] [Google Scholar]
- 148.Zheng X, Yoo MJ, Hage DS. Analysis of free fractions for chiral drugs using ultrafast extraction and multi-dimensional high-performance affinity chromatography. Analyst. 2013;138:6262–6265. doi: 10.1039/c3an01315d. [DOI] [PMC free article] [PubMed] [Google Scholar]
- 149.Zheng X, Li Z, Podariu MI, Hage DS. Determination of rate constants and equilibrium constants for solution-phase drug-protein interactions by ultrafast affinity extraction. Anal Chem. 2014;86:6454–6460. doi: 10.1021/ac501031y. [DOI] [PMC free article] [PubMed] [Google Scholar]
- 150.Kim HS, Hage DS. Immobilization methods for affinity chromatography. In: Hage DS, editor. Handbook of Affinity Chromatography. 2. CRC Press; Boca Raton, FL: 2006. pp. 35–78. [Google Scholar]
- 151.Bosserhoff A, Hellerbrand C. Capillary electrophoresis. In: Patrinos GP, Ansorge W, editors. Molecular Diagnostics. Academic Press; Massachusetts: 2005. pp. 67–81. [Google Scholar]
- 152.Polec-Pawlak K, Abramski JK, Ferenc J, Foteeva LS, Timerbaev AR, Keppler BK, Jarosz M. Application of capillary electrophoresis-inductively coupled plasma mass spectrometry to comparative studying of the reactivity of antitumor ruthenium (III) complexes differing in the nature of counter-ion toward human serum proteins. J Chromatogr A. 2008;1192:323–326. doi: 10.1016/j.chroma.2008.04.009. [DOI] [PubMed] [Google Scholar]
- 153.Aleksenko SS, Matczuk M, Lu X, Foteeva LS, Pawlak K, Timerbaev AR, Jarosz M. Metallomics for drug development: an integrated CE-ICP-MS and ICP-MS approach reveals the speciation changes for an investigational ruthenium (III) drug bound to holo-transferrin in simulated cancer cytosol. Metallomics. 2013;5:955–963. doi: 10.1039/c3mt00092c. [DOI] [PubMed] [Google Scholar]
- 154.Timerbaev AR, Aleksenko SS, Polec-Pawlak K, Ruzik R, Semenova O, Hartinger CG, Oszwaldowski S, Galanski M, Jarosz M, Keppler BK. Platinum metallodrug-protein binding studies by capillary electrophoresis-inductively coupled plasma-mass spectrometry: Characterization of interactions between Pt(II) complexes and human serum albumin. Electrophoresis. 2004;25:1988–1995. doi: 10.1002/elps.200305984. [DOI] [PubMed] [Google Scholar]
- 155.Iqbal S, Rahman N, Iqbal J. A capillary electrophoresis-based enzyme assay for kinetics and inhibition studies of carbonic anhydrase. Anal Biochem. 2014;444:16–21. doi: 10.1016/j.ab.2013.09.018. [DOI] [PubMed] [Google Scholar]
- 156.Petersen JR, Mohammad AA. Clinical and Forensic Applications of Capillary Electrophoresis. 1. Humana; New York: 2001. [Google Scholar]
- 157.Maher HM. Recent advances in applications of capillary electrophoresis with Fourier transform convolution: application to kinetic study of hydrolysis of hydrochlorothiazide. Biomed Chromatogr. 2014;28:573–582. [Google Scholar]
- 158.Grabmann G, Keppler B, Hartinger C. A systematic capillary electrophoresis study on the effect of the buffer composition on the reactivity of the anticancer drug cisplatin to the DNA model 2′-deoxyguanosine 5′-monophosphate (dGMP) Anal Bioanal Chem. 2013;405:6417–6424. doi: 10.1007/s00216-013-6937-7. [DOI] [PubMed] [Google Scholar]
- 159.Berezovski M, Krylov SN. Nonequilibrium capillary electrophoresis of equilibrium mixture –a single experiment reveals equilibrium and kinetic parameters of protein-DNA interactions. J Am Chem Soc. 2002;1247:13674–13675. doi: 10.1021/ja028212e. [DOI] [PubMed] [Google Scholar]
- 160.Petrov A, Okhonin V, Berezovski M, Krylov SN. Kinetic capillary electrophoresis (KCE): a conceptual platform for kinetic homogeneous affinity methods. J Am Chem Soc. 2005;127:17104–17110. doi: 10.1021/ja056232l. [DOI] [PubMed] [Google Scholar]
- 161.Krylov SN. Kinetic capillary electrophoresis for selection, characterization, and analytical utilization of aptamers. In: Mascini M, editor. Aptamers in Bioanalysis. Wiley; New York: 2009. pp. 183–212. [Google Scholar]
- 162.Krylov SN. Nonequilibrium capillary electrophoresis of equilibrium mixtures (NECEEM): a novel method for biomolecular screening. J Biomol Screen. 2006;11:115–122. doi: 10.1177/1087057105284339. [DOI] [PubMed] [Google Scholar]
- 163.Krylova SM, Musheev M, Nutiu R, Li Y, Lee G, Krylov SN. Tau protein binds single-stranded DNA sequence specifically – the proof obtained in vitro with non-equilibrium capillary electrophoresis of equilibrium mixtures. FEBS Lett. 2005;579:1371–1375. doi: 10.1016/j.febslet.2005.01.032. [DOI] [PubMed] [Google Scholar]
- 164.Krylova SM, Dove PM, Kanoatov M, Krylov SN. Slow-dissociation and slow-recombination assumptions in nonequilibrium capillary electrophoresis of equilibrium mixtures. Anal Chem. 2011;83:7582–7585. doi: 10.1021/ac2018876. [DOI] [PubMed] [Google Scholar]
- 165.Okhonin V, Petrov AP, Berezovski M, Krylov SN. Plug-plug kinetic capillary electrophoresis: method for direct determination of rate constants of complex formation and dissociation. Anal Chem. 2006;78:4803–4810. doi: 10.1021/ac060108i. [DOI] [PubMed] [Google Scholar]
- 166.Yang P, Whelan RJ, Jameson EE, Kurzer JH, Argetsinger LS, Carter-Su C, Kabir A, Malik A, Kennedy RT. Capillary electrophoresis and fluorescence anisotropy for quantitative analysis of peptide-protein interactions using JAK2 and SH2-Bβ as a model system. Anal Chem. 2005;77:2482–2489. doi: 10.1021/ac048307u. [DOI] [PubMed] [Google Scholar]
- 167.Bao J, Krylova SM, Reinstein O, Johnson PE, Krylov SN. Label-free solution-based kinetic study of aptamer-small molecule interactions by kinetic capillary electrophoresis with UV detection revealing how kinetics control equilibrium. Anal Chem. 2011;83:8387–8390. doi: 10.1021/ac2026699. [DOI] [PubMed] [Google Scholar]
- 168.Bao J, Krylova SM, Wilson DJ, Reinstein O, Johnson PE, Krylov SN. Kinetic capillary electrophoresis with mass-spectrometry detection (KCE-MS) facilitates label-free solution-based kinetic analysis of protein-small molecule binding. Chem Bio Chem. 2011;12:2551–2554. doi: 10.1002/cbic.201100617. [DOI] [PubMed] [Google Scholar]
- 169.Berezovski M, Drabovich A, Krylova SM, Musheev M, Okhonin V, Petrov A, Krylov SN. Nonequilibrium capillary electrophoresis of equilibrium mixture: a universal tool for development of aptamers. J Am Chem Soc. 2005;127:3165–3171. doi: 10.1021/ja042394q. [DOI] [PubMed] [Google Scholar]
- 170.Berezovski M, Krylov SN. Thermochemistry of protein-DNA interaction studied by temperature-controlled nonequilibrium capillary electrophoresis of equilibrium mixture. Anal Chem. 2005;77:1526–1529. doi: 10.1021/ac048577c. [DOI] [PubMed] [Google Scholar]
- 171.Drabovich AP, Berezovski M, Okhonin V, Krylov SN. Selection of smart aptamers by methods of kinetic capillary electrophoresis. Anal Chem. 2006;78:3171–3178. doi: 10.1021/ac060144h. [DOI] [PubMed] [Google Scholar]
- 172.Okhonin V, Berezovski M, Krylov SN. Sweeping capillary electrophoresis: a non-stopped-flow method for measuring biomolecular rate constant of complex formation between protein and DNA. J Am Chem Soc. 2004;126:7166–7167. doi: 10.1021/ja0481124. [DOI] [PubMed] [Google Scholar]
- 173.Moser AC, Hage DS. Capillary electrophoresis-based immunoassays: principles and quantitative applications. Electrophoresis. 2008;29:3279–3295. doi: 10.1002/elps.200700871. [DOI] [PMC free article] [PubMed] [Google Scholar]
- 174.de Jong S, Epelbaum N, Llyanage R, Krylov SN. A semipermanent coating for preventing protein adsorption at physiological pH in kinetic capillary electrophoresis. Electrophoresis. 2012;33:2584–2590. doi: 10.1002/elps.201200153. [DOI] [PubMed] [Google Scholar]