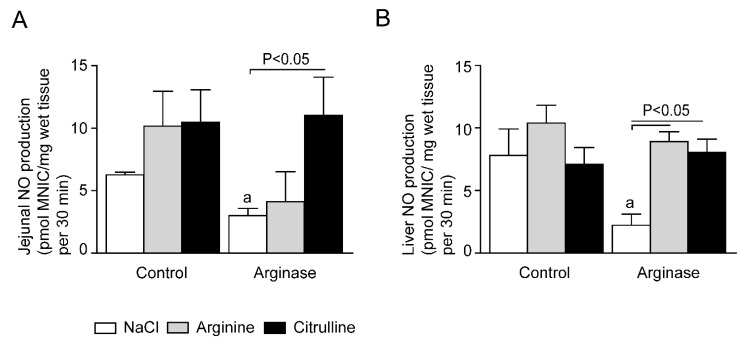
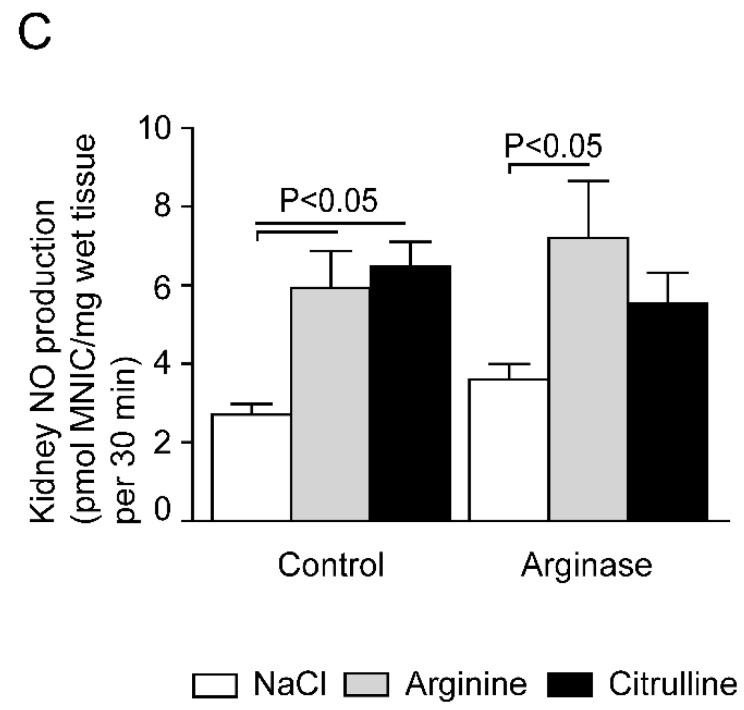
Figure 8.
Tissue NO production in control and arginase-treated animals with l-arginine or l-citrulline supplementation. (A) The expected arginase-induced decrease in jejunal NO production, determined as pmol mono-nitrosyl iron complex (MNIC)/mg wet tissue, was not present in the arginase + l-citrulline-treated group, whereas in the l-arginine-treated group, the NO production was not enhanced. (B) l-citrulline and l-arginine supplementation both resulted in an enhanced NO production in the liver of arginase-treated animals. (C) Arginase infusion did not decrease the renal NO production compared to control treated animals. l-arginine supplementation significantly increased renal NO concentration in arginase-treated animals, while l-citrulline only tended to increase the NO levels. Significance: a p < 0.05 vs. control; b p < 0.05 vs. arginine; c p < 0.05 vs. arginine + arginase; d p < 0.05 vs. citrulline + arginase.


