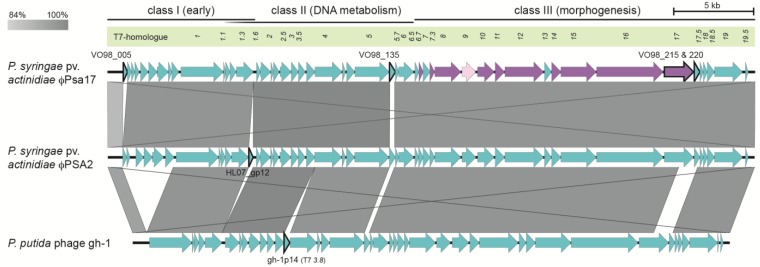
Figure 3.
Genome comparison of P. syringae pv. actinidiae φPsa17 with φPSA2 and P. putida gh-1 phages. Pairwise phage comparisons were performed using blastn within Easyfig and the grayscale indicates genes with 84%–100% nt identity [43]. Classes of genes and their T7-homologues are provided (as shown in Figure 2). Genes present in one genome, but lacking or having lower than 84% identity in others, lack gray regions indicating identity. Genes discussed in the text are outlined in black and the locus tags provided. The conservation of terminal repeats is visible as the large crossed gray lines. Accession numbers of input genomes were; φPsa17 (KR091952), φPSA2 (NC_024362) [59] and P. putida gh-1 (NC_004665) [55].

