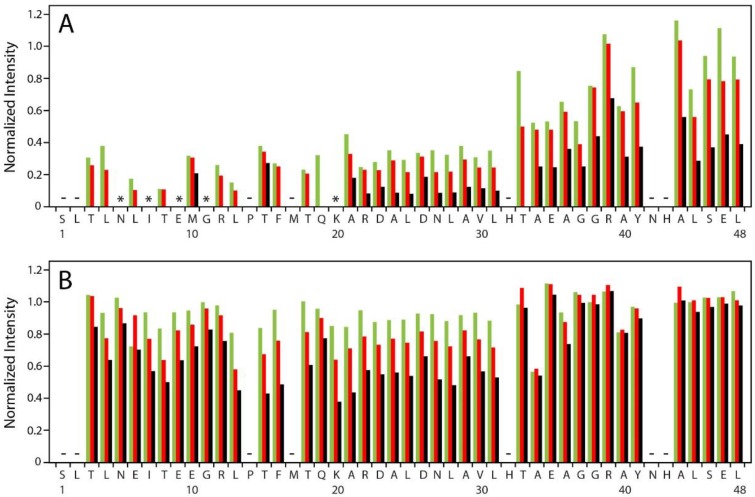
Figure 2.
Intensity of backbone amide cross peaks in HSQC spectra of NS4A(1–48) (A) and NS4A(1–48, L6E;M10E) (B) recorded at various lipid concentrations. Peak intensities measured at 2.5 (green), 5 (red) and 10 mg·mL−1 POPC (black) in the sample were normalized to the intensity of the same signal observed in lipid-free buffer and are shown as a function of the amino acid sequence of the studied peptide. Cross peaks not observed in the lipid-free sample are indicated by minus signs. Cross peaks that are present in buffer but completely disappear after addition of 2.5 mg·mL−1 POPC are indicated by asterisk.

