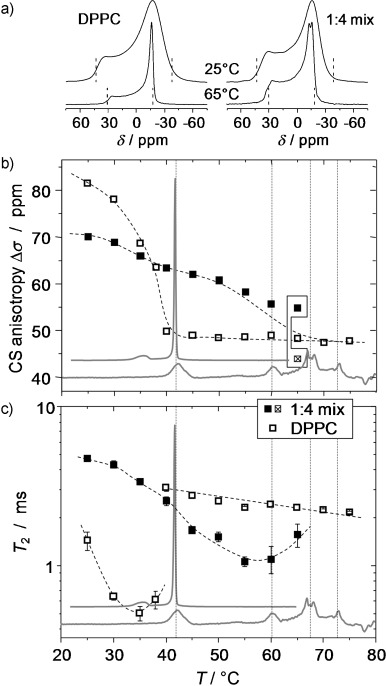
Figure 5.

31P NMR spectroscopy of a 1:4 mixture of B12 with DPPC and of pure DPPC. a) Static spectra reflecting the CSA of the 31P of DPPC in the Lα phase (47 ppm or 7.6 kHz between the dashed lines) and in the gel phase (81 ppm or 13.1 kHz) of the pure lipid (left) and corresponding data for the mixture (right). b) CSA values as a function of temperature. c) 13P T2 relaxation times evaluated at the magic-angle orientation (around δ=0 ppm in the spectra); the minimum arises from slow lipid rotations in the gel phase. The slight temperature shifts of the NMR spectroscopy data relative to the DSC traces (gray in the background) originate from weak radiofrequency-induced heating due to 1H decoupling and possible errors in the temperature calibration.
