

Significance
Platinum-based metallodrugs are the most widely used anticancer agents. Their reduced effectiveness after repeat dosing (resistance) constitutes a major clinical problem. We study a potent organo-osmium compound with improved activity over cisplatin and no cross-resistance in platinum-resistant cancers. This compound disrupts metabolism in A2780 human ovarian cancer cells, generating reactive oxygen species and damaging DNA. We identified mutations in complex I of the electron transport chain in A2780 cells and suggest that the osmium compound may exploit these mutations to exert a potent mechanism of action. Such activity increases selectivity toward cancer cells, given that normal-functioning cells can better adapt to drug-induced metabolic perturbations. Therefore, this report highlights a promising strategy to drive the future development of organometallic anticancer compounds.
Keywords: organometallic anticancer compound, cancer metabolism, mitochondria, transcriptome sequencing, protein microarrays
Abstract
The organometallic “half-sandwich” compound [Os(η6-p-cymene)(4-(2-pyridylazo)-N,N-dimethylaniline)I]PF6 is 49× more potent than the clinical drug cisplatin in the 809 cancer cell lines that we screened and is a candidate drug for cancer therapy. We investigate the mechanism of action of compound 1 in A2780 epithelial ovarian cancer cells. Whole-transcriptome sequencing identified three missense mutations in the mitochondrial genome of this cell line, coding for ND5, a subunit of complex I (NADH dehydrogenase) in the electron transport chain. ND5 is a proton pump, helping to maintain the coupling gradient in mitochondria. The identified mutations correspond to known protein variants (p.I257V, p.N447S, and p.L517P), not reported previously in epithelial ovarian cancer. Time-series RNA sequencing suggested that osmium-exposed A2780 cells undergo a metabolic shunt from glycolysis to oxidative phosphorylation, where defective machinery, associated with mutations in complex I, could enhance activity. Downstream events, measured by time-series reverse-phase protein microarrays, high-content imaging, and flow cytometry, showed a dramatic increase in mitochondrially produced reactive oxygen species (ROS) and subsequent DNA damage with up-regulation of ATM, p53, and p21 proteins. In contrast to platinum drugs, exposure to this organo-osmium compound does not cause significant apoptosis within a 72-h period, highlighting a different mechanism of action. Superoxide production in ovarian, lung, colon, breast, and prostate cancer cells exposed to three other structurally related organo-Os(II) compounds correlated with their antiproliferative activity. DNA damage caused indirectly, through selective ROS generation, may provide a more targeted approach to cancer therapy and a concept for next-generation metal-based anticancer drugs that combat platinum resistance.
Platinum (Pt) compounds are the most widely used drugs for cancer chemotherapy, including epithelial ovarian cancer (EOC). Although clinical response rates to Pt drugs can exceed 60% in late stage patients, relapse and the subsequent development of resistance leads to treatment failure and low survival rates. As such, there is much interest in the discovery of new metal-based drugs with alternative target sites and mechanisms of action (MOA) to which resistance cannot readily develop (1–6). Osmium, also a third-row transition metal, offers promise for distinct metal-based anticancer agents (7). It exhibits antiproliferative activity in a variety of oxidation states (8–10), particularly Os(II) in organometallic half-sandwich arene compounds (11). There is particular interest in Os involvement in cellular oxidative stress, potentially a multitargeted mechanism for which resistance could be harder to develop (12).
Compound 1 [Os(η6-p-cym)(NMe2-azpy)I]PF6 (Fig. 1A) exhibits higher in vitro antiproliferative activity in A2780 ovarian cancer cells, compared with cisplatin, and is equipotent in cisplatin-resistant EOC cells (13, 14). It is also highly active (EC50: 0.85–2.14 μM) in patient-derived high-grade serous ovarian cancer cells PE01 and PE04 (SI Appendix, SI Materials and Methods and Fig. S1) and in vivo in a colorectal xenograft model (15). Compound 1 was also screened in 809 cancer cell lines as part of the Sanger Institute’s Cancer Genome Project with promising results (mean GI50 0.75 μM, cf. 36.7 μM for cisplatin, SI Appendix, Fig. S2). Activity comparisons are made with cisplatin because it is the most widely used metal-based drug in the clinic. The MOA of compound 1 is not associated with activation by hydrolysis and DNA binding, but instead appears to involve redox mediation (11, 13). We use a systems biology approach to investigate the MOA of compound 1, using pathway analysis to identify the source of redox modulation. We complement whole-transcriptome sequencing with temporal proteomic (reverse-phase protein microarray) and phenotypic (high-content imaging and flow cytometry) profiling technologies to demonstrate how compound 1 may exploit mitochondrial deficiencies detected in A2780 cells.
Fig. 1.

Differential mapping of sequence reads to the mitochondrial chromosome. (A) Chemical structure of the cation in compound 1 (the anion PF6− is not shown). (B) Heat map showing chromosomal mapping of sequence reads (log10FPKM). From inside out (arrow), values are represented as the triplicate mean for each sample type: 0 h, control-exposed; 4, 12, 24, and 48 h, control- and compound-exposed. (C) Graph showing total number of reads mapped to the ChrM (FPKM) for control- and compound-exposed samples across the time series. Gray line = mean; *P < 0.05 (Welch two-sample t test).
Results
We used time-series RNA sequencing to determine differential gene expression in A2780 EOC cells in response to treatment with a low dose of compound 1. This was complemented with reverse-phase protein microarrays (RPPA) to study cellular levels of key proteins involved in DNA damage repair and flow cytometry and high-content imaging to investigate activation of oxidative stress [production of reactive oxygen species (ROS)] and apoptosis.
RNA Sequencing and Mitochondrial DNA Mutations.
To study the global effect of compound 1, A2780 EOC cells were exposed to a GI50 concentration (150 nM), over 48 h. At 0, 4, 12, 24, and 48 h; whole-cell RNA was sequenced for both control- and compound 1-exposed cells with ∼30 million 50-bp paired-end reads generated per sample (SI Appendix, Tables S1 and S2). Sequence reads were mapped to the hg19 (GRCh37) human genome (ArrayExpress accession E-MTAB-2758).
Mutations in mitochondrial DNA (mtDNA) are well documented in cancer cells (16). Therefore, before exploring differential gene expression, we investigated mitochondrial chromosome (ChrM) sequence reads in A2780 cells. This highlighted multiple mtDNA mutations in all samples, with ≥99% homology in ∼1,200–2,000 counts. The MT-ND5 gene, coding for the ND5 membrane-bound subunit of complex I (CI) in the electron transport chain (ETC), had three missense mutations at positions m.13106A > G, m.13677A > G, and m.13887T > C (SI Appendix, Fig. S3). These mutations translate to amino acid substitutions at p.I257V (isoleucine > valine), p.N447S (aspargine > serine), and p.L517P (leucine > proline). p.I257V (dbSNP variant rs2853501), p.N447S, and p.L517P are known variants of ND5; however, they have not been reported in ovarian cancer (17). The ND5 subunit is responsible for proton pumping from the matrix to the intermembrane space of the mitochondria; therefore, mutations in CI machinery may impact cellular respiration. Point mutations in CI machinery have been found in breast, colon, prostate, thyroid, and EOC; however, most reported mutations focus on the D-loop of ChrM (18–22).
Differential Sequence Mapping to the Mitochondrial Chromosome.
We explored the differential sequence mapping across the time series. Fig. 1B shows a heat map of the mean number of reads mapped to chromosomes 1−22, X, and M for each sample type: control at 0 h and control and compound 1-exposed at 4, 12, 24, and 48 h. The mean read counts for each sample type are represented as log10FPKM (fragments per kilobase per million reads). The log10FPKM values for mapping to ChrM were significantly higher than those of the other chromosomes, a result of copy-number variations and length bias because ChrM is much shorter than the other chromosomes (∼16,600 bp).
However, Fig. 1C and SI Appendix, Fig. S4, show a significant differential mapping to ChrM between control- (blue) and compound 1-exposed (green) samples. This is particularly evident at 12 and 24 h, where there are significantly more reads mapped in compound 1-exposed versus control samples (P = 0.030 and 0.016, respectively), suggesting that compound 1 induces a mitochondrial response.
Differential Gene Expression and Pathway Analysis.
We investigated the cell-wide effects of compound 1 by studying differential gene expression (DE) across a 48-h RNAseq time course. We found significant DE after just 4 h exposure, with the largest number of differentially expressed genes (DEG) at 48 h (SI Appendix, Fig. S5). Pathway analysis with Ingenuity Pathway Analysis software used an extensive literature database (Ingenuity Knowledge Base) to integrate biological and chemical pathway perturbation information (www.ingenuity.com/products/ipa). Of the 20,713 DEGs, 14,384 were mapped, and at each time point we examined the downstream canonical pathways activated/inhibited.
Oxidative Stress.
Some of the most prominently activated pathways were in response to oxidative stress. Genes associated with a vitamin C antioxidant response (P value 1.58 × 10⁻³ at 24 h, hypergeometic test) and an NRF2 (nuclear factor erythroid-derived 2-like 2) oxidative stress response (P value 3.74 × 10⁻¹⁷ at 4 h) were activated.
The NRF2 transcription factor (encoded by the EFE2L2 gene) is involved in an important antioxidant response pathway, binding to the hARE (human antioxidant response element) cis-element to transactivate detoxifying/antioxidant genes. The AP-1 complexes C-FOS/C-JUN and FRA-1/c-JUN, encoded by FOS, FOSL1, and JUN genes, compete with NRF2 for binding to hARE to activate antioxidant genes (23).
Fig. 2A shows some of the components of this oxidative response pathway with transactivation of eight response genes. Upon detection of ROS, NRF2 dissociates from actin and KEAP1, translocates to the nucleus, and interacts with cofactor proteins (e.g., MAF) to bind to hARE. Fig. 2B shows the DEG (FDR ≤ 0.10) of components in this pathway.
Fig. 2.
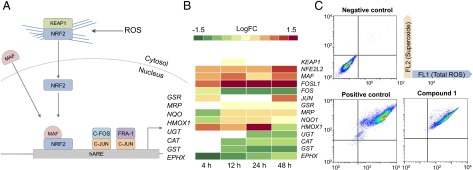
NRF2- and AP-1–mediated oxidative stress response in A2780 cells. (A) Diagram showing the differentially expressed genes at each time point in the NRF2 oxidative stress response pathway from the transcriptome analysis. (B) The DEG of each biological component [as fold change (FC), FDR < 0.10] is split into expression values at 4, 12, 24, and 48 h, from left to right. (C) Flow cytometry measurements of ROS after A2780 cells were exposed to 150 nM of compound 1 for 24 h.
NRF2 (NFE2L2) and one of its cofactors, MAF (MAF), were up-regulated at 4 h and remained so throughout the time series, showing a maximum level of DE at 48 h (logFC 1.57, FDR 1.17 × 10⁻¹⁷ and LogFC 1.18, FDR 2.57 × 10⁻¹⁹, respectively). Of the two AP-1 complexes, only FRA-1 is up-regulated throughout the time series, showing significant DE after 4 h (LogFC 1.51, FDR 1.54 × 10⁻¹⁰). C-FOS (FOS), which is part of the second AP-1 complex, is significantly down-regulated after 12 h (LogFC −0.73, FDR 4.08 × 10⁻³), suggesting that this AP-1 complex does not play a role in compound 1-induced oxidative stress response (23).
Fig. 2B shows that only a selection of antioxidant genes downstream of the transcriptional activators are up-regulated. Detoxification genes UGT (UDP-glucuronosyl transferase) and GST (GST) and antioxidant genes CAT (catalase) and EPHX (epoxide hydrolase) were all down-regulated in response to compound 1. This may suggest that the C-FOS/C-JUN AP-1 complex controls activation of these genes and not NRF2 nor FRA-1/C-JUN.
GSR (glutathione reductase), MRPs (multidrug resistance-associated proteins), and NQO [NADP(H) quinone oxidoreductase] were up-regulated after 12 h, highlighting the delay between transcription/translation of NRF2 and AP-1. Although these genes are activated after 12 h, they remain expressed at low levels, even after 48 h.
We confirmed production of ROS in A2780 cells exposed to compound 1 by flow cytometry (Fig. 2C and SI Appendix, Table S4). Fig. 2C shows ROS measurements after exposure to 150 nM of compound 1 for 24 h. The FL1 channel detected total ROS, including peroxides, peroxynitrites, and hydroxyl radicals, and the FL2 channel superoxide levels. SI Appendix, Table S4, lists the percentages of cells populating each quadrant. Fig. 2C shows that compound 1 induces approximately the same level of ROS as the positive control (pyocyanin), with 95% of the cell population in the FL1+/FL2+ quadrant after exposure to compound 1. This highlights the poor antioxidant response in A2780 cells after 24 h, especially given that NFE2L2, FOSL1, and C-JUN were all up-regulated after 4 h and continued to increase up to 48 h.
We hypothesized that the induction of superoxide might be directly correlated to the antiproliferative activity of compound 1. To confirm this, we measured the production of ROS and superoxide in A2780 cells exposed to three other Os(II) compounds structurally related to compound 1, but with a wide range of antiproliferative activities: compound 2 ([Os(η6-p-cym)(azpy)Cl]PF6; IC50 >100 μM), compound 3 ([Os(η6-bip)(Cl-azpy)Cl]PF6; IC50 >100 μM) and compound 4 ([Os(η6-p-cym)(OH-impy)I]PF6; IC50= 30 ± 2 μM) (SI Appendix, Fig. S6 and Table S5). We also compared compound 1 with the less active compound 4 in five different cell lines of ovarian, lung (A549), colon (HCT116), breast (MCF7), and prostate (PC3) origin (SI Appendix, Fig. S7 and Table S6). In all cases, the level of superoxide induced correlated with the observed antiproliferative activity, further highlighting ROS production as an important aspect of the MOA in this series of Os(II) compounds. Importantly, the activity of these compounds is linked to superoxide concentration and less to the other ROS. This further supports the involvement of the mitochondria, which are responsible for the majority of superoxide production inside cells.
Mitochondrial Dysfunction.
We previously showed that compound 1 perturbs the polarization of the mitochondrial membrane after just 4 h of exposure (24). Here, in addition to the regulation of antioxidant pathways, compound 1 also differentially regulated genes related to mitochondrial dysfunction (P = 7.78 × 10⁻¹⁵ at 4 h). SI Appendix, Fig. S8, shows the DEG (FDR ≤ 0.10) of nuclear-encoded mitochondrial genes. There is an increase in DE through the time series, with a large number of DEGs at 48 h, in contrast to the mitochondria-encoded genes with maximum DE at 24 h (Fig. 1B).
Up-regulation of SNCA (α-synuclein), MAOA (monoamine oxidase), and UCP2 (mitochondrial uncoupling protein 2) supports mitochondria-specific ROS production. SNCA is primarily located in the cytoplasm, but can localize in mitochondria and be involved in controlling mitochondrial morphology and cell death (25). MAOA is found in the outer mitochondrial membrane and produces H2O2 from deamination of dietary amines (26). It is generally implicated in Parkinson’s disease; however, recent studies show an overlap with cancer (27). Significant up-regulation of MAOA, particularly at 48 h, highlights a route to H2O2 production by the mitochondria, detected in Fig. 2C. UCP2 is found on the inner mitochondrial membrane and is responsible for detoxification of mitochondrial superoxide (O2·−) produced in the matrix by increasing the influx of protons and reducing electron leakage (28). Up-regulation of UCP2 has been shown during drug-induced oxidative stress, and when functional, can drastically reduce the levels of mitochondrial O2·−. The continual up-regulation of this gene (SI Appendix, Fig. S8) could suggest that this protein cannot control the excess levels of O2·−. SI Appendix, Fig. S8, also shows down-regulation of nuclear-encoded mitochondrial genes, particularly OGDH (2-oxoglutarate dehydrogenase) and GPX8 (glutathione peroxidase 8). GPX8 is another antioxidant protein, which catalyzes the reaction of glutathione with H2O2 as a detoxification step. GPX8 was down-regulated after 12 h, suggesting that H2O2 detoxification is disrupted.
The mitochondrion is the major source of superoxide production in the cell, particularly from CI. Superoxide dismutase (SOD) normally converts superoxide to water and hydrogen peroxide, which is then broken down by catalase (CAT) to water and oxygen. Our analysis showed that, even with detection of ROS, neither CAT nor SOD genes were up-regulated after exposure to compound 1 (Fig. 2B). In fact, CAT was expressed at higher levels in control samples, highlighting the oxidatively stressed nature of A2780 cells and that no response to H2O2 was mobilized after exposure to compound 1. Generally, both the antioxidant and detoxifying systems work in synergy to remove damaging ROS in cells. The down-regulation of key response genes suggests that compound 1 both induces ROS production and reduces the ability of A2780 cells to respond to excessive ROS.
DNA Damage Response.
We studied the downstream effects of oxidative stress and ROS production, given that ROS can target many biological components within the cell, including DNA. Zeptosens RPPAs were used to study the cellular levels of key proteins involved in DNA damage repair (DDR) in compound 1-exposed cells versus controls (29). RPPA measures the abundance of total protein levels and phosphorylated proteins using epitope-specific fluorescently tagged antibodies (SI Appendix, Table S3). Fluorescence measurements for each protein were normalized to a house-keeping protein in each sample (prohibitin) before the ratios of fluorescence between compound 1-exposed and control samples were determined (4, 24, 48, and 72 h), to quantify relative fluorescence intensity (RFI) values relative to vehicle (DMSO) control.
Fig. 3A describes the location of RPPA-measured proteins in DDR pathways, where components with an asterisk (*) represent phosphorylated proteins (SI Appendix, Table S3) (30). Fig. 3B shows RFI values for proteins in Fig. 3A; for RFI < 1, protein levels were lower in compound 1-exposed cells versus the control; for RFI = 1, levels did not change; and for RFI > 1, protein levels increased. The RFI values for p21* and ATM* were not measured at 72 h.
Fig. 3.

Induction of DNA damage in A2780 cells. (A) Diagram of protein interactions controlling DNA damage and cell cycle progression. (B) Heat map showing the proteins as relative fluorescence intensity (RFI) detected by RPPA, normalized to the house-keeping protein prohibitin and to the control.
During cellular response to DNA damage, ATM, among other proteins, is mobilized and auto-phosphorylated to ATM*, which in turn phosphorylates CHK2 to CHK2*. At this point, the response pathway branches into a rapid response via CDC25A and a delayed response via p53 and p21. Fig. 3B shows that compound 1 causes a significant up-regulation of ATM*, p53*, and p21* between 24 and 48 h, highlighting the detection of DNA damage.
Cell Death Mechanisms.
Activation of p53 is commonly linked to induction of apoptosis. ROS and the p21 protein have also been implicated in activating apoptosis, both of which increased in response to compound 1 (Figs. 2C and 3B) (31).
We investigated the activation of apoptosis by compound 1, using DEGs, RPPA, and flow cytometry. Fig. 4A is a heat map for the DEGs related to apoptotic cell death. Caspases associated with apoptosis include caspase-3, -7, and -9 as downstream markers and caspase-8 as an upstream marker of extrinsic apoptosis (SI Appendix, Fig. S9). Fig. 4A shows significant down-regulation of CASP-9 after 4 h, CASP-6, -2, and -9 after 12 h, and CASP-3 and -7 after 48 h. Genes encoding inhibitors of apoptosis (IAP) proteins, which inhibit the activation of caspase proteins, like BIRC2 and BIRC3, were up-regulated after 4 h (LogFC 2.06, FDR 1.53 × 10⁻¹²). BIRC5, which encodes survivin, another IAP, was down-regulated until 24 h (LogFC −0.43, FDR 1.03 × 10⁻⁵), suggesting specific modulation of apoptotic signals through caspase inhibition.
Fig. 4.

Nonapoptotic response to compound 1 in A2780 cells. (A) Heat map showing the differential gene expression (as fold change, logFC) of apoptotic markers (FDR < 0.10) at four time points. (B) Heat map showing the differential protein levels of apoptotic markers in response to compound 1 at two doses at four time points. (C) Flow cytometry measurements for detecting apoptotic cell death: negative control (Left) and after exposure to 150 nM of compound 1 for 24 h (Right). (D) High-content microscopy images of cells exposed to 2.5 µM of compound 1 for 48 h using the NucView substrate. Green fluorescence identifies caspase 3 activation of NucView probe, with blue DAPI dye highlighting cell nuclei.
However, Fig. 4A shows up-regulation of BID [LogFC 0.90 (48 h), FDR 1.77 × 10⁻¹⁴] and BAX [LogFC 0.50 (24 h), FDR 3.46 × 10⁻⁶], which both code for apoptotic initiators, BID from extrinsic activation and BAX from intrinsic activation. This suggests that apoptotic signals are activated in response to compound 1, but that these signals do not translate through to expression of effector caspases. The only caspase genes up-regulated were CASP-1 and CASP-12, inflammatory caspases, that were activated by IL-1β. This is likely controlled by the high levels of IAP proteins at 24 and 48 h that disrupt the caspase cascade and inhibit apoptosis.
We measured the levels of 18 apoptotic proteins by RPPA over 72 h (Fig. 4B) at concentrations of 150 and 450 nM of compound 1. Fig. 4B shows the RFI values for 13 proapoptotic markers and 5 prosurvival markers (SI Appendix, Table S3). At both concentrations, nearly all of the apoptotic markers were down-regulated, both pro- and anti-apoptotic. However, caspase-3 (CASP3) and cleaved caspase-3 (CASP3*) levels increased between 24 and 48 h before dropping again at 72 h. PARP is cleaved by caspase-3* (PARP*) and showed similar levels to those of CASP3*—low at 4 and 72 h and higher at 24 and 48 h. The only significantly up-regulated proteins throughout the time series were XIAP and survivin, both inhibitors of caspase-3, -7, and -9 activation (32).
Interestingly, the genes for BID and BAX were up-regulated after 4 h (Fig. 4A), yet Fig. 4B shows minimal detection of both proteins by RPPA. The levels of BID protein fluctuate and the levels of BAX slowly increase, both at a maximum after 72 h. This again suggests that molecular mechanisms associated with apoptosis were initiated. However, the significantly high levels of caspase inhibitors ensure that, within a 72-h time frame, apoptosis is unlikely to occur. We measured the population of apoptotic A2780 cells after a 24-h exposure to 150 nM of compound 1 (Fig. 4C and SI Appendix). During early apoptosis, membrane-bound phosphatidylserine proteins, which ordinarily face into the cytoplasm, flip to face outside and allow annexin V binding. Once the cell has lost viability, its membrane becomes permeable to propidium iodide (PI), which fluoresces upon binding to DNA. In Fig. 4C, the FL1 channel measured annexin V fluorescence and the FL2 channel PI fluorescence. Early apoptotic cells should exhibit high annexin binding and low PI binding. Late apoptosis should give high annexin and high PI binding. The percentages of cells found in each quadrant are listed in SI Appendix, Table S7. Fig. 4C shows that the majority of cells were still viable and that a small percentage of nonviable cells had died through nonapoptotic mechanisms. Increasing the concentration 3× made little difference to the RPPA data for apoptotic proteins, except that BCL-2 levels were higher, suggesting a stronger initiation of apoptosis signaling.
Previously, we have shown by flow cytometry that compound 1 does not induce apoptosis in A549 lung cancer cells at 500 nM (3× concentration used here) after 24 h (24). We therefore increased the concentration of compound 1 further, to 2.5 μM, and measured the levels of caspase-3/7 after 48 h at the single-cell level by high-content microscopy. Activated caspase-3/7 cleaves NucView, a substrate that intercalates with DNA and fluoresces upon cleavage. The images in Fig. 4D show that, at higher concentrations, the proportion of cells with detectable caspase activity (green) increased and the number of cell nuclei (blue) decreased. Thus, we observe a complex dose-dependent pathway response from both pro- and anti-apoptotic proteins following exposure to compound 1. As a result, we see a temporal wave of apoptosis detected at the protein level by RPPA between 24 and 48 h and by microscopy at 48 h.
Discussion
The discovery and development of chemotherapeutic agents with new MOAs are important goals in cancer research. We are focusing on the development of organometallic compounds that may be active toward cisplatin-resistant cancers and have fewer side effects compared with the platinum drugs. We discovered through screening that compound 1 has potent antiproliferative activity in a wide range of cancer cell lines (11) (SI Appendix, Fig. S2) and is also active in vivo (12). With the move toward personalized medicine, it becomes vital to elucidate the MOA for new metal-based drugs so that treatments can be matched to the predicted response of particular cancer cells. Hence, we adopted a systems biology approach to gain insight into the activity of compound 1 (33).
Our data suggest a dual mechanism of action involving modulation of metabolic processes and an increase in the level of ROS and/or lack of control of their destruction. In addition, we have identified three mutations in CI of the respiratory chain of the A2780 EOC cells, which may contribute to the potency of compound 1.
Mitochondrial genes play an important role in drug response, and the mitochondrion is fast becoming an important target in cancer research (34). Targeting this organelle directly or indirectly provides an element of selectivity for therapeutic anticancer agents. The metabolic profile of cancer cells is often primarily glycolytic, compared with normal cells that produce ATP primarily by oxidative phosphorylation (OXPHOS), the Warburg effect (35). Glycolysis is generally less efficient for ATP production; however, it is faster than OXPHOS, permits macromolecule biosynthesis, and can function under hypoxic conditions (36). This switch from OXPHOS to glycolysis is also thought to reduce the production of ROS, often by-products of the OXPHOS pathway and potentially deadly to cellular function.
The ChrM codes for important polypeptides in components of the ETC that control the process of OXPHOS (37). The observed up-regulation of these genes in response to compound 1 suggests that cells switch on, or enhance, the use of OXPHOS. A similar effect was reported with glycolysis inhibitor 2-deoxyglucose, where treated cells responded with a shunt of metabolism into OXPHOS, increasing sensitivity to chemotherapeutic agents (38).
Point mutations in mtDNA can affect the function of OXPHOS machinery; therefore, OXPHOS is not an optimal process in cancer cell division. Such mutations are common in cancer cells and are thought to be partly responsible for favoring glycolysis (36). The three mutations in complex I of the ETC in A2780 cells might translate to impairment of the ability of mitochondria to maintain a proton gradient during OXPHOS (37). The efficiency of maintaining this coupling gradient is directly proportional to the efficiency of ATP production by the last complex in the ETC, ATPase complex V (CV), where CI accounts for 40% of the proton gradient generated in NADH oxidation (39).
We therefore propose that the induction of ROS in response to compound 1 may result from a shift in metabolism, forcing A2780 cells to use dysfunctional metabolic machinery. Some metal-based drugs are known to disrupt the redox balance in cancer cells, often through targeting ROS scavengers (40). Metal compounds themselves can catalyze ROS production when activated in the reducing environment of cancer cells (41, 42). The production of ROS by the mitochondria has a cyclic effect on their function, potentiating the production of higher and higher levels of ROS (43). Mitochondrially targeted anticancer drugs that target the bioenergetics of cancer cells and increase ROS are becoming a focus for anticancer drug development (44). ROS induced by compound 1 activate oxidative stress response pathways, which we propose are responsible for DNA damage. DNA is a well-known target for ROS, particularly guanine bases (45). Compound 1 is equipotent in Pt-resistant cancer cell lines, with ROS-centered DNA damage not repairable by enhancement of Pt-induced DDR (13).
The cytotoxic effects of cisplatin are often not selective for cancer cells and can be just as damaging to normal cells (46). DNA damage caused indirectly by compound 1, through selective ROS generation, provides an element of targeting of cancer cells through exploiting deficient mitochondria. Indeed, the antiproliferative selectivity of compound 1 for A2780 ovarian cancer cells versus normal fibroblast cells is ∼3× greater than that of cisplatin (SI Appendix, Table S8). Compound 1 therefore appears to exploit the metabolic deficiencies in cancer cells, probably potentiated by the effects of mutations in the component proteins of the ETC of the EOC cell line used in this work. Our findings should stimulate future work to investigate the functional implications of these mutations.
Hanif and coworkers reviewed the promising activity of osmium-based anticancer compounds, highlighting their potential as ROS inducers, DNA binders, and protein kinase inhibitors (7). Our work has revealed the rapid timescale of ROS production in ovarian cancer cells and the consequent switch-on of antioxidant response pathways, together with downstream DNA damage and initiation of apoptosis (24 and 48 h).
Our use of transcriptomics, proteomics, and imaging provides a promising approach for obtaining insights into the cellular MOA of metal-based antiproliferative compounds. RNA sequencing and RPPA have rarely been used in such studies, possibly because of the complexity of data analysis and interpretation. Mitochondrial mutations such as those that we have discovered in this A2780 cancer cell line are well documented in various cancer types, but, as far as we are aware, have not been explored in ovarian cancer. Our work therefore not only provides unique insights into both the potency and selectivity of compound 1, but also opens up new pathways for future research.
Conclusions
The organometallic half-sandwich Os(II) arene compound 1 is a promising candidate for cancer treatment, being highly active toward a range of cancer cells in vitro and showing promising activity in vivo (11, 15). Our combined transcriptomic and proteomic studies show that it has a different mechanism of action from cisplatin. Our analysis suggests an attack on glycolysis that switches energy production toward OXPHOS in A2780 EOC cells. This pathway may already be stressed by the three mutations that we detected in the CI of the ETC. Not only does compound 1 induce ROS production, but it also reduces the ability of cells to respond to excessive ROS, subsequently leading to downstream DNA damage.
The chemical behavior of compound 1 differs significantly from cisplatin in that it does not readily undergo hydrolysis or bind to glutathione or guanine (DNA, RNA). The possibility that there are unusual mechanisms for its activation inside cells that would allow it to attack components of the glycolytic pathway requires further investigation. Such activity by a metallodrug, involving mitochondria that are partly dysfunctional in cancer cells, may not only combat cancer cell drug resistance, but also provide selectivity for cancer cells versus normal cells, properties that are likely to be valuable in next-generation anticancer drugs.
Materials and Methods
RNA Sequencing.
Full details are in SI Appendix. Briefly, A2780 cells were seeded at 3 × 10⁶ and incubated in drug-free medium for 24 h. Compound 1 (150 nM) and vehicle control solutions were added and after 4, 12, 24, and 48 h, cells were collected and whole-cell RNA was extracted (RNeasy plus mini kit, Qiagen). Samples were quality-control–checked using a NanoDrop1000 spectrophotometer and an Agilent 2100 Bioanalyzer. Truseq libraries were prepared and samples were sequenced on an Illumina HiSeq2000 with 50-bp paired-end reads and ∼30 million paired-end reads per sample. Reads were mapped to hg19 using Tophat2, and HTSeq and edgeR were used for differential expression analysis.
Reverse-Phase Protein Arrays.
Full details are in SI Appendix (47). Briefly, A2780 cells were seeded at 4 × 10⁵ and incubated in drug-free medium for 48 h. Compound 1 (150 and 450 nM) and vehicle control solutions were added, and after 4, 24, 48, and 72 h cells were collected and protein extracts were obtained. Normalized cell lysates were deposited onto microarray chips (ZeptoChip, Zeptosens-Bayer), and chips were blocked and washed. Chips were incubated for 24 h with primary antibodies (SI Appendix, Table S3), followed by 2.5 h incubation with secondary Alexa-Fluor647-conjugated antibody detection reagent. Arrays were imaged using ZeptoREADER and analyzed using ZeptoView 3.1 software.
High-Content Imaging.
A2780 cells were seeded in a 96-well plate at 5,000 cells/well and incubated for 48 h before treatment with compound 1 or vehicle control for another 48 h. Before image acquisition, cells were incubated with 4 μg/mL DAPI (Sigma D8417) and 1 mM NucView (Biotium) reagent for 30 min. Microscopic images of DAPI- and NucView-stained cells were acquired with a 10× objective and appropriate optical filters using an Olympus ScanR high-content imaging microscope. Merged images of DAPI and NucView cells were created using the Olympus ScanR imaging software Cell-IR.
Supplementary Material
Acknowledgments
We thank Professor David Wild and Dr. Jonathan Moore for helpful discussions. We thank the Biotechnology and Biological Sciences Research Council (Grant 324594, Systems Biology studentship for J.M.H.), the European Research Council (Grants 247450 and 324594), and the Wellcome Trust (Grants 086357 and 102696) for support, as well as the European Union COST Action CM1105.
Footnotes
The authors declare no conflict of interest.
This article is a PNAS Direct Submission.
Data deposition: The sequences reported in this paper have been deposited in ArrayExpress (accession E-MTAB-2758).
This article contains supporting information online at www.pnas.org/lookup/suppl/doi:10.1073/pnas.1500925112/-/DCSupplemental.
References
- 1.Barry NPE, Sadler PJ. Exploration of the medical periodic table: Towards new targets. Chem Commun (Camb) 2013;49(45):5106–5131. doi: 10.1039/c3cc41143e. [DOI] [PubMed] [Google Scholar]
- 2.Frezza M, et al. Novel metals and metal complexes as platforms for cancer therapy. Curr Pharm Des. 2010;16(16):1813–1825. doi: 10.2174/138161210791209009. [DOI] [PMC free article] [PubMed] [Google Scholar]
- 3.Komeda S, Casini A. Next-generation anticancer metallodrugs. Curr Top Med Chem. 2012;12(3):219–235. doi: 10.2174/156802612799078964. [DOI] [PubMed] [Google Scholar]
- 4.Muhammad N, Guo Z. Metal-based anticancer chemotherapeutic agents. Curr Opin Chem Biol. 2014;19:144–153. doi: 10.1016/j.cbpa.2014.02.003. [DOI] [PubMed] [Google Scholar]
- 5.Patra M, Gasser G. Organometallic compounds: An opportunity for chemical biology? ChemBioChem. 2012;13(9):1232–1252. doi: 10.1002/cbic.201200159. [DOI] [PubMed] [Google Scholar]
- 6.Gasser G, Ott I, Metzler-Nolte N. Organometallic anticancer compounds. J Med Chem. 2011;54(1):3–25. doi: 10.1021/jm100020w. [DOI] [PMC free article] [PubMed] [Google Scholar]
- 7.Hanif M, Babak MV, Hartinger CG. Development of anticancer agents: Wizardry with osmium. Drug Discov Today. 2014;19(10):1640–1648. doi: 10.1016/j.drudis.2014.06.016. [DOI] [PubMed] [Google Scholar]
- 8.Suntharalingam K, et al. Bidentate ligands on osmium(VI) nitrido complexes control intracellular targeting and cell death pathways. J Am Chem Soc. 2013;135(38):14060–14063. doi: 10.1021/ja4075375. [DOI] [PMC free article] [PubMed] [Google Scholar]
- 9.Maillet A, Yadav S, Loo YL, Sachaphibulkij K, Pervaiz S. A novel Osmium-based compound targets the mitochondria and triggers ROS-dependent apoptosis in colon carcinoma. Cell Death Dis. 2013;4(6):e653. doi: 10.1038/cddis.2013.185. [DOI] [PMC free article] [PubMed] [Google Scholar]
- 10.Ni W-X, et al. Osmium(VI) complexes as a new class of potential anti-cancer agents. Chem Commun (Camb) 2011;47(7):2140–2142. doi: 10.1039/c0cc04515b. [DOI] [PubMed] [Google Scholar]
- 11.Fu Y, et al. Structure-activity relationships for organometallic osmium arene phenylazopyridine complexes with potent anticancer activity. Dalton Trans. 2011;40(40):10553–10562. doi: 10.1039/c1dt10937e. [DOI] [PubMed] [Google Scholar]
- 12.Romero-Canelón I, Sadler PJ. Next-generation metal anticancer complexes: Multitargeting via redox modulation. Inorg Chem. 2013;52(21):12276–12291. doi: 10.1021/ic400835n. [DOI] [PubMed] [Google Scholar]
- 13.Fu Y, et al. Organometallic osmium arene complexes with potent cancer cell cytotoxicity. J Med Chem. 2010;53(22):8192–8196. doi: 10.1021/jm100560f. [DOI] [PubMed] [Google Scholar]
- 14.Fu Y, et al. The contrasting chemical reactivity of potent isoelectronic iminopyridine and azopyridine osmium(II) arene anticancer complexes. Chem Sci. 2012;3(8):2485–2494. [Google Scholar]
- 15.Shnyder SD, et al. Anti-colorectal cancer activity of an organometallic osmium arene azopyridine complex. Med Chem Comm. 2011;2(7):666–668. [Google Scholar]
- 16.Chatterjee A, Mambo E, Sidransky D. Mitochondrial DNA mutations in human cancer. Oncogene. 2006;25(34):4663–4674. doi: 10.1038/sj.onc.1209604. [DOI] [PubMed] [Google Scholar]
- 17.Calvo SE, et al. High-throughput, pooled sequencing identifies mutations in NUBPL and FOXRED1 in human complex I deficiency. Nat Genet. 2010;42(10):851–858. doi: 10.1038/ng.659. [DOI] [PMC free article] [PubMed] [Google Scholar]
- 18.Parrella P, et al. Detection of mitochondrial DNA mutations in primary breast cancer and fine-needle aspirates. Cancer Res. 2001;61(20):7623–7626. [PubMed] [Google Scholar]
- 19.Larman TC, et al. Cancer Genome Atlas Research Network Spectrum of somatic mitochondrial mutations in five cancers. Proc Natl Acad Sci USA. 2012;109(35):14087–14091. doi: 10.1073/pnas.1211502109. [DOI] [PMC free article] [PubMed] [Google Scholar]
- 20.Guerra F, et al. Mitochondrial DNA mutation in serous ovarian cancer: Implications for mitochondria-coded genes in chemoresistance. J Clin Oncol. 2012;30(36):e373–e378. doi: 10.1200/JCO.2012.43.5933. [DOI] [PubMed] [Google Scholar]
- 21.Aikhionbare FO, et al. mtDNA sequence variants in subtypes of epithelial ovarian cancer stages in relation to ethnic and age difference. Diagn Pathol. 2008;3:32–43. doi: 10.1186/1746-1596-3-32. [DOI] [PMC free article] [PubMed] [Google Scholar]
- 22.Van Trappen PO, et al. Somatic mitochondrial DNA mutations in primary and metastatic ovarian cancer. Gynecol Oncol. 2007;104(1):129–133. doi: 10.1016/j.ygyno.2006.07.010. [DOI] [PubMed] [Google Scholar]
- 23.Katoh Y, et al. Two domains of Nrf2 cooperatively bind CBP, a CREB binding protein, and synergistically activate transcription. Genes Cells. 2001;6(10):857–868. doi: 10.1046/j.1365-2443.2001.00469.x. [DOI] [PubMed] [Google Scholar]
- 24.van Rijt SH, Romero-Canelón I, Fu Y, Shnyder SD, Sadler PJ. Potent organometallic osmium compounds induce mitochondria-mediated apoptosis and S-phase cell cycle arrest in A549 non-small cell lung cancer cells. Metallomics. 2014;6(5):1014–1022. doi: 10.1039/c4mt00034j. [DOI] [PubMed] [Google Scholar]
- 25.Zhu M, Li W, Lu C. Role of alpha-synuclein protein levels in mitochondrial morphology and cell survival in cell lines. PLoS ONE. 2012;7(4):e36377. doi: 10.1371/journal.pone.0036377. [DOI] [PMC free article] [PubMed] [Google Scholar]
- 26.Menazza S, et al. Oxidative stress by monoamine oxidases is causally involved in myofiber damage in muscular dystrophy. Hum Mol Genet. 2010;19(21):4207–4215. doi: 10.1093/hmg/ddq339. [DOI] [PubMed] [Google Scholar]
- 27.Devine MJ, Plun-Favreau H, Wood NW. Parkinson’s disease and cancer: Two wars, one front. Nat Rev Cancer. 2011;11(11):812–823. doi: 10.1038/nrc3150. [DOI] [PubMed] [Google Scholar]
- 28.Dalla Pozza E, et al. Role of mitochondrial uncoupling protein 2 in cancer cell resistance to gemcitabine. Biochim Biophys Acta. 2012;1823(10):1856–1863. doi: 10.1016/j.bbamcr.2012.06.007. [DOI] [PubMed] [Google Scholar]
- 29.Pawlak M, et al. Zeptosens’ protein microarrays: A novel high performance microarray platform for low abundance protein analysis. Proteomics. 2002;2(4):383–393. doi: 10.1002/1615-9861(200204)2:4<383::AID-PROT383>3.0.CO;2-E. [DOI] [PubMed] [Google Scholar]
- 30.Ashwell S, Zabludoff S. DNA damage detection and repair pathways: Recent advances with inhibitors of checkpoint kinases in cancer therapy. Clin Cancer Res. 2008;14(13):4032–4037. doi: 10.1158/1078-0432.CCR-07-5138. [DOI] [PubMed] [Google Scholar]
- 31.Masgras I, et al. Reactive oxygen species and mitochondrial sensitivity to oxidative stress determine induction of cancer cell death by p21. J Biol Chem. 2012;287(13):9845–9854. doi: 10.1074/jbc.M111.250357. [DOI] [PMC free article] [PubMed] [Google Scholar]
- 32.Flanagan L, et al. XIAP impairs Smac release from the mitochondria during apoptosis. Cell Death Dis. 2010;1:e49. doi: 10.1038/cddis.2010.26. [DOI] [PMC free article] [PubMed] [Google Scholar]
- 33.Spreckelmeyer S, Orvig C, Casini A. Cellular transport mechanisms of cytotoxic metallodrugs: An overview beyond cisplatin. Molecules. 2014;19(10):15584–15610. doi: 10.3390/molecules191015584. [DOI] [PMC free article] [PubMed] [Google Scholar]
- 34.Fulda S, Kroemer G. Mitochondria as therapeutic targets for the treatment of malignant disease. Antioxid Redox Signal. 2011;15(12):2937–2949. doi: 10.1089/ars.2011.4078. [DOI] [PubMed] [Google Scholar]
- 35.Ward PS, Thompson CB. Metabolic reprogramming: A cancer hallmark even warburg did not anticipate. Cancer Cell. 2012;21(3):297–308. doi: 10.1016/j.ccr.2012.02.014. [DOI] [PMC free article] [PubMed] [Google Scholar]
- 36.Zheng J. Energy metabolism of cancer: Glycolysis versus oxidative phosphorylation (Review) Oncol Lett. 2012;4(6):1151–1157. doi: 10.3892/ol.2012.928. [DOI] [PMC free article] [PubMed] [Google Scholar]
- 37.Rich PR, Maréchal A. The mitochondrial respiratory chain. Essays Biochem. 2010;47:1–23. doi: 10.1042/bse0470001. [DOI] [PubMed] [Google Scholar]
- 38.Palorini R, Simonetto T, Cirulli C, Chiaradonna F. Mitochondrial complex I inhibitors and forced oxidative phosphorylation synergize in inducing cancer cell death. Int J Cell Biol. 2013;2013:243876. doi: 10.1155/2013/243876. [DOI] [PMC free article] [PubMed] [Google Scholar]
- 39.Hinchliffe P, Sazanov LA. Organization of iron-sulfur clusters in respiratory complex I. Science. 2005;309(5735):771–774. doi: 10.1126/science.1113988. [DOI] [PubMed] [Google Scholar]
- 40.Jungwirth U, et al. Anticancer activity of metal complexes: Involvement of redox processes. Antioxid Redox Signal. 2011;15(4):1085–1127. doi: 10.1089/ars.2010.3663. [DOI] [PMC free article] [PubMed] [Google Scholar]
- 41.Graf N, Lippard SJ. Redox activation of metal-based prodrugs as a strategy for drug delivery. Adv Drug Deliv Rev. 2012;64(11):993–1004. doi: 10.1016/j.addr.2012.01.007. [DOI] [PMC free article] [PubMed] [Google Scholar]
- 42.Kovacic P, Somanathan R. Recent developments in the mechanism of anticancer agents based on electron transfer, reactive oxygen species and oxidative stress. Anticancer Agents Med Chem. 2011;11(7):658–668. doi: 10.2174/187152011796817691. [DOI] [PubMed] [Google Scholar]
- 43.Henchcliffe C, Beal MF. Mitochondrial biology and oxidative stress in Parkinson disease pathogenesis. Nat Clin Pract Neurol. 2008;4(11):600–609. doi: 10.1038/ncpneuro0924. [DOI] [PubMed] [Google Scholar]
- 44.Neuzil J, Dong LF, Rohlena J, Truksa J, Ralph SJ. Classification of mitocans, anti-cancer drugs acting on mitochondria. Mitochondrion. 2013;13(3):199–208. doi: 10.1016/j.mito.2012.07.112. [DOI] [PubMed] [Google Scholar]
- 45.Jena NR. DNA damage by reactive species: Mechanisms, mutation and repair. J Biosci. 2012;37(3):503–517. doi: 10.1007/s12038-012-9218-2. [DOI] [PubMed] [Google Scholar]
- 46.Pabla N, Dong Z. Curtailing side effects in chemotherapy: A tale of PKCδ in cisplatin treatment. Oncotarget. 2012;3(1):107–111. doi: 10.18632/oncotarget.439. [DOI] [PMC free article] [PubMed] [Google Scholar]
- 47.van Oostrum J, et al. Tracing pathway activities with kinase inhibitors and reverse phase protein arrays. Proteomics Clin Appl. 2009;3(4):412–422. doi: 10.1002/prca.200800070. [DOI] [PubMed] [Google Scholar]
Associated Data
This section collects any data citations, data availability statements, or supplementary materials included in this article.