Significance
Humans and other animals effectively use acoustic waves to communicate with each other. Ultrasonic acoustic waves are intriguing because they do not interfere with normal voice communication and can be highly directional with long range. Therefore, wireless ultrasonic radio is a useful communications method. Here we find that graphene has mechanical properties that make it ideally suited for wide-band ultrasonic transduction. Using simple and low-cost fabrication methods we have produced an ultrasonic microphone and ultrasonic radio prototypes. When acting as loudspeaker/microphone alone, the graphene-based acoustic devices also show ideal flat-band frequency response spanning the whole audible region as well as ultrasonic region to at least 0.5 MHz; such flat frequency response has significant acoustic applications implications.
Keywords: radio, ultrasonics, graphene, microphone, bat
Abstract
We present a graphene-based wideband microphone and a related ultrasonic radio that can be used for wireless communication. It is shown that graphene-based acoustic transmitters and receivers have a wide bandwidth, from the audible region (20∼20 kHz) to the ultrasonic region (20 kHz to at least 0.5 MHz). Using the graphene-based components, we demonstrate efficient high-fidelity information transmission using an ultrasonic band centered at 0.3 MHz. The graphene-based microphone is also shown to be capable of directly receiving ultrasound signals generated by bats in the field, and the ultrasonic radio, coupled to electromagnetic (EM) radio, is shown to function as a high-accuracy rangefinder. The ultrasonic radio could serve as a useful addition to wireless communication technology where the propagation of EM waves is difficult.
Modern wireless communication is based on generating and receiving electromagnetic (EM) waves that span a wide frequency range, from hertz to terahertz, providing abundant band resources and high data transfer rates. There are drawbacks to EM communication, though, including high extinction coefficient for electrically conductive materials and antenna size. However, animals have effectively used acoustic waves for short-range communication for millions of years. Acoustic wave-based communication, while embodying reduced band resources, can overcome some of the EM difficulties and complement existing wireless technologies. For example, acoustic waves propagate well in conductive materials, and have thus been explored for underwater communication by submarines (1, 2). Marine mammals such as whales and dolphins are known to communicate effectively via acoustic waves. In land-based acoustic wave communication, the audible band is often occupied by human conversations, whereas the subsonic band can be disturbed by moving vehicles and building construction. The ultrasonic band, though having a wide frequency span and often free of disturbance, is rarely exploited for high data rate communication purposes; one possible reason for this is the lack of wide bandwidth ultrasonic generators and receivers. Conventional piezoelectric-based transducers only operate near their resonance frequencies (3, 4), preventing use in communications where wider bandwidth is essential for embedding information streams.
In a conventional acoustic transducer such as a microphone, air pressure variations from a sound wave induce motion of a suspended diaphragm; this motion is in turn converted to an electrical signal via Faraday induction (using a magnet and coil) or capacitively. The areal mass density of the diaphragm sets an upper limit on the frequency response (FR) of the microphone. In the human auditory system, the diaphragm (eardrum) is relatively thick (∼100 µm), limiting flat FR to ∼2 kHz and ultimate detection to ∼20 kHz (5, 6). In bats the eardrums are thinner, allowing them to hear reflected echolocation calls up to ∼200 kHz (7–9). Diaphragms in high-end commercial microphones can be engineered to provide flat FR from the audible region to ∼140 kHz (e.g., Bruel & Kjaer type 4138 microphone). Thinner and lighter diaphragms allow for more faithful tracking of sound vibration at high frequencies.
The ultra-low mass and high mechanical strength of graphene makes it extremely attractive for sound transduction applications (10). We have previously demonstrated an electrostatically driven graphene diaphragm loudspeaker with an equalized FR across the whole human audible region (11) (20 Hz to 20 kHz). The ultimate high-frequency cutoff of the speaker was not determined, the measurement being limited to 20 kHz by available detection equipment (indeed, as shown below, the graphene loudspeaker operates to at least 0.5 MHz). Graphene allows air damping to dominate over the diaphragm's own mass and spring constant (11) over a wide frequency range. In principle, graphene’s exceptional mechanical properties and favorable coupling to air and other media could enable wideband transducers for both sound generation and reception, core requirements for ultrasonic radio.
We here describe the successful design, construction, and operation of a wideband ultrasonic radio. A key ingredient of the radio system is an electrostatically coupled, mechanically vibrating graphene diaphragm based receiver that can be paired with the graphene-based acoustic transmitter. We find that the graphene microphone has an outstanding equalized frequency response (within 10 dB variation of perfect flat-band response) covering at least 20 Hz to 0.5 MHz (limited by characterization instrumentation), and a sensitivity sufficient to record bats echolocating in the wild. The highly efficient graphene ultrasonic transmitter/receiver radio system successfully codes, propagates, and decodes radio signals. The same radio system can be used to accurately measure distances using interference between ultrasonic and electromagnetic waves.
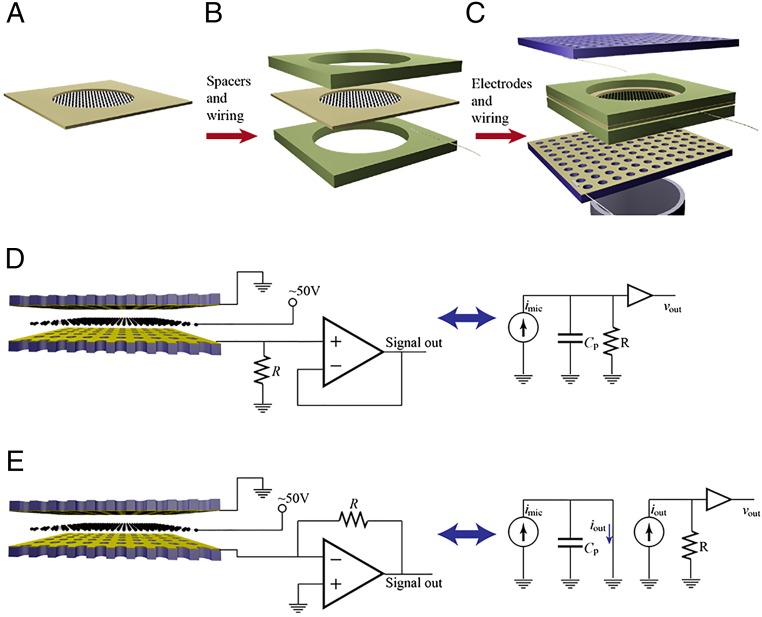
We first describe construction and operation of the graphene microphone, followed by operation of the ultrasonic radio and rangefinder. Fig. 1 illustrates the geometry and construction of the graphene receiver. Briefly, the microphone is built from a multilayer graphene membrane (∼20 nm thick, 7 mm in diameter) suspended midway between two perforated electrodes. The external sound wave can then penetrate through the electrodes to displace the graphene membrane, thereby changing the capacitance between the graphene and electrodes and causing charge redistribution and electrical current. The geometry is motivated by the graphene electrostatic loudspeaker (11), with an improved fabrication process described in SI Text. Fig. 1 D and E illustrates the operation principles of the microphone and presents competing circuits for signal extraction. Conventionally (12) (Fig. 1D), a large resistor R restricts the current flow and lets the diaphragm operate in constant charge mode, which converts the displacement of the diaphragm into voltage signal (a related circuit is presented in reference) (13). However, this circuit presents difficulties at higher frequencies because of parasitic capacitance present in the electrical wiring between the microphone and amplifier. We adopt a transimpedance amplification circuit similar to one used in fast photodiode signal detection (14) (Fig. 1E) to provide a flat band circuit response from 0 to ∼0.5 MHz. The current sensing circuit measures the velocity of the vibrating diaphragm, allowing us to reduce the membrane tension and operate the microphone in overdamped region to acquire wider frequency response (see SI Text for detailed operation theory).
Fig. 1.
Construction of graphene electrostatic wideband receiver (microphone). The graphene membrane is suspended across the supporting frame (A). The membrane is electrically contacted with gold wires, and spacers are added (B) to control the distance from the membrane to the gold-coated stationary electrodes (C). Operation principles: the microphone can be modeled as a current source imic. The conventional circuit (D) is not suitable for high-frequency operation because parasitic capacitance Cp is in parallel with the current–voltage conversion resistor R. The fast-photodiode detector-like circuit (E) avoids charging Cp and maintains a consistent gain at higher frequencies.
To determine the frequency response of the graphene microphone, we measured the microphone using a free-field method (15). In brief, we first sweep the frequency on a commercial loudspeaker and measure the response of a commercial microphone to obtain the frequency response FR1(f), then the commercial microphone is replaced with the graphene microphone and the measurement is repeated to get FR2(f). The FR of the graphene microphone is acquired by taking the difference between the two measurements. This differential measurement method eliminates the responses of the loudspeaker, coupling, and driving/amplification circuits. Commercial microphones typically have a relatively flat frequency response within their operating range, and therefore this measurement provides a reasonable representation of the graphene microphone.
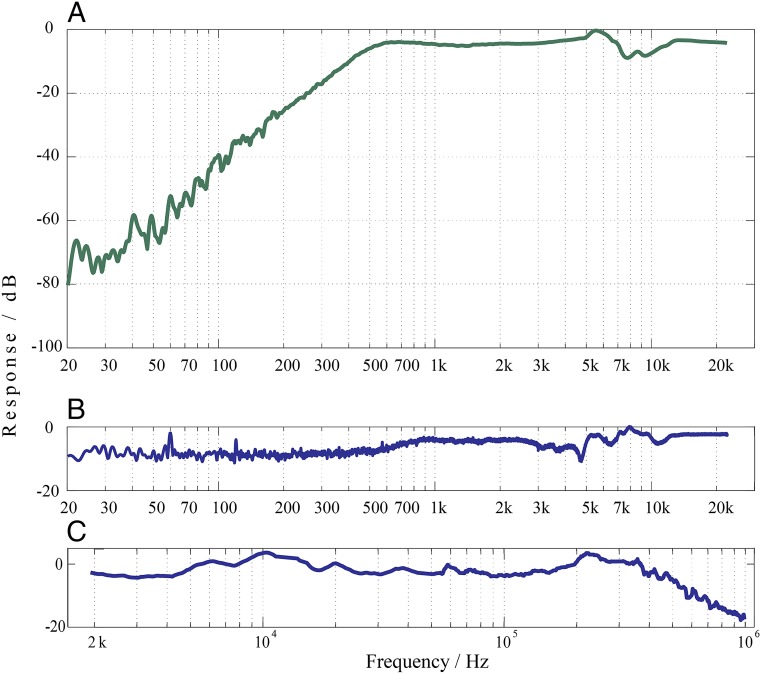
Fig. 2A shows the frequency response of the graphene microphone in the audible region (20 Hz to 20 kHz), referenced to a commercial condenser microphone (Sony ICD-SX700). Here, 0 dB corresponds to a response of 3.3 nA/Pa generated from the graphene membrane. A computer sound card-based system with software Room EQ Wizard is used in collecting the data. The graphene microphone is contained in a Faraday cage made of copper mesh. Although in Fig. 2A the data are relatively flat above 500 Hz, there is a strong drop-off in response at lower frequencies (approaching ∼60 dB per decade). This drop-off originates from the back-to-front cancelation mentioned previously, and becomes prominent when increasing wavelength allows sound to diffract around the microphone. Importantly, this decay is not intrinsic to the graphene diaphragm itself, and the response can be improved with proper acoustic design. We find that an improved low-frequency response can readily be achieved by attaching an acoustic cavity to one side of the microphone electrodes. As shown in Fig. 2B, by simple acoustic engineering we eliminate low-frequency interference and the graphene microphone now exhibits an intrinsic flat (<10 dB variation) frequency response across the whole audible region.
Fig. 2.
Measured frequency response of graphene acoustic transmitter and receiver. A and B are measured in reference to Sony ICD-SX700 in audible region. Zero decibels corresponds to a response of 3.3 nA/Pa. (A) Without an acoustic cavity, the frequency response suffers from interference at lower frequencies when measuring far-field sound waves. (B) Graphene microphone exhibits rather equalized frequency response with near-field coupling and proper acoustic design. (C) Response including ultrasonic region, measured with identical pair technique (main text and SI Text). The response fall-off beyond 0.5M Hz is not intrinsic to the acoustic device, but rather reflects limitations of the operational amplifier used in the detection circuit.
Due to the small areal mass density of the thin graphene diaphragm, the graphene microphone is expected to be responsive to frequencies well beyond the human hearing limit. However, measuring the frequency response in the ultrasonic region presents difficulties, mainly due to the lack of wideband reference microphones or loudspeakers in this region. As mentioned, piezoelectric ultrasonic transducers readily operate in the megahertz region, but only at their resonance frequency. We therefore use a wideband electrostatic graphene loudspeaker as the sonic transmitter and the electrostatic graphene microphone as the receiver. By measuring the total response with varying coupling between them, we are able to isolate the response of one single transmitter/receiver (see SI Text for details).
Fig. 2C illustrates the measured frequency response of the graphene microphone (a network analyzer, model HP3577A, is used for the measurement because the frequencies exceed the limits of a conventional computer sound card). The response appears to be relatively flat (within 10 dB) until ∼0.5 MHz. We note that the measured maximum frequency of flat FR is only limited by the electronic amplification circuit, and can be extended using higher bandwidth operational amplifiers or with different detection methods such as optical detection (16, 17). Combining this result with the low-frequency measurements (Fig. 2B), we conclude that the graphene transmitter/receiver pair has intrinsic equalized frequency response (with variation less than 10 dB) from 20 Hz to at least 0.5 MHz, ideal for ultrasonic radio operation.
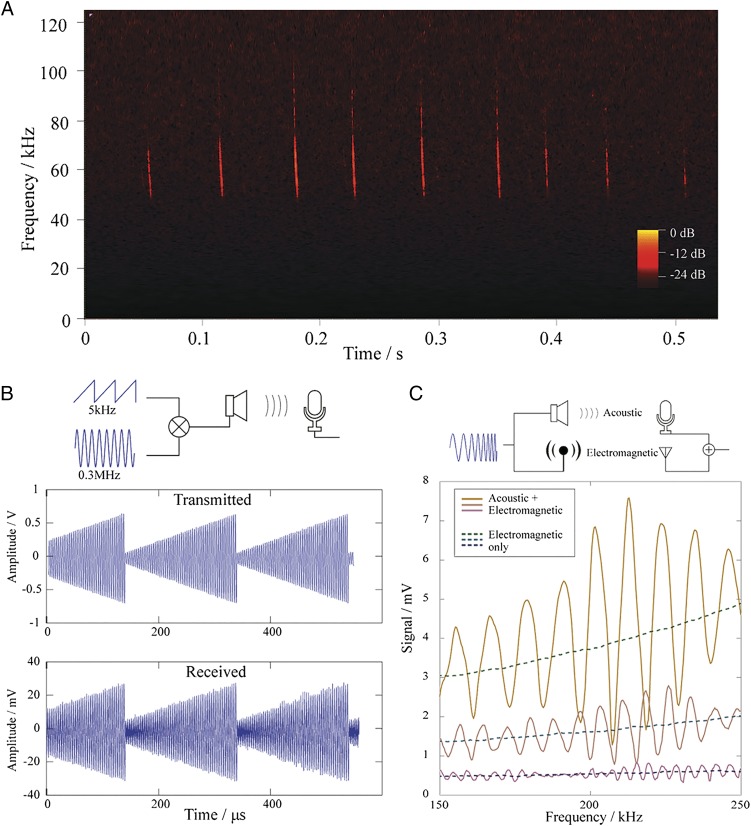
As an initial ultrasonic field test of the graphene receiver, we record ultrasonic bat calls. Bats often use echolocation to navigate and forage in total darkness. Bat call frequencies range from as low as 11 kHz to as high as 212 kHz, depending on the species (8, 9). Fig. 3A shows results from ultrasonic bat sound signals (bat calls) acquired in the field using the graphene electrostatic microphone at Del Valle Regional Park, Livermore, CA, where the bat species western pipistrelle (Parastrellus hesperus) is prevalent. The spectrogram of Fig. 3A shows that these bat calls consist of periodic chirps during which the emitted frequency consistently ramps down in frequency from ∼100 kHz to ∼50 kHz. The duration of each chirp is ∼4 ms, and the repeating period is ∼50 ms. It is believed that bats use the frequency-sweeping technique to distinguish multiple targets, improve measurement accuracy, and avoid interference from each other (8, 18, 19). A direct recording (amplitude vs. time) of the bat calls is included in SI Text (slowed by a factor of 8 to bring the signal into the human hearing range). The bat frequency sweeping or chirping represents a form of ultrasonic FM radio transmission, and its successful recording demonstrates the effectiveness of the graphene microphone as an ultrasonic radio receiver.
Fig. 3.
Applications of wideband ultrasonic graphene acoustic transducers. (A) Spectrogram of bat calls (Parastrellus hesperus) recorded in the field at a local park. During each 4-ms-wide emission chirp, the frequency ramps down from ∼100 to ∼50 kHz. The time between chirps ranges from 30 to 50 ms. (B) The transmission and reception of AM acoustic signals. The wideband acoustic radio well-preserves the sharp edges of the sawtooth envelope. (C) A way of measuring distance by frequency sweeping. The oscillation comes from the interference between the signals picked up from acoustic waves and electromagnetic waves, and the distance between the speaker and microphone is derived to be equal to the speed of sound divided by the pitch between the peaks.
We now pair the ultrasonic graphene transmitter with the ultrasonic graphene receiver to realize a complete ultrasonic radio system. To avoid any possible EM radiation influences, both the transmitter and the receiver are placed inside Faraday cages where EM communication is not possible. We first modulate an electronic 0.3-MHz carrier sine wave with a 5-kHz sawtooth wave [90% amplitude modulation (AM)]. The mixed signal is monitored by an oscilloscope (Fig. 3B, Upper). The electrical signal is sent to the graphene loudspeaker, which transmits the ultrasonic signal into air. The frequencies after mixing are well above the human hearing limit and so inaudible. Fig. 3B, Lower, shows the ultrasonic signal detected and reconverted to an electrical signal by the graphene microphone. The received signal accurately replicates the transmitted one, and information is transmitted with high fidelity. We note that the sharp sawtooth modulation expands the single delta-function-like peak of the sine wave in the frequency domain to a much wider peak, so the wideband property of the graphene acoustic radio is essential to preserve the shape of the sawtooth (i.e., coded information). Narrowband piezoelectric ultrasonic transducers lack this essential property (SI Text). The range of the ultrasonic radio as configured with single-diaphragm transmitter and single-diaphragm receiver is of order one meter. The range can likely be substantially extended by employing diaphragm arrays and optimized drive/detection electronics.
Another use of the graphene-based ultrasonic acoustic radio is for position detection, i.e., range finding. Using ultrasonics for position detection is well established, and using the graphene transmitter and receiver in a highly directional sonar-like reflection configuration (20) is certainly possible and straightforward, but not particularly novel. Here we consider a different implementation, that of electroacoustic interference. Fig. 3C illustrates a distance-measuring device that exploits interference between acoustic and EM signals. The graphene loudspeaker is configured to transmit an acoustic wave as well as an EM wave of the same frequency (a small EM antenna is added to the loudspeaker drive electronics). The graphene microphone a distance L away receives the acoustic signal along with the EM signal (again a small EM receiver antenna is added to the transducer electronics on the microphone). Because sound propagates much slower than EM waves, the sound signal picked up by the microphone diaphragm will develop a phase difference relative to the EM signal of the electronic receiver antenna. As readily seen in Fig. 3C, when a frequency sweep is performed, the interference alternates between constructive and destructive due to the change in the wavelength λ. We place the graphene speaker/microphone pair three different distances apart, at 30, 45, and 85 mm. The measured frequency sweep is shown from top to bottom in three groups in Fig. 3C. When the pair is further apart, the signal is weaker, and the frequency difference between two constructive peaks also becomes smaller; by fitting in the data (SI Text) and using a sound velocity of 344 m/s, this corresponds to a measured distance of 30.49 ± 0.22 mm, 44.92 ± 0.02 mm, and 84.94 ± 0.84 mm (the uncertainty comes from curve fitting). Submillimeter accuracy is easily achieved with this simple electroacoustic frequency sweep configuration.
In conclusion, an electrostatic graphene acoustic radio is demonstrated with ideal equalized frequency response from at least 20 Hz to 0.5 MHz. The receiver component has been independently field-tested in recording wild bat calls. Amplitude- and frequency-modulated communication is demonstrated, and an electroacoustic range-finding method is established with the ultrasonic radio having submillimeter accuracy.
SI Text
Electric Modeling of Graphene Microphone.
The electrically conducting vibrating graphene diaphragm forms a variable capacitor with the fixed electrodes, with capacitance
| [S1] |
where ε is vacuum permittivity, A is the area of the graphene membrane, and x is the distance from one of the electrodes to the graphene membrane. When the diaphragm is dc biased at V ∼50 V, charge is induced on the electrodes, described by Q = CV. The vibration of the diaphragm varies the system capacitance and induces charge variation on the electrodes, creating a current
| [S2] |
where u is the velocity of the membrane relative to the electrode. Hence, the graphene microphone can be modeled as a current source with an infinitely large internal resistance, where the current encodes the sound wave. In the thin membrane limit where the graphene diaphragm vibrates together with air, u equals the local velocity field of the air, whose amplitude U is (21)
| [S3] |
where p is the sound pressure level (SPL) and Z = 400 N∙s∙m−3 is the acoustic impedance of air. Thus, the amplitude of the microphone current source is directly proportional to the loudness of the sound, and independent of sound frequency. Using Eqs. S2 and S3 with V = 50 V, A = 25 mm2, and x = 150 µm, we find that at 40 dB SPL (approximately soft conversation at 1 m), the current amplitude is 2 pA. This level of current can only be reliably measured with careful design of the signal conditioning circuit.
High-Frequency Circuit Design for Extracting Microphone Signals.
Conventionally (12) (Fig. 1D), a large resistor R (e.g., 10 MOhm) is used to convert the current into a voltage, and the voltage signal is subsequently amplified by an operational amplifier. However, this circuit presents difficulties at higher frequencies because of parasitic capacitance in the transmission lines. As can be seen in the equivalent circuit model Fig. 1D, Right, at higher frequencies the parasitic capacitance exhibits a small impedance and reduces the voltage drop across R. For example, even 1 pF of parasitic capacitance (equivalent to ∼1 cm length of RG-58 coaxial cable) limits the circuit’s response to 1/2 πRC = 16 kHz; this may be acceptable for acoustic microphone circuits, but precludes detecting ultrasonic signals from 20 kHz into the megahertz range.
To circumvent the limitations of the conventional circuit of Fig. 1D, we adopt a current sensing circuit similar to one used in fast photodiode signal detection (14) (Fig. 1E). The operational amplifier is here configured so that the microphone electrode is directly connected to virtual ground. As a result, the parasitic capacitance in the equivalent circuit is effectively shorted, yielding iout = imic and vout = R∙iout = R∙imic. The output voltage is now directly proportional to the microphone vibration and not affected by parasitic capacitance. The circuitry of Fig. 1E is used to characterize the microphone for this report.
Microphone Operation Mechanism.
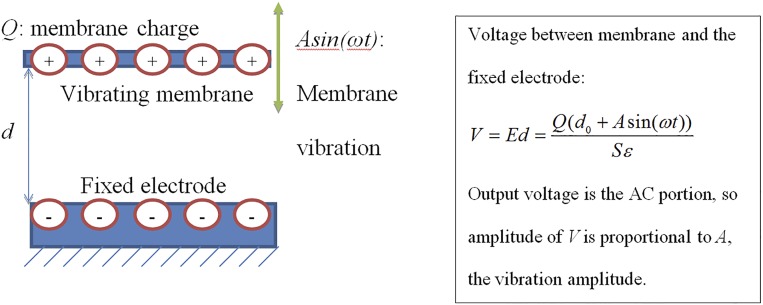
A traditional microphone measures the voltage variation of the vibrating membrane. The operation is shown in the following equation. Basically, because the membrane is connected to a very large resistor, the charge Q remains almost constant during operation. Gauss’s law gives us the voltage drop between two plates with charge Q:
where Q is the charge on membrane, d0 is the distance between membrane and the electrode at balanced position, S is the area of the membrane, Asin(ωt) is the membrane vibration displacement with amplitude A, and ε is vacuum permittivity. We see that if we measure the voltage response, the AC portion is proportional to A, the amplitude of vibration displacement.
In this case an overdamped system does not generate flat-band response. If we model the system as a harmonic oscillator, the equation is:
where m is the membrane mass, is the damping coefficient, k is the spring constant, and F is the driving force applied on the diaphragm, which equals the sound pressure SPsin(ωt). The solution of the vibration amplitude is
If the system is overdamped, the damping term will dominate over other terms, therefore resulting in, which means that the measured voltage signal will also reduce as the frequency goes up; this is the case for traditional microphone where a relatively high tension membrane is desired, so that the spring constant term k can dominate to have flat-band response.
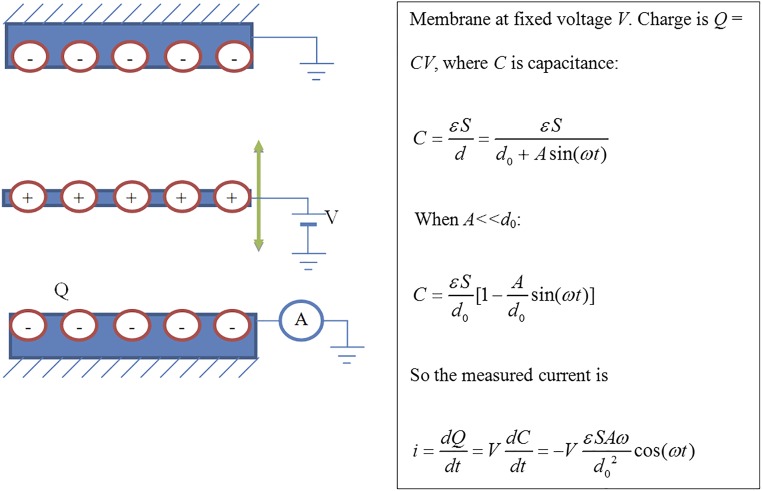
As we noted previously, our microphone uses the current sensing mechanism to support working in the high-frequency region. As shown in the following equation, our circuit measures vibration velocity instead of displacement.
The membrane is held at voltage V, so the amount of charge on the membrane is actually changing, generating a current where we extract the vibration information. The charge on the membrane or on the fixed electrode can be easily computed using a parallel plate capacitor:
The vibration amplitude is usually much smaller than the distance between the membrane and the electrode, so at A<<d0 we can Taylor expand the expression to the first order:
So the time variation of charge is the measured current:
We see here that the amplitude of the measured current is proportional to Aω. Now we return to the motion equation and find
Therefore, an overdamped system, where the damping term dominates other terms, results in a constant current amplitude, i.e., a flat-band frequency response.
Construction of Graphene Microphone.
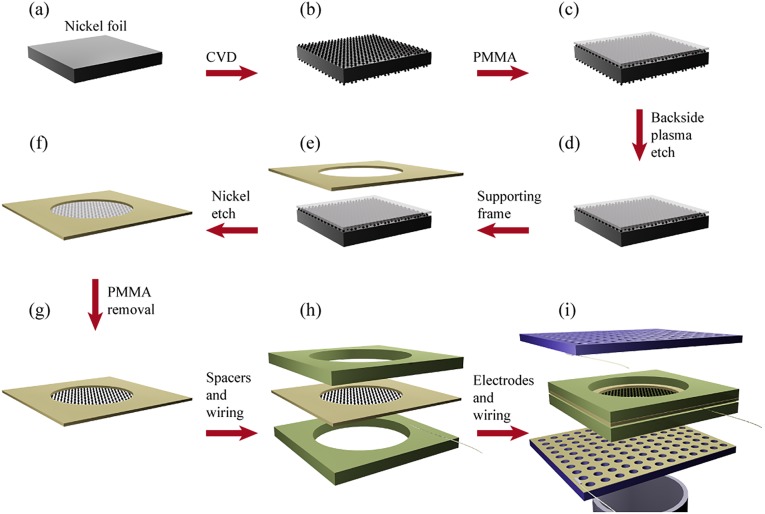
A 1-cm2 piece of 25-µm-thick nickel foil is first electrochemically polished (22, 23), cleaned by deionized water, and loaded into a 25-mm-diameter quartz tube furnace (Fig. S3A). After hydrogen annealing, the graphene layers are grown by chemical vapor deposition process at 1050 °C with 50 sccm methane and 50 sccm hydrogen coflow. The growth chamber pressure is controlled at 1 Torr. The growth lasts 15 min, and the methane flow rate is increased to 200 sccm for the last 2 min to improve the stitching between graphene grains (24). The foil is then quickly cooled down to quench the graphene growth (25) (Fig. S3B). After unloading, a layer of poly(methyl methacrylate) (PMMA) is spin-coated on top of the nickel foil (Fig. S3C), and the graphene on the other side of the foil is etched away using an oxygen plasma (1 min at 100 W; Fig. S3D). A circular aperture of 8 mm diameter is created with a disk cutter on a sticky Kapton tape serving as a supporting frame. The supporting frame is then attached to the PMMA layer on the nickel foil (Fig. S3E). The nickel foil is subsequently etched away in 0.1 g/mL sodium persulfate solution (Fig. S3F). Compared with the iron chloride solution used previously (11, 25), here the etch rate is much lower (typically overnight etching is required to remove the 25-µm-thick nickel), but the resulting graphene diaphragm is very clean and free of amorphous carbon. The exposed (not covered by the supporting frame) area of the PMMA layer is then dissolved in acetone, and the graphene layer supported by the frame is cleaned twice with isopropanol and dried in air (Fig. S3G). The PMMA between the supporting frame and graphene serves as a buffer material and improves the yield to ∼100% [the PMMA-free process (11) has a typical yield of ∼30%]. The membrane is measured by light transmission (11) to be ∼20 nm thick, or 60 monolayers of graphene. A 25-µm diameter gold wire is attached to the edge of the graphene membrane for electrical contact (Fig. S3H). Finally, spacers of ∼150 µm thick are attached to both sides of the frame, followed by perforated electrodes made from silicon wafers using deep reactive ion etch. The rigid electrodes are also wired with gold wires attached by silver paste (Fig. S3I). The surfaces of the electrodes facing the graphene membrane are coated with conductive metal layers (20 nm sputtered gold) to allow ohmic contact between the gold wire and the electrodes. This gold coating is essential for eliminating any contact barrier that could block the current flow during microphone operation, because the voltage variation on the membrane is very small. We note that for loudspeaker applications, this metal coating is not necessary because large voltages are there applied.
Fig. S3.
(A–I) Fabrication process of graphene electrostatic microphone.
Fig. S1.
Operation of traditional condenser microphone, which generate signals proportional to membrane displacement.
Fig. S2.
Operation based on current sensing, signal proportional to membrane velocity.
Optionally, a waveguide or a Helmholtz acoustic cavity can be attached to the microphone assembly, modifying the FR of the microphone in the low-frequency region by altering the damping or creating/eliminating interference (21). Without these modifications, the sound pressure forces at the front and the backside of the diaphragm tend to cancel at low frequencies, resulting in diminished response.
Measurement of the Membrane Tension.
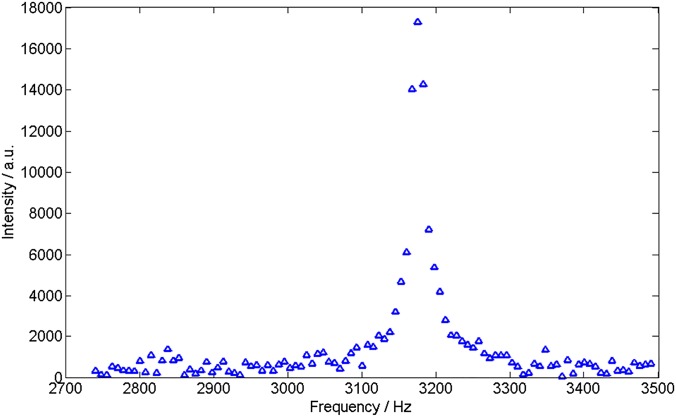
A setup similar to the one used to measure graphene resonators (16, 26) are used to measure the resonate frequency of the graphene diaphragm in vacuum. We have loaded the microphone into the optical chamber, applying a small AC voltage (1 V) upon the 50-V DC bias between the electrodes and graphene membrane as a source of actuation force. The vibration of the graphene membrane versus frequency is then measured optically by laser interference. The frequency sweep data collected by the network analyzer is presented here.
As we can see, the membrane has a resonating frequency at 3.175 kHz. Therefore, we can extract the effective spring constant of the membrane to be
We can also deduce the stress on the membrane.
The resonating frequency of a circular membrane is (27):
where D = 7 mm is the diameter, t = 20 nm is the thickness, ρ = 4.4 × 10⁻⁵ kg/m2 is the mass density, and σ is the stress. The stress of the membrane is therefore
Detailed Frequency Response Measurement Procedure.
To determine the frequency response of the graphene microphone, we first sweep the frequency on a commercial loudspeaker and measure the response of a commercial microphone to obtain the frequency response FR1(f) of the measurement system, which contains responses of individual components:
| [S4] |
where FRCM and FRCL represents the FR of the commercial microphone and commercial loudspeaker, respectively, FRC is the FR of the coupling between loudspeaker and microphone, and FRA is the FR of the driving/amplification circuits for the loudspeaker/microphone. The responses are added because they are measured on a decibel scale (logarithm of amplitude). Next the commercial microphone is replaced with the graphene microphone and the measurement is repeated:
| [S5] |
where FRGM(f) is the response of the graphene microphone. From Eqs. S4 and S5 we find
| [S6] |
The FR of the graphene microphone referenced to the commercial microphone can therefore be acquired by taking the difference between the two measurements. This differential measurement method eliminates the responses of the loudspeaker, coupling, and driving/amplification circuits. Commercial microphones typically have a relatively flat frequency response FRCM(f) within their operating range, compared with loudspeakers FRCL(f) and coupling FRC(f), and therefore this measurement provides a reasonable representation of the graphene microphone FRGM(f).
As described in the main text, acoustic wave diffraction at longer wave lengths causes interference and reduced responses. To determine the intrinsic response of the graphene diaphragm unburdened by diffraction, we choose to (i) use acoustic cavity to block the backside of the graphene microphone; and (ii) closely place an earbud sized speaker (Sennheiser CX-870) ∼3 mm away from the microphones (both commercial and graphene) to reduce diffraction. As shown in Fig. 2B, the near-field coupling largely eliminates low-frequency interference and the graphene microphone now exhibits an intrinsic flat (<10 dB variation) frequency response across the whole audible region.
Due to the small areal mass density of the thin graphene diaphragm, the graphene microphone is expected to be responsive to frequencies well beyond the human hearing limit. However, measuring the frequency response in the ultrasonic region presents difficulties, mainly due to the lack of wideband reference microphones or loudspeakers in this region. As mentioned, piezoelectric ultrasonic transducers readily operate in the megahertz region, but only at their resonance frequency. We therefore use a wideband electrostatic graphene loudspeaker as the sonic transmitter and the electrostatic graphene microphone as the receiver. The combined system frequency response is then
| [S7] |
where it has been assumed that the graphene microphone and loudspeaker have the same FR behavior. Because the coupling term FRC(f) cannot in this case be directly eliminated, we design an experiment to approximate its contribution.
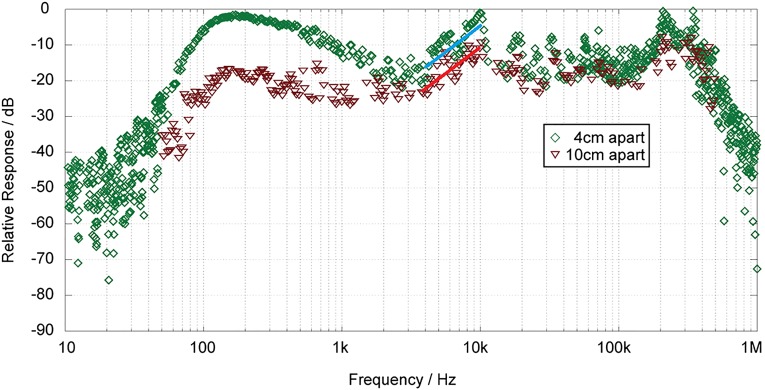
Fig. S6 illustrates the measured frequency response of the loudspeaker–microphone pair (a network analyzer, model HP3577A, is used for the measurement because the frequencies exceed the limits of a conventional computer sound card). The response appears to be relatively flat from ∼100 Hz to ∼0.5 MHz. To distinguish the contribution from the coupling term FRC(f), the distance between the loudspeaker–microphone pair is varied to change FRC(f). Two measurements are shown in Fig. S6 for the pair, 4 cm apart and 10 cm apart. The coupling mainly affects the behavior in low-frequency region (<2 kHz). In this region, the coupling of the 10-cm pair becomes increasingly weak as frequency drops compared with the 4-cm pair, which can be attributed to sound wave interference as mentioned previously. In the high-frequency region (>2 kHz), the 10-cm curve has the same form as the 4-cm curve with total intensity shifted down by ∼8 dB (see the guide to the eyes, distance between the two lines are 7.2 dB). This reduction of the total intensity is simply attributed to the inverse-square law required by energy conservation [8 dB = 6.3 in energy ratio ≃ (10 cm/4 cm)2]. We therefore assume a relatively flat FRC(f) in this region, and from Eq. S7, FRS(f) = 2 FRGM(f). The measured FRS(f) varies less than 20 dB until ∼0.5 MHz, indicating less than 10 dB variation of the graphene microphone alone. To translate this data to the ones presented in Fig. 2C, we take the response curve of 4 cm apart above 2 kHz, compress the curve by a factor of 2 (FRS(f) = 2 FRGM(f)), and do a 4-point average noise reduction. The more noisy data at higher frequency is probably due to transmitter–receiver positioning-caused interference, because we found the noise over the baseline is highly sensitive to the positioning.
Fig. S6.
Frequency response of graphene loudspeaker–microphone pair with different separations. The two solid lines are guide to eyes.
Fig. S5.
Frequency response of graphene membrane operating in vacuum.
Sawtooth-Modulated Sine Wave Transmission by Piezoelectric Transducer.
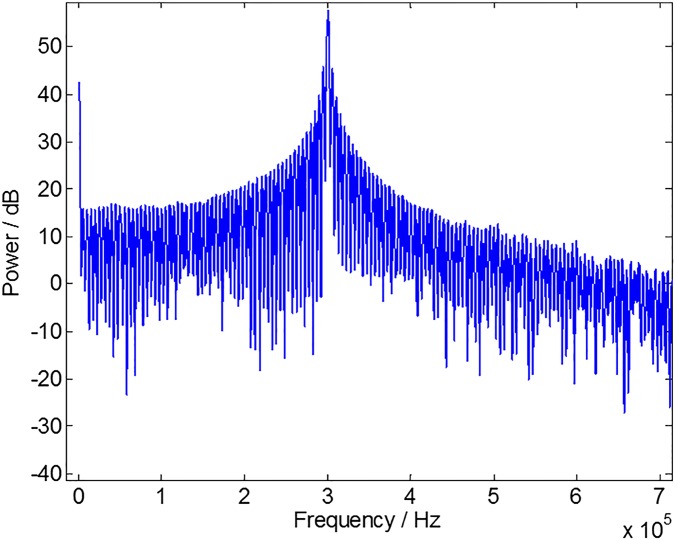
Sawtooth-modulated sine wave shown in Fig. 3B is analyzed to give the following power spectrum. As shown in Fig. S7, the spectrum spreads out from a delta-function-like peak. A typical piezoelectric transducer has a quality factor of ∼104, where Q can be estimated from its operating frequency and response time. The transducer therefore has a bandwidth of ∼30 Hz, which is too narrow to pass through all of the frequency components from sawtooth-modulated sine wave.
Fig. S7.
The power spectrum of sawtooth-modulated sine wave.
Position Detection Using Interference Method.
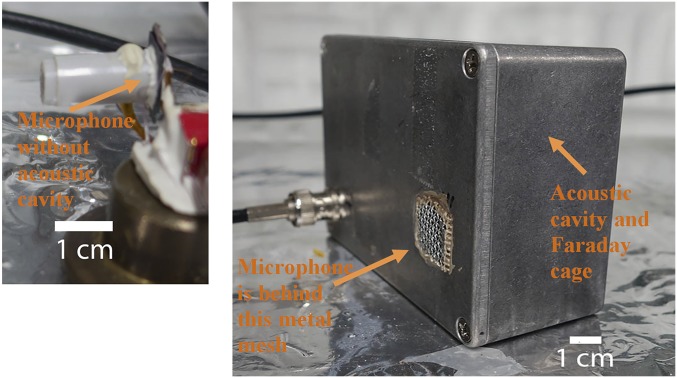
The EM antenna is intrinsic. As shown in Fig. S4, the transmitter and receiver are normally encapsulated in an acoustic cavity/Faraday cage. When the shielding is incomplete (e.g., not completely enclosed Faraday cage), the electrical feeding wires serves as EM antenna to transmit and receive EM waves. Because EM waves travel orders of magnitude faster than acoustic waves, the exact shape and location of EM antenna have very small effect on the distance measurement.
Fig. S4.
Microphone without acoustic cavity and with acoustic cavity.
As seen in Fig. 3C, when a frequency sweep is performed, the interference alternates between constructive and destructive due to the change in the wavelength λ. The condition for constructive interference is
| [S8] |
where L is the distance between the microphone and the loudspeaker, λ is the wavelength of the sound wave, and n is an integer. The nearest two constructive peaks should obey
| [S9] |
Using λ = v/f, where v is the sound velocity and f is the frequency, we obtain
| [S10] |
The distance L simply equals the sound velocity divided by the frequency difference Δf of two nearest constructive interference peak. We place the graphene speaker/microphone pair three different distances apart at 30, 45, and 85 mm. The measured frequency sweep is shown from top to bottom in three groups in Fig. 3C. When the pair is further apart, the signal is weaker, and the frequency difference between two constructive peaks also becomes smaller. By fitting in all of the peaks, we find frequency differences Δf of 11.28 ± 0.08, 7.657 ± 0.003, and 4.05 ± 0.07 kHz, respectively; using a sound velocity of 344 m/s, this corresponds to a measured distance of 30.49 ± 0.22, 44.92 ± 0.02, and 84.94 ± 0.84 mm.
Acknowledgments
This work was supported in part by the Director, Office of Energy Research, Office of Basic Energy Sciences, Materials Sciences and Engineering Division, US Department of Energy Contract DE-AC02-05CH11231, which provided for graphene growth and characterization; Office of Naval Research Grant N00014-09-1066, which provided for graphene transfer and electrode manufacture; and by National Science Foundation Grant EEC-083819, which provided for design, construction, and testing of the device.
Footnotes
The authors declare no conflict of interest.
This article is a PNAS Direct Submission. D.H. is a guest editor invited by the Editorial Board.
This article contains supporting information online at www.pnas.org/lookup/suppl/doi:10.1073/pnas.1505800112/-/DCSupplemental.
References
- 1.Kilfoyle DB, Baggeroer AB. The state of the art in underwater acoustic telemetry. IEEE J Oceanic Eng. 2000;25(1):4–27. [Google Scholar]
- 2.Proakis JG, editor. Wiley Encyclopedia of Telecommunications. Wiley; Hoboken, NJ: 2003. [Google Scholar]
- 3.Gururaja TR, et al. Piezoelectric composite materials for ultrasonic transducer applications. Part I: Resonant modes of vibration of PZT rod-polymer composites. IEEE Trans Sonics Ultrason. 1985;32(4):481–498. [Google Scholar]
- 4.Gómez Alvarez-Arenas TE. Acoustic impedance matching of piezoelectric transducers to the air. IEEE Trans Ultrason Ferroelectr Freq Control. 2004;51(5):624–633. [PubMed] [Google Scholar]
- 5.Sun Q, Gan RZ, Chang K-H, Dormer KJ. Computer-integrated finite element modeling of human middle ear. Biomech Model Mechanobiol. 2002;1(2):109–122. doi: 10.1007/s10237-002-0014-z. [DOI] [PubMed] [Google Scholar]
- 6.Prendergast PJ, Ferris P, Rice HJ, Blayney AW. Vibro-acoustic modelling of the outer and middle ear using the finite-element method. Audiol Neurootol. 1999;4(3-4):185–191. doi: 10.1159/000013839. [DOI] [PubMed] [Google Scholar]
- 7.Hill JE, Smith JD. Bats: A Natural History. Univ of Texas Press; Austin, TX: 1984. [Google Scholar]
- 8.Jones G, Holderied MW. Bat echolocation calls: Adaptation and convergent evolution. Proc Biol Sci. 2007;274(1612):905–912. doi: 10.1098/rspb.2006.0200. [DOI] [PMC free article] [PubMed] [Google Scholar]
- 9.Fenton M, Bell G. Recognition of species of insectivorous bats by their echolocation calls. J Mammal. 1981;62(2):233–243. [Google Scholar]
- 10.Lee C, Wei X, Kysar JW, Hone J. Measurement of the elastic properties and intrinsic strength of monolayer graphene. Science. 2008;321(5887):385–388. doi: 10.1126/science.1157996. [DOI] [PubMed] [Google Scholar]
- 11.Zhou Q, Zettl A. Electrostatic graphene loudspeaker. Appl Phys Lett. 2013;102(22):223109. [Google Scholar]
- 12.Eargle J. The Microphone Book. Focal Press; Oxford: 2005. [Google Scholar]
- 13. Choi HS, Hur S, Lee YH (2012) World Intellectual Property Organization Patent Appl WO2011142637A2 (February 2, 2012)
- 14.Horowitz P, Hill W. The Art of Electronics. Cambridge Univ Press; Cambridge, UK: 1989. [Google Scholar]
- 15.Zuckerwar A. Calibration of the pressure sensitivity of microphones by a free-field method at frequencies up to 80 kHz. J Acoust Soc Am. 2006;119(1):320–329. doi: 10.1121/1.2141360. [DOI] [PubMed] [Google Scholar]
- 16.Bunch JS, et al. Electromechanical resonators from graphene sheets. Science. 2007;315(5811):490–493. doi: 10.1126/science.1136836. [DOI] [PubMed] [Google Scholar]
- 17.Barton RA, et al. High, size-dependent quality factor in an array of graphene mechanical resonators. Nano Lett. 2011;11(3):1232–1236. doi: 10.1021/nl1042227. [DOI] [PubMed] [Google Scholar]
- 18.Jones G, Teeling EC. The evolution of echolocation in bats. Trends Ecol Evol. 2006;21(3):149–156. doi: 10.1016/j.tree.2006.01.001. [DOI] [PubMed] [Google Scholar]
- 19.Fenton MB, Portfors CV, Rautenbach IL, Waterman JM. Compromises: Sound frequencies used in echolocation by aerial-feeding bats. Can J Zool. 1998;76:1174–1182. [Google Scholar]
- 20.Kay L. An ultrasonic sensing probe as a mobility aid for the blind. Ultrasonics. 1964;2(2):53–59. [Google Scholar]
- 21.Temkin S. Elements of Acoustics. Wiley; New York: 1981. [Google Scholar]
- 22.Tay RY, et al. Growth of large single-crystalline two-dimensional boron nitride hexagons on electropolished copper. Nano Lett. 2014;14(2):839–846. doi: 10.1021/nl404207f. [DOI] [PubMed] [Google Scholar]
- 23.Wensch G. Electrolytic polishing of nickel. Met Prog. 1950;58:735–736. [Google Scholar]
- 24.Tsen AW, et al. Tailoring electrical transport across grain boundaries in polycrystalline graphene. Science. 2012;336(6085):1143–1146. doi: 10.1126/science.1218948. [DOI] [PubMed] [Google Scholar]
- 25.Kim KS, et al. Large-scale pattern growth of graphene films for stretchable transparent electrodes. Nature. 2009;457(7230):706–710. doi: 10.1038/nature07719. [DOI] [PubMed] [Google Scholar]
- 26.Alemán B, et al. Polymer-free, low tension graphene mechanical resonators. Phys Status Solidi Rapid Res Lett. 2013;7(12):1064–1066. [Google Scholar]
- 27.Weaver W, Timoshenko SP, Young DH. Vibration Problems in Engineering. 5th Ed Wiley; New York: 1990. [Google Scholar]


