Significance
There are few suitable laboratory models for human pigmentation disease. Neurofibromatosis type 1 (NF1) is a common neurocutaneous disease whose initial symptoms in all patients are “café-au-lait” macules and overall skin hyperpigmentation. To analyze the molecular mechanisms associated with this phenotype, we have developed an in vitro model of NF1 based on human embryonic stem cells (hESCs). Melanocytes derived from NF1 hESCs reproduced the hyperpigmentation phenotype in vitro and were characterized by deregulation of melanogenesis factors. The model allowed us to identify the cellular pathways involved in this phenotype. The hyperpigmentation phenotype could be rescued by small molecules, demonstrating the potential of pluripotent stem cells as models for pigmentation disorders.
Keywords: neurofibromatosis type 1, melanocytes, embryonic stem cells, hyperpigmentation, disease modeling
Abstract
“Café-au-lait” macules (CALMs) and overall skin hyperpigmentation are early hallmarks of neurofibromatosis type 1 (NF1). One of the most frequent monogenic diseases, NF1 has subsequently been characterized with numerous benign Schwann cell-derived tumors. It is well established that neurofibromin, the NF1 gene product, is an antioncogene that down-regulates the RAS oncogene. In contrast, the molecular mechanisms associated with alteration of skin pigmentation have remained elusive. We have reassessed this issue by differentiating human embryonic stem cells into melanocytes. In the present study, we demonstrate that NF1 melanocytes reproduce the hyperpigmentation phenotype in vitro, and further characterize the link between loss of heterozygosity and the typical CALMs that appear over the general hyperpigmentation. Molecular mechanisms associated with these pathological phenotypes correlate with an increased activity of cAMP-mediated PKA and ERK1/2 signaling pathways, leading to overexpression of the transcription factor MITF and of the melanogenic enzymes tyrosinase and dopachrome tautomerase, all major players in melanogenesis. Finally, the hyperpigmentation phenotype can be rescued using specific inhibitors of these signaling pathways. These results open avenues for deciphering the pathological mechanisms involved in pigmentation diseases, and provide a robust assay for the development of new strategies for treating these diseases.
Neurofibromatosis type 1 (NF1) is one of the most common monogenic disorders, with an estimated prevalence of approximately 1 in 3,500 individuals (1). It is characterized by a wide range of clinical expression symptoms, including skin defects associated with melanocytes, namely overall skin hyperpigmentation (2), skin-fold freckling, and “café-au-lait” macules (CALMs) (3), as well as numerous neurofibromas (benign tumors resulting from Schwann cell proliferation). Hyperpigmentation and CALMs are the initial symptoms, appearing during the first 2 years of life in all patients (4). Although the hyperpigmentation associated with CALMs is not life-threatening, it has a strong impact on quality of life (5, 6).
NF1 is caused by mutations in a tumor suppressor gene that encodes neurofibromin (7), a functional rat sarcoma (RAS)-guanosine triphosphate hydrolase (GTPase) activating protein. Neurofibromin down-regulates RAS signaling by accelerating the conversion of active RAS-guanosine triphosphate (GTP) to inactive RAS-guanosine diphosphate (GDP) (8, 9). The resulting decreased expression of neurofibromin leads to activation of several important downstream signaling pathways, including mitogen extracellular signal-regulated Kinase (MEK)/mitogen activated protein kinase (MAPK) and cyclic adenosine monophosphate (cAMP)-mediated protein kinase A (PKA) pathways (10, 11). Just how these defects in multiple signaling pathways cause the specific alterations of pigmentation originally observed in patients is not yet clear. Early histological analyses of human melanocytes retrieved from CALMs pointed to an overall increase in their number (12), in the size of pigment granules or melanosomes (13, 14), or in the cell content in melanogenic factors (15). Mouse models of the disease were difficult to generate, because homozygous Nf1−/− mice died in utero (16) and Nf1+/− mice manifested neither pigmentation abnormalities nor neurofibromas (17, 18). The hyperpigmentation phenotype has been reproduced using a specific knock-down of Nf1 in bipotential Schwann cell-melanoblast precursors (19), but molecular mechanisms linking neurofibromin to defective pathways in melanocytes have not been fully identified. The relevance of the mouse model might be questionable in any case, given that mouse melanocytes localize in hair follicles and not in the epidermis as in human melanocytes.
A significant difficulty encountered so far in the analysis of NF1 molecular mechanisms has been the lack of a reliable in vitro model of affected human melanocytes. This has changed recently with the emergence of differentiation protocols of human pluripotent stem cells into melanocytes (20, 21). A growing number of examples illustrate how such cells, retrieved from genetically selected donors carrying the causal mutation of a monogenic disorder, may reproduce disease-associated phenotypes (22–26). Thus, we used two human embryonic stem cell (hESC) lines derived from embryos characterized as mutant gene carriers for NF1 during a preimplantation diagnosis procedure, to explore mechanisms associated with hyperpigmentation in melanocytes and potential treatments for the pathological phenotype. In this study, we demonstrate the usefulness of human pluripotent stem cells in deciphering the mechanisms underlying the hyperpigmentation phenotype of NF1. At the molecular level, our results indicate that neurofibromin controls melanogenesis via cAMP-mediated PKA and extracellular signal-regulated kinase (ERK) pathways. Consequently, the decreased expression of neurofibromin in a pathological context leads to dysregulation of these pathways, resulting in hyperpigmentation. Interestingly, our cellular model has allowed us to identify small molecules capable of restoring the pathological phenotype to normal.
Results
NF1 hESCs-Derived Melanocytes Reproduced the Decreased Expression of Neurofibromin and Exhibited a Hyperproliferative Phenotype.
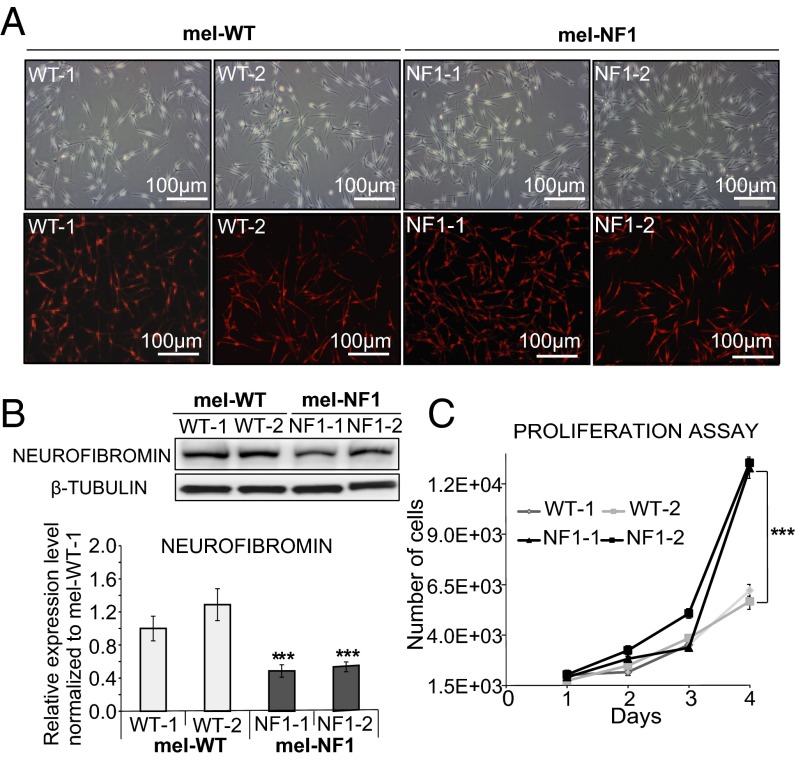
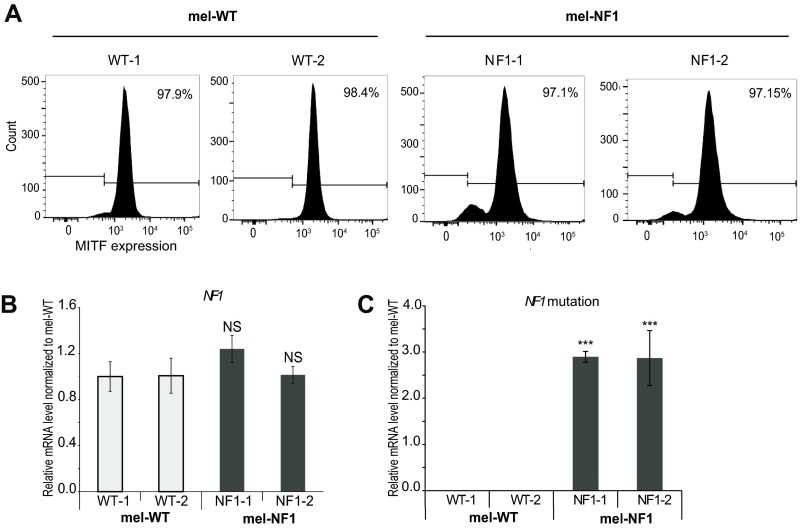
Two hESC lines, NF1-1 and NF1-2, which carry a heterozygous deletion of four nucleotides leading to a stop codon in the NF1 gene, and two control cell lines were successfully differentiated toward homogenous populations of melanocytes as described previously (20). Melanocytes derived from NF1 and WT hESCs, termed mel-NF1 (mel-NF1-1 and mel-NF1-2) and mel-WT (mel-WT-1 and mel-WT-2), showed morphology typical of melanocytes associated with expression of tyrosinase-related protein 1 (TYRP1), a melanogenic enzyme (Fig. 1A and Table S3). Flow cytometry analysis confirmed that more than 97% of mel-WT and mel-NF1 cells expressed microphthalmia-associated transcription factor (MITF), a key marker of melanocytes (Fig. S1A), suggesting that this mutation does not prevent differentiation of melanocytes.
Fig. 1.
Characterization of mel-NF1 cells derived from hESCs carrying an NF1 mutation. (A) Microscopy analysis of mel-WT and mel-NF1 cells, and immunofluorescence analysis of the melanocyte marker TYRP1 in mel-WT and mel-NF1 cells. (Scale bar: 100 μm.) (B) Western blot analysis of neurofibromin expression in mel-WT and mel-NF1 cells. β-tubulin served as a loading control. Densitometry measurement of protein levels was relative to control mel-WT-1 cells. Data are presented as mean ± SD (n = 3) normalized to the expression in WT-1 cells. (C) Automated quantification at different time points after plating of DAPI nuclear staining in mel-WT and mel-NF1 cells. Results are expressed as mean ± SD (n = 3). ***P < 0.001, ANOVA followed by Dunnett’s multiple-comparison test with WT-1.
Table S3.
Antibodies used
| Name | Species | Reference |
| NF1 | Rabbit | sc-67 (Santa Cruz Biotechnology) |
| TYRP1 | Rabbit | LS-B4011/55374 (LSBio) |
| MITF | Rabbit | ab20663 (Abcam) |
| Tyrosinase | Mouse | ab738 (Abcam) |
| TYRP2 (C-9) | Mouse | sc-74439 (Santa Cruz Biotechnology) |
| P44/42 MAPK (Erk1/2) | Rabbit | 9102 (Cell Signaling Technology) |
| Phospho-p44/42 MAPK (Erk1/2) (Thr202/Tyr204) | Rabbit | 9101 (Cell Signaling Technology) |
| Anti–β-actin peroxidase | Mouse | A3854 (Sigma-Aldrich) |
| β-tubulin, HRP conjugate | Mouse | MA5-16308-HRP (Thermo Scientific) |
| α-actinin | Mouse | A7811 (Sigma-Aldrich) |
Fig. S1.
Characterization of mel-NF1 cells. (A) Flow cytometry analysis of the melanocyte marker MITF in mel-WT-1 and WT-2 and mel-NF1-1 and NF1-2 cells. (B) qRT-PCR analysis of NF1 mRNA expression in mel-WT-1 and WT-2 and mel-NF1-1 and NF1-2 cells. qRT-PCR results are presented as fold change relative to mel-WT-1 cells after normalization against housekeeping gene 18S (n = 3). (C) Taqman qPCR of mutated probe (without four nucleotides) vs. WT probe in mel-WT-1 and WT-2 and mel-NF1-1 and NF1-2 cells. qRT-PCR results are presented as fold change relative to mel-WT-1 cells (n = 3). NS, not significant. ***P < 0.001, ANOVA followed by Dunnett’s multiple-comparison test with mel-WT-1 cells.
To determine whether the deletion of the four nucleotides in the NF1 gene affected neurofibromin expression, we analyzed mRNA and protein levels for this gene. Quantitative RT-PCR (qRT-PCR) analyses showed similar levels of NF1 mRNA (Fig. S1B and Table S1) and the presence of a mutated transcript in mel-NF1 compared with mel-WT (Fig. S1C and Table S2); however, as expected, Western blot analysis demonstrated a twofold decrease in neurofibromin protein levels relative to control (Fig. 1B).
Table S1.
Sequences of primers used for qPCR
| Gene | Sequence | |
| Forward | Reverse | |
| 18S | GAGGATGAGGTGGAACGTGT | TCTTCAGTCGCTCCAGGTCT |
| NF1 | GCACTGTACGGTCCTTGCAA | ATGGAGTGCATGAGACCACTGT |
Table S2.
Sequences of primers used for Taqman qPCR
| Gene | Sequence |
| NF1 | Forward: GCACTGTACGGTCCTTGCAA |
| Reverse: ATGGAGTGCATGAGACCACTGT | |
| Probe mutated | TCAAACTTAATGCCAACGTA |
| Probe WT | TCAAACTTACTCAATGCCA |
Because neurofibromin has a normal role in cell cycle progression (27), we investigated whether reduced expression of neurofibromin results in an alteration of cell proliferation capacity. For this purpose, we performed automated quantification of DAPI nuclei stained at different time points after plating of mel-WT and mel-NF1 cells. Mel-NF1 cells proliferated more actively by day 4 compared with mel-WT cells (Fig. 1C). Flow cytometry analysis of cell cycle progression at day 4 after EdU incorporation confirmed a greater number of replicative mel-NF1 cells at the S/G2M stage than in mel-WT cell lines (Fig. S2). Taken together, our results indicate that down-expression of neurofibromin does not interfere with the capacity of hESCs to differentiate into melanocytes; however, the protein might be involved in regulating the proliferative properties of these melanocytes.
Fig. S2.

Increased proliferation rate of mel-NF1 cells derived from hESCs carrying the NF1 mutation. Shown is a representative image of cell cycle progression after EdU incorporation in mel-WT and mel-NF1 cells by flow cytometry analysis. Annotations indicate distribution of cells in G0/G1, S, G2, and M phases (15,000 events total).
NF1 hESCs-Derived Melanocytes Phenocopied the Hyperpigmentation Phenotype Associated with NF1.
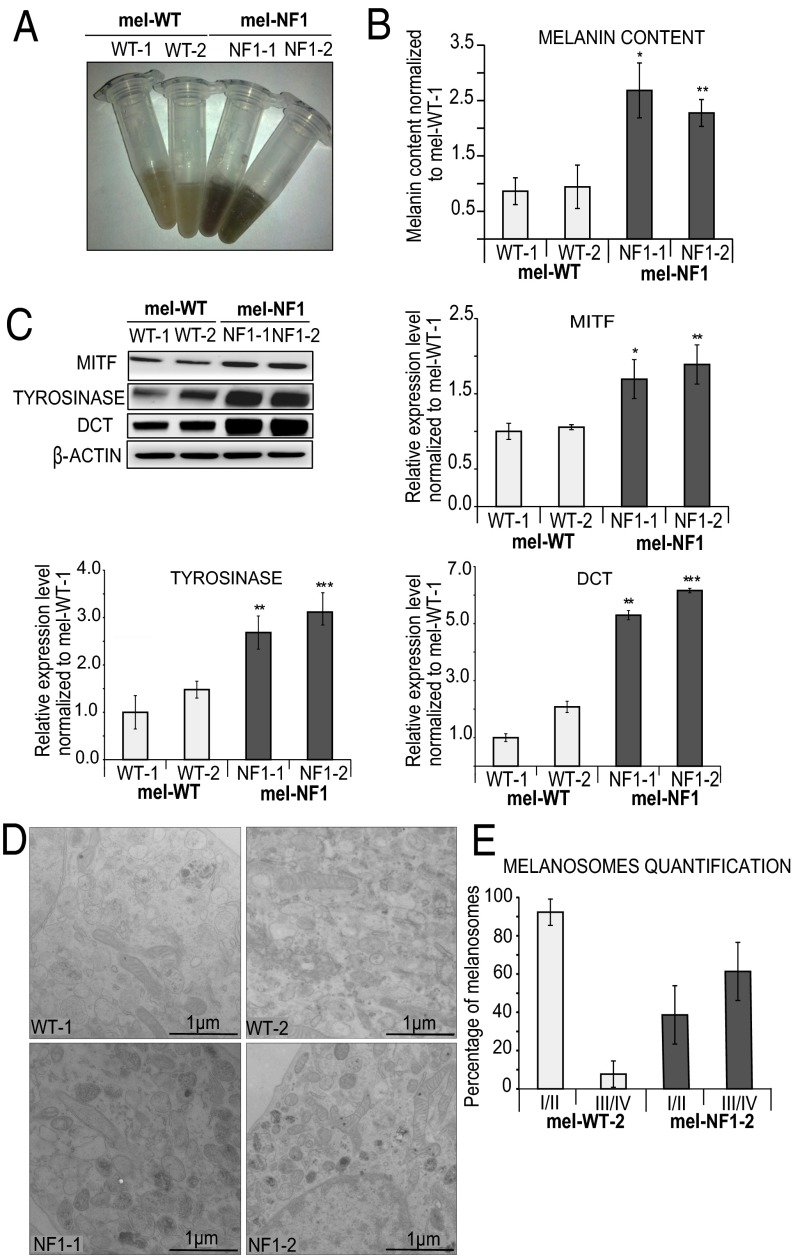
We next sought to analyze the consequences of neurofibromin down-expression on melanogenesis in hESCs-derived melanocytes. Interestingly, cell lysates from mel-NF1 were dark brown in color, whereas mel-WT lysates were much lighter, suggesting a hyperpigmentation defect analogous to that observed in patients with NF1 (Fig. 2A). To confirm this observation, we quantified melanin content by spectrophotometry. A twofold increase in intracellular melanin content was detected in mel-NF1 cells relative to control cells (Fig. 2B). Consistent with these results, Western blot analysis showed greater expression in mel-NF1 cells than in control mel-WT cells of the key transcription factor MITF and of melanogenic enzymes such as tyrosinase and dopachrome tautomerase (DCT) (Fig. 2C).
Fig. 2.
Phenotypic changes in melanocytes associated with NF1 mutation. (A) Representative cell lysates from mel-WT and mel-NF1 cells. (B) Quantification of melanin cell content by spectrophotometry in mel-WT and mel-NF1 cells. Measurements were performed using 105 cells of each cell type. Results are expressed as mean ± SD (n = 3). (C) Western blot analysis of MITF, tyrosinase, and DCT expression in mel-WT and mel-NF1 cells. β-actin served as a loading control. Densitometry measurement of protein levels is presented as mean ± SD (n = 3) normalized to the expression in WT-1 cells. (D) Representative EM images of melanosome stages in mel-WT and mel-NF1 cells. Characteristic immature unpigmented (stage I/II) and mature pigmented (stage III/IV) melanosomes are observed in the soma of melanocytes. (Scale bar: 1 µm.) (E) Quantification of melanosome maturation in mel-WT-2 and mel-NF1-2 cell lines. Data are presented as mean ± SD (n = 100 stages of melanosomes). *P < 0.05, **P < 0.01, ***P < 0.001, ANOVA followed by Dunnett’s multiple-comparison test with WT-1 cells.
Given the increased melanin content observed in mel-NF1 cells, we used electron microscopy (EM) to analyze the biogenesis and maturation of melanosomes (the pigment granules of melanocytes) at the ultrastructural level. Melanosome biogenesis occurred in two steps, corresponding to four morphologically distinct melanosomal stages. Unpigmented immature melanosomes (stages I and II) were generated, and then acquired melanin pigment in their lumens to form dark (stage III) and fully mature pigmented (stage IV) melanosomes (28). Mel-NF1 cells contained more numerous dark pigmented granules (stages III and IV) compared with mel-WT cells, suggesting that the maturation of melanosomes is increased by the NF1 mutation. Indeed, more mature melanosomes accumulated in mel-NF1 cells than in mel-WT cells (Fig. 2D). The proportion of stage III/IV melanosomes reached 60% in NF1 mutant cells, compared with 10% in WT cells (Fig. 2E). These results confirme the contribution of neurofibromin to melanogenesis in human cells, and also highlight a possible role for this protein in melanin biosynthesis and melanosome maturation.
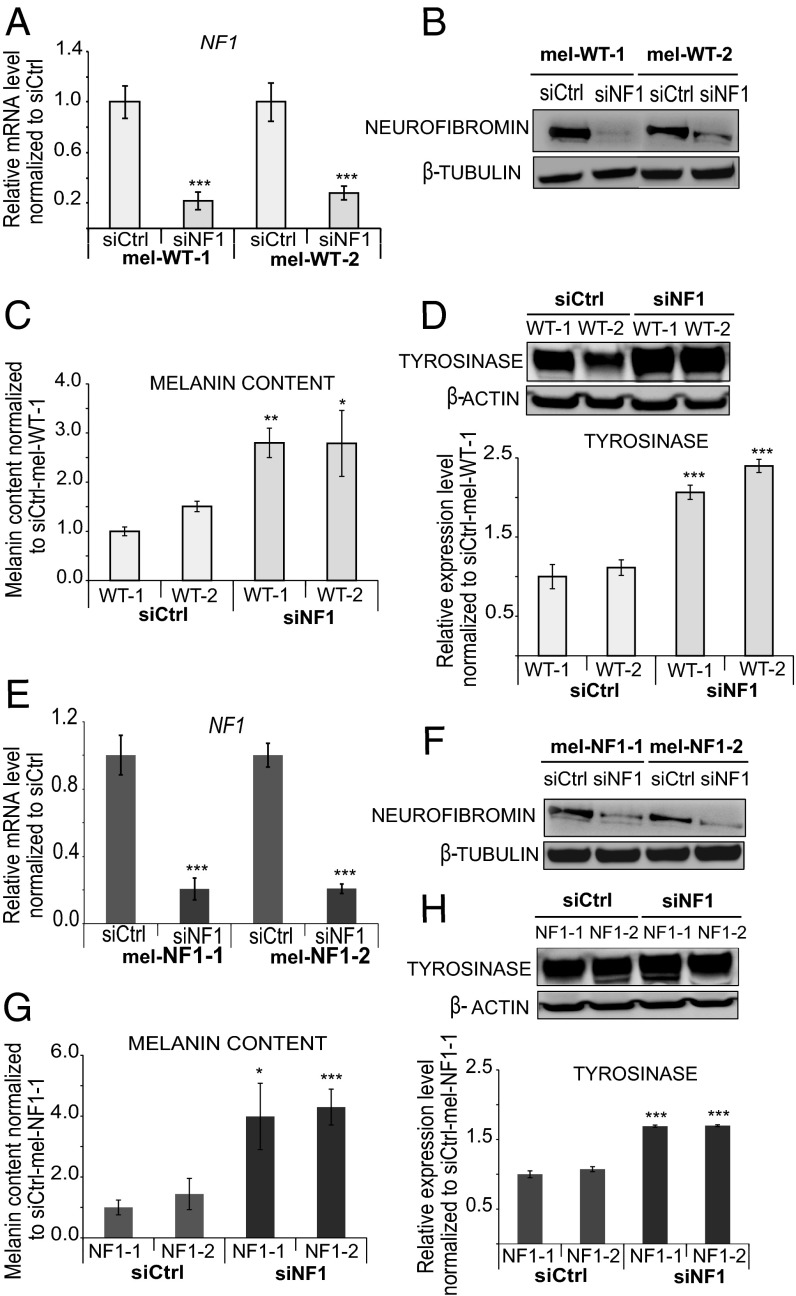
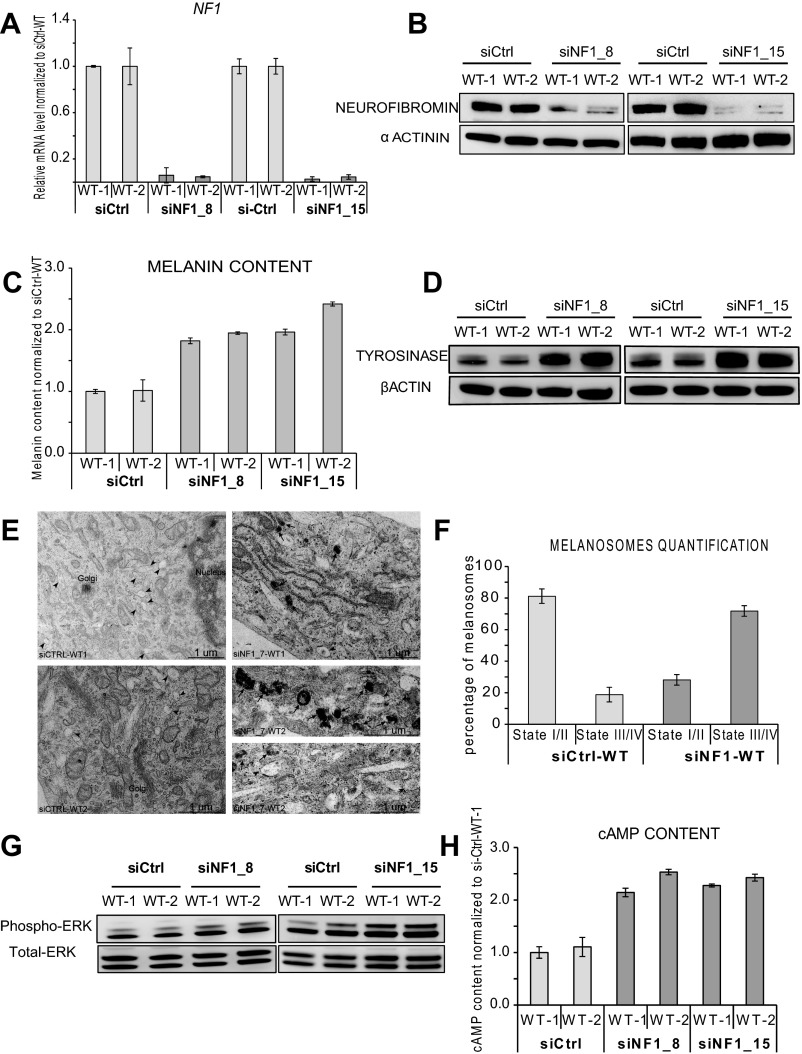
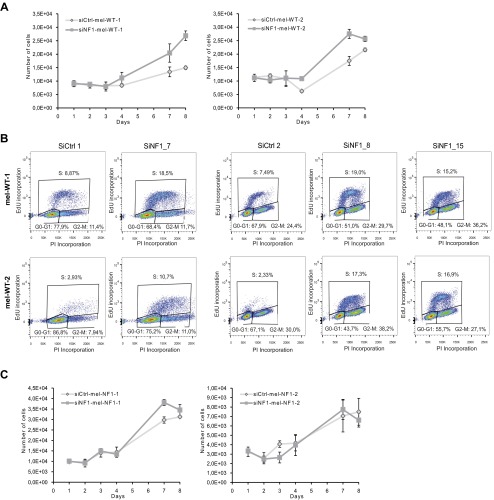
To confirm a direct involvement of neurofibromin down-expression in the hyperpigmentation phenotype, we transfected mel-WT cells with three distinct siRNAs targeting the NF1 gene. Decreased expression of NF1 was confirmed at both the RNA and protein levels (Fig. 3 A and B and Fig. S3 A and B). At the functional level, down-expression of neurofibromin in mel-WT cells resulted in increased melanin content (Fig. 3C and Fig. S3C), as well as greater tyrosinase expression (Fig. 3D and Fig. S3D). EM analysis revealed a qualitative and quantitative increase in dark-pigmented granules (stages III and IV) in siRNA targeting NF1 (siNF1)-mel-WT cells compared with control siRNA (siCtrl)-mel-WT cells (Fig. S3 E and F). Automated quantification of DAPI nuclei stained at 8 days after plating of siNF1-mel-WT and siCtrl-mel-WT cells revealed that siNF1-mel-WT cells proliferated more actively by day 8 (Fig. S4A). Flow cytometry analysis of cell cycle progression at day 4 after 5-ethynyl-2′-deoxyuridine (EdU) incorporation confirmed an increase of replicative mel-WT cells transfected with siNF1 at the S stage compared with cells treated with control siRNAs (Fig. S4B). These results suggest that down-regulation of neurofibromin expression in mel-WT cells is sufficient to result in pathological phenotypes analogous to those observed in mel-NF1 cells.
Fig. 3.
Neurofibromin depletion with siRNA in mel-WT and mel-NF1 cells. (A) qRT-PCR analysis of NF1 transcript expression in mel-WT-1 and mel-WT-2 cells transfected with either siRNA targeting NF1 (siNF1) or control siRNA (siCtrl). qRT-PCR levels are presented as fold change relative to siCtrl-mel-WT cells. Results are expressed as mean ± SD (n = 3). (B) Western blot analysis of neurofibromin expression in mel-WT-1 and mel-WT-2 cells transfected with siNF1 or siCtrl. β-tubulin served as a loading control (n = 1). (C) Melanin content in siCtrl-mel-WT-1 and WT-2 and siNF1-mel-WT-1 and WT-2 cells. Measurements were performed using 105 cells of each cell type. Data are presented as mean ± SD (n = 3) normalized to the expression in siCtrl-mel-WT-1 cells. (D) Western blot analysis of tyrosinase expression in siNF1-mel-WT-1 and WT-2 and siCtrl-mel-WT-1 and WT-2 cells. β actin served as a loading control. Densitometry measurement of protein levels was relative to siCtrl-mel-WT-1 cells. Results are expressed as mean ± SD (n = 3). (E) qRT-PCR analysis of NF1 transcript expression in mel-NF1-1 and NF1-2 cells transfected with siNF1 and siCtrl. qRT-PCR values are presented as fold change relative to siCtrl-mel-NF1 cells. Results are expressed as mean ± SD (n = 3). (F) Western blot analysis of neurofibromin expression in mel-NF1-1 and mel-NF1-2 cells transfected with siCtrl or siNF1. β-tubulin served as a loading control (n = 1). (G) Melanin content in siCtrl-mel-NF1-1 and NF1-2 and siNF1-mel-NF1-1 and NF1-2 cells. Measurements were performed using 105 cells of each cell type. The results are expressed as a relative level normalized to siCtrl-mel-NF1-1 cells. Data are presented as mean ± SD (n = 3). (H) Western blot analysis of tyrosinase expression in siCtrl-mel-NF1and siNF1-mel-NF1 cells. β-actin served as a loading control. Results are expressed as mean ± SD (n = 3), *P < 0.05, **P < 0.01, ***P < 0.001, ANOVA followed by Dunnett’s multiple-comparison test with siCtrl-mel-WT cells (A, C, and D) or siCtrl-mel-NF1-1 cells (E, G, and H).
Fig. S3.
Neurofibromin depletion with siRNA (siNF1_8; siNF1_15) in mel-WT cells. (A) qRT-PCR analysis of NF1 transcript expression in mel-WT-1 and mel-WT-2 cells transfected with either siRNA targeting different domains of NF1 (siNF1_8 and siNF1_15) or siCtrl. qRT-PCR results are presented as fold change relative to siCtrl-mel-WT cells after normalization against housekeeping gene 18S. Results are expressed as mean ± SD. (B) Western blot analysis of neurofibromin expression in mel-WT-1 and mel-WT-2 cells transfected with siNF1_8, siNF1_15 or siCtrl. α-actinin served as a loading control. (C) Melanin content in siCtrl-mel-WT-1 and WT-2 and mel-WT-1 and WT-2 cells transfected with siNF1_8 and siNF1_15. Measurements were performed using 105 cells of each cell type. Data are presented as mean ± SD normalized to the expression in siCtrl-mel-WT-1 cells. (D) Western blot analysis of tyrosinase expression in mel-WT-1 and WT-2 cells transfected with in siNF1_8, siNF1_15 and siCtrl-mel-WT-1 and WT-2 cells. β-actin served as a loading control. (E) Representative EM images of melanosome maturation in mel-WT cells transfected with siNF1 (siNF1_7) and siCtrl-mel-WT. Characteristic immature (stage I/II) and mature (stage III/IV) melanosomes are observed in the soma of melanocytes. (Scale bar: 1 µm.) (F) Quantification of melanosome maturation in siNF1-mel-WT and siCtrl-mel-WT cell lines. Data are presented as mean ± SD (n = 100 stages of melanosomes). (G) Western blot analysis of Phospho-p44/42 ERK1/2 in siCtrl-mel-WT-1 and WT-2 and mel-WT-1 and WT-2 cells transfected with siNF1_8 and siNF1_15. Total ERK served as a control. (H) Direct ELISA analysis of cAMP content in siCtrl-mel-WT-1 and Wt-2 and siNF1_8 and siNF1_15-mel-WT-1 and WT-2 cells. Measurements were performed using 105 cells of each cell type. Results were normalized to siCtrl-mel-WT-1 and are expressed as mean ± SD.
Fig. S4.
Proliferation rate after neurofibromin depletion. (A) Automated quantification at different time points after plating of DAPI nuclear staining in siCtrl-mel-WT and siNF1-mel-WT cells. (B) Cell cycle progression after EdU incorporation in siCtrl-mel-WT and siNF1-mel-WT cells (siNF1_7, siNF1_8, siNF1_15) by flow cytometry analysis. Annotations indicate distribution of cells in G0/G1, S, G2, and M phases (15,000 events total). (C) Automated quantification at different time points after plating of DAPI nuclear staining in siCtrl-mel-NF1 and siNF1-mel-NF1 cells.
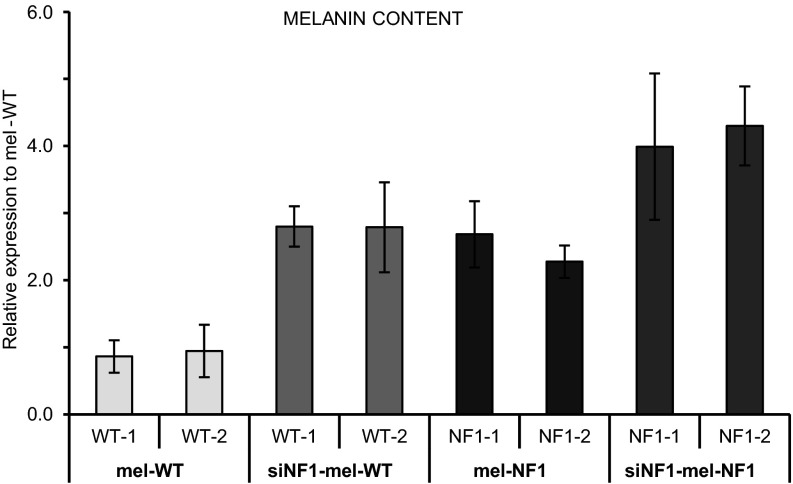
We next asked whether complete depletion in neurofibromin might be associated with pigmentation defects such as those observed in CALMs from patients with NF1. For this purpose, mel-NF1 cells were transiently transfected with specific siRNAs targeting neurofibromin expression still present in these mutant cells. qRT-PCR and Western blot analysis confirmed the reduction of neurofibromin in siRNA-treated mel-NF1 cells compared with control mel-NF1 cells (Fig. 3 E and F). Interestingly, NF1 depletion led to increases in intracellular melanin content as well as tyrosinase expression (Fig. 3 G and H), confirming the involvement of neurofibromin in the regulation of melanogenesis in human melanocytes. No significant effect of NF1-targeted siRNA transfection was observed in mel-NF1 cells on cell proliferation (Fig. S4C). We then performed a comparative analysis of the intracellular melanin content in mel-WT, siNF1-mel-WT, mel-NF1, and siNF1-mel-NF1 cells. As expected, the down-expression of neurofibromin in mel-WT cells led to a similar level of melanin content as was observed in mel-NF1 cells (Fig. S5). In addition, the loss of neurofibromin induced by the NF1 siRNA treatment in mel-NF1 cells exacerbated the increased melanin content (Fig. S5). Our results also suggest the possibility of using hESCs-derived melanocytes to reproduce the effect of gradient neurofibromin expression on the hyperpigmentation phenotype.
Fig. S5.
Comparative analysis of melanin content in the function of neurofibromin expression. Shown is a compiled representation of melanin content in mel-WT-1 and WT-2, siNF1-mel-WT-1 and WT-2, mel-NF1-1 and NF1-2, and siNF1-mel-NF1-1 and NF1-2 cells. Measurements were performed using 105 cells of each cell type. Results were normalized to mel-WT-1 control and are expressed as mean ± SD (n = 3).
NF1-Related Alteration of ERK1/2 and cAMP Signaling Pathways.
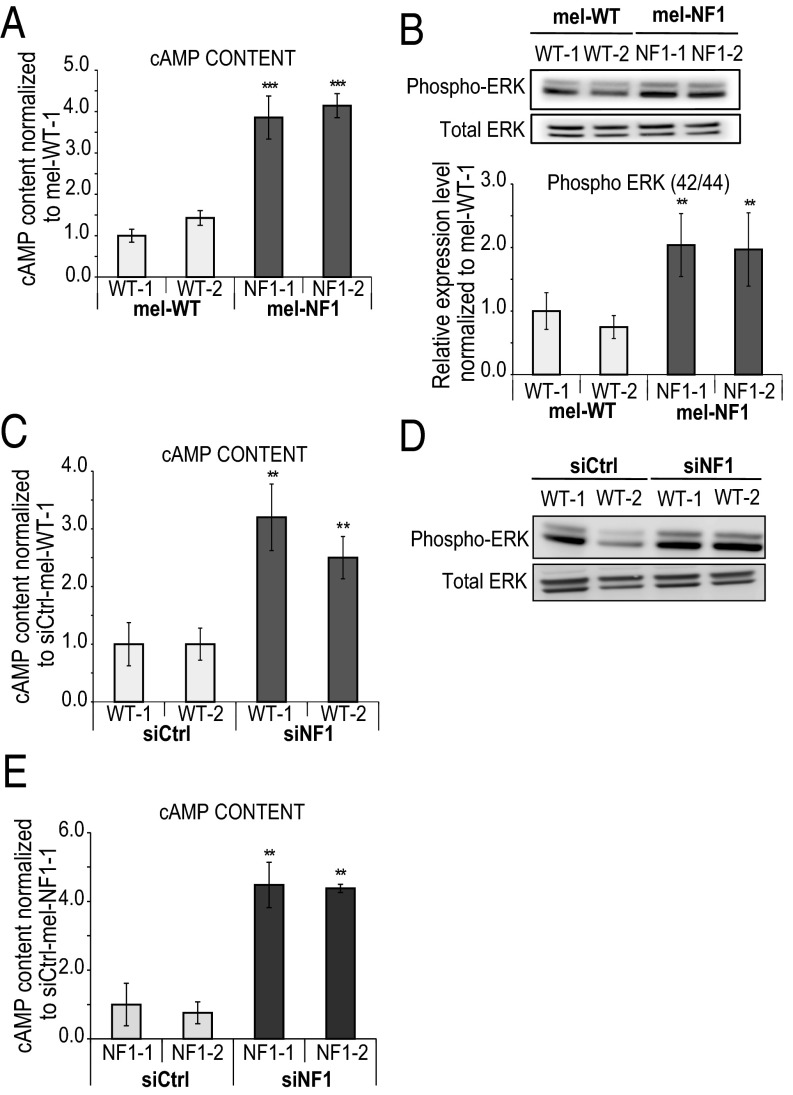
To decipher the molecular mechanisms linking down-expression of neurofibromin with the hyperpigmentation phenotype, we focused our attention on a possible role of cAMP-mediated PKA and ERK signaling pathways, which have been shown to be misregulated in various NF1 models (10, 29, 30). ELISA revealed a fourfold increase in cAMP levels in mel-NF1 cells compared with mel-WT cells (Fig. 4A). Analysis of posttranslational activation of MAPK by phosphorylation disclosed major differences between mel-NF1 and mel-WT cells. Mel-NF1 cells showed a twofold increase in pERK level compared with mel-WT cell lines (Fig. 4B). To correlate these modifications with deregulation of neurofibromin expression, we further down-expressed neurofibromin in mel-WT cells. This led to an increase in cAMP activity and activation of the ERK signaling pathway (Fig. 4 C and D and Fig. S3 G and H). Consistent with these results, NF1 depletion in mel-NF1 cells also resulted in a fourfold increase in cAMP intracellular content compared with control cells (Fig. 4E).
Fig. 4.
Impact of neurofibromin expression in cAMP and ERK1/2 signaling pathways in melanocytes. (A) Direct ELISA analysis of cAMP content in mel-WT and mel-NF1 cells. Results are expressed as mean ± SD (n = 3). Measurements were performed using 105 cells of each cell type. The results were normalized to siCtrl-mel-WT-1 cells. (B) (Upper) Western blot analysis of Phospho-p44/42 MAPK (ERK1/2) in mel-NF1 cells compared with mel-WT cells. Total ERK served as a control. (Lower) Densitometry measurement of protein levels relative to control mel-WT-1 cells. Results are expressed as mean ± SD (n = 3). (C) Direct ELISA analysis of cAMP content in siCtrl-mel WT-1 and WT-2 and siNF1-mel WT-1 and WT-2 cells. Measurements were performed using 105 cells of each cell type. Results were normalized to siCtrl-mel WT-1 cells and are presented as mean ± SD (n = 3). (D) Western blot analysis of Phospho-p44/42 ERK1/2 in siCtrl-mel WT-1 and WT-2 and siNF1-mel WT-1 and WT-2 cells. Total ERK served as a control (n = 1). (E) Direct ELISA analysis of cAMP content in siCtrl-mel NF1-1 and NF1-2 and siNF1-mel NF1-1 and NF1-2 cells. Measurements were performed using 105 cells of each cell type. The results were normalized to siCtrl-mel NF1-1. Results are expressed as mean ± SD (n = 3). **P < 0.01, ***P < 0.001, ANOVA followed by Dunnett’s multiple-comparison test compared with WT-1 (A and B), siCtrl-mel WT-1 (C), or siCtrl-mel NF1-1 (E).
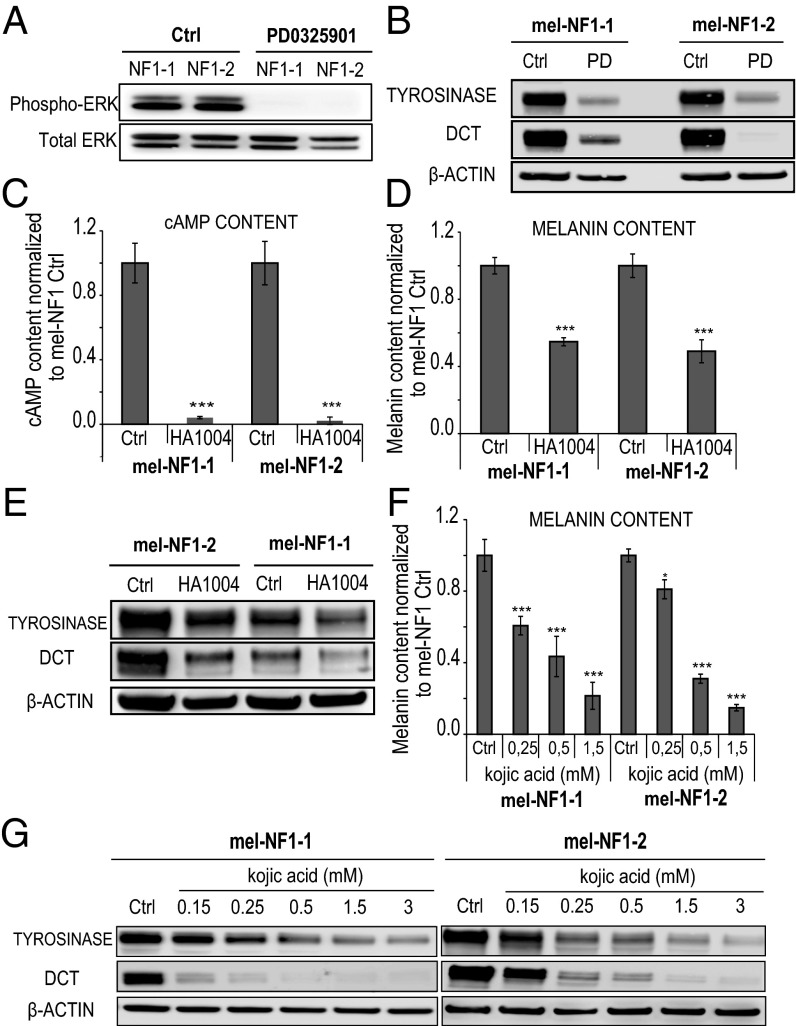
We then investigated whether the defective melanogenesis observed in NF1 hESCs-derived melanocytes could be rescued by pharmacologic modification of cAMP-mediated PKA and ERK signaling pathways. For this, we treated mel-NF1 cells with specific inhibitors of cAMP-mediated PKA, MEK, and tyrosinase activity. The MEK inhibitor PD032059 induced an obvious decrease in the expression of phospho-ERK (Fig. 5A), correlated with decreases in tyrosinase and DCT cell protein content (Fig. 5B). We obtained a similar result using the PKA-cAMP pathway inhibitor HA1004. Treating mel-NF1 cells with HA1004 resulted in decreased cAMP content (Fig. 5C), which in turn led to a reduction in melanin content (Fig. 5D), as well as down-regulated expression of key enzymes involved in melanogenesis, such as tyrosinase and DCT (Fig. 5E). We also evaluated the effect of kojic acid, a specific inhibitor of tyrosinase activity. As expected, treatment with kojic acid led to a reduction in melanin content (Fig. 5F). Consistent with these findings, Western blot analysis showed that the decrease in tyrosinase and DCT expression was correlated with the concentration of kojic acid (Fig. 5G). All of the foregoing results demonstrate that decreased expression of neurofibromin affects melanogenesis, probably via its action on ERK and cAMP signaling pathways. Interestingly, our results also demonstrate that it is possible to block these cascades of events pharmacologically.
Fig. 5.
Effects in mel-NF1 cells of specific inhibitors targeting downstream signaling pathways of neurofibromin on melanogenesis. (A) Western blot analysis of phospho-p44/42 MAPK (ERK1/2) after PD0325901 treatment in mel-NF1-1 and NF1-2 cells. Total ERK served as a control (n = 2). (B) Western blot analysis of tyrosinase and DCT expression after PD0325901 treatment in mel-NF1-1 and NF1-2 cells. β-actin served as a loading control (n = 2). (C) Direct ELISA analysis of cAMP content in mel-NF1-1 and NF1-2 cells after HA1004 treatment. Measurements were performed using 105 cells of each cell type. Results were normalized to mel-NF1 control and are expressed as mean ± SD (n = 3). (D) Melanin content in mel-NF1-1 and NF1-2 cells after HA1004 treatment. Measurements were performed using 105 cells of each cell type. Results were normalized to mel-NF1 control and are expressed as mean ± SD (n = 3). (E) Western blot analysis of tyrosinase and DCT expression after HA1004 treatment in mel-NF1-1 and NF1-2 cells. β actin served as a loading control. (F) Melanin content after treatment of mel-NF1-1 and mel-NF1-2 cells with various concentrations of kojic acid. Results are expressed as mean ± SD (n = 3). (G) Western blot analysis of tyrosinase and DCT expression after treatment with various concentrations of kojic acid in mel-NF1-1 and mel-NF1-2 cells. β-actin served as a loading control (n = 1). *P < 0.05, ***P < 0.001, ANOVA followed by Dunnett’s multiple-comparison test with NF1-1 control or NF1-2 control cells (C, D, and F).
Discussion
The main finding of this study is the demonstration that skin defects associated with NF1 can be reliably modeled in vitro using melanocytes derived from hESCs. This has allowed us to define the molecular mechanisms responsible for hyperpigmentation and CALMs. These mechanisms involve activation of the cAMP-mediated PKA and ERK1/2 signaling pathways, which affects the expression of major proteins involved in melanin biosynthesis and pigmentation of melanosomes. Our results also suggest that targeting these proteins may have clinical significance in diminishing the hyperpigmentation associated with CALMs.
Melanocytes Derived from Mutant NF1-Carrying hESCs Replicate the Pathological Phenotypes in Vitro.
Few previous studies have analyzed the effects of the NF1 mutation on melanogenesis. Until now, only Kaufman et al. (15) had demonstrated a higher melanin content in human melanocytes obtained from biopsy specimens of CALMs and other areas of skin from patients with NF1 compared with melanocytes from healthy donors. Interestingly, those authors correlated this phenotype with increased tyrosine hydroxylase activity (15). Owing to the limited accessibility of human NF1 melanocytes, these results have not been confirmed, however. Although pigment abnormalities could not be demonstrated in Nf1+/− mice, cultured melanocytes from these mice have shown increased expression of Mitf, Tyrosinase (Tyr), Tyrp1, and Dct at the RNA level (31). The experimental setup used in the present study allowed us to overcome some of the technical problems encountered by others, making it possible to explore homogeneous proliferative populations of human melanocytes in amounts as large as required by each analysis.
Our first and most important result is that melanocytes derived from hESCs carrying a heterozygous NF1 mutation reproduced the generalized hyperpigmentation phenotype observed in patients with NF1. The increased melanin content associated with up-regulation of MITF, TYR, and DCT in mel-NF1 cells is consistent with the observations reported in Nf1+/− mice. Confirming the direct implication of neurofibromin in the development of these phenotypes, NF1 knockdown in mel-WT cells led to a similar phenotype. Moreover, it was possible to demonstrate a gene dosage effect; the knockdown neurofibromin expression in mel-NF1 cells led to significant exacerbation of the already hyperpigmented cell phenotype, confirming that CALMs are directly related to the spontaneous loss of heterozygosity in discrete populations of melanocytes in patients with NF1.
To date, only a few studies have described the consequences of the NF1 gene defect on the size and distribution of melanosomes (32, 33). It has been shown that melanocytes from some patients with NF1 contain giant pigment granules known as macromelanosomes in both CALMs and non–CALM-derived melanocytes (34). More recently, it was reported that a loss of neurofibromin expression induced by shRNA in human primary cultures of melanocytes derived from healthy patients led to aberrant subcellular localization of melanosomes (32). Our study highlights the functional consequences of decreased neurofibromin expression on melanosome maturation. Hyperpigmented NF1-hESCs–derived melanocytes were characterized by a very significant shift in the four different stages of maturation, involving repartition of melanosomes toward the most mature stages (III and IV). Taken together, these results provide important insights into the possible function of NF1 during the maturation, transport, and distribution of melanosomes; however, further studies are needed to determine the exact contribution of NF1 to these processes.
NF1-Induced Hyperactivity of cAMP-Mediated PKA and ERK1/2 Signaling Pathways Is Involved in Overexpression of Melanogenic Enzymes.
So far, the functional consequences of the down-regulation of neurofibromin expression have been explored mainly in Schwann cells and central nervous system neurons. Those studies pointed to misregulation of several important downstream signaling pathways, including the MEK/MAPK and cAMP-mediated PKA pathways; however, depending on the cell type analyzed, either up- or down-regulation of cAMP content was correlated with decreased expression of neurofibromin. Thus, Schwann cells retrieved from neurofibromas exhibited increased cAMP levels (30, 35). Activation of MEK/MAPK was also observed in the peripheral nerve sheath in one mouse model (36). Conversely, Nf1+/− heterozygous mice showed decreased cAMP levels in astrocytes (37, 38) and central nervous system neurons (39). Recently, Anastasaki and Gutmann (40) analyzed neurons derived from induced pluripotent stem cells from patients with NF1 and proposed a way to reconcile those conflicting results by showing that in neurons, decreased neurofibromin expression led to lower rather than higher cAMP levels. Our results indicate that in melanocytes, decreased expression of neurofibromin on signaling pathways is characterized by an increase in the MEK/MAPK and cAMP-mediated PKA pathways, as observed in Schwann cells. Therefore, our results strongly suggest that NF1 mutation might affect melanocytes and Schwann cells through similar metabolic pathways, raising the possibility that a common therapeutic strategy could be developed to address the dysfunction of these two cell types in patients with NF1.
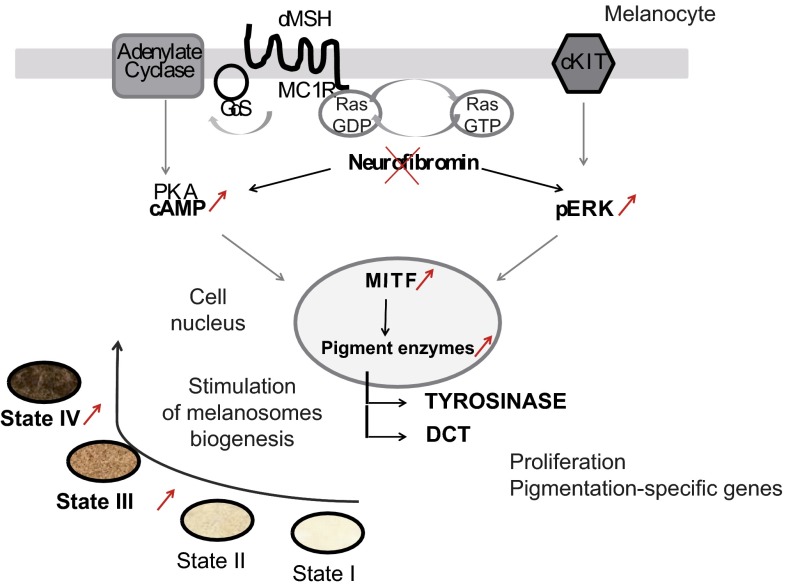
Activation of P38-MAPK and cAMP enhances MITF expression and melanin production via phosphorylation of the cAMP-responsive element-binding protein (CREB) (41). As observed with the cAMP pathway, activation of the MAPK signaling pathways may lead to either up- or down-regulation of melanogenesis, depending on the cell type analyzed (42, 43). Diwakar et al. (31) reported opposite effects of MEK inhibition, leading to decreased melanogenic gene expression in primary murine melanocytes and increased gene expression in their immortalized counterparts, melan-a cells. In the present study, we have demonstrated that in mel-NF1 cells, the MEK inhibitor PD032059 and the PKA-cAMP pathway inhibitor HA1004 induced marked decreases in levels of phospho-ERK and cAMP, respectively, in parallel with the down-regulation of tyrosinase and DCT expression expected in human primary melanocytes. Identification of these molecular cascades responsible for the phenotypic alterations that mimic those observed in patients with NF1 (Fig. S6) enabled us to target them with specific inhibitors, resulting in the expected functional recovery. We obtained similar results using kojic acid, a specific inhibitor of tyrosinase. Taken together, our results highlight the therapeutic potential of human pluripotent stem cell-derived melanocytes to identify or validate new pharmacologic approaches targeting hyperpigmentation phenotypes. Although the hyperpigmentation associated with CALMs is not life-threatening, it does impair the quality of life of affected patients (5, 6); thus, further studies involving topical application of a specific tyrosinase inhibitor may be clinically relevant.
Fig. S6.
Schematic representation of melanocyte hyperpigmentation in the NF1 disease model.
Methods
Melanocyte Differentiation.
hESCs were differentiated into melanocytes as described previously (20).
Measurement of Melanin Content.
Melanocytes were treated for 7 d with 1 µM alpha-Melanocyte Stimulating Hormone αMSH and 100 µM 3-Isobutyl-1-methylxanthine (IBMX) after seeding. Then 100,000 cells were lysed in 1 M NaOH (Sigma-Aldrich) and centrifuged. Absorbance of supernatants was measured at 405 nm in 96-well microplates. A standard synthetic melanin curve (0–50 μg/mL; Sigma-Aldrich) was performed in triplicate for each experiment.
Determination of Intracellular cAMP Content.
cAMP content was measured by ELISA (ADI-901-066 direct cAMP ELISA kit; Enzolife). Melanocytes were treated with 1 µM αMSH and 100 µM IBMX for 60 min at 37 °C. cAMP was quantified on 100,000 cells and on the basis of a standard curve.
The methodology is described in more detail in SI Methods.
SI Methods
hESCs Culture.
Two distinct Str-443 (XX) and Str-441 (XY) hESC lines, NF1-1 and NF1-2, respectively, were derived from a preimplantation genetic diagnosis procedure (44). Embryos carried heterozygous deletion of four nucleotides (c.3457_3460delCTCA), leading to the appearance of a stop codon in the NF1 gene. Control cell lines were SA01 (XY; Cellartis), referred to herein as WT-1, and H9 (XX; WiCell Research Institute), referred to herein as WT-2.
hESCs were maintained on a layer of mitotically inactivated mouse embryonic fibroblasts. The cells were cultured in DMEM/F-12 GlutaMAX supplemented with 20% knockout serum replacement, 1 mM nonessential amino acids, 1% penicillin/streptomycin, 50 µM β-mercaptoethanol, and 10 ng/mL recombinant human FGF2 (all from Invitrogen).
RNA Extraction and qRT-PCR.
Total RNA was extracted using the RNeasy Mini Kit (Qiagen) according to the manufacturer’s protocol, and reverse-transcripted using the SuperScript III Reverse Transcription Kit (Invitrogen). qRT-PCR analysis was performed using the QuantStudio digital PCR system (Life Technologies). Quantification of gene expression was based on the Δ-cycle threshold (ΔCt) method and was normalized to the expression of 18S. PCR primers are listed in Tables S1 and S2. Three independent experiments were performed for each cell line.
Immunocytochemistry.
Cells were fixed and then permeabilized and labeled using rabbit anti-TYRP1 antibodies (Table S3). Photographs were taken using a Zeiss epifluorescence illumination microscope.
Flow Cytometry.
Cells were detached from culture plates, fixed, and permeabilized before labeling with MITF antibodies (Table S3). Experiments with isotype-specific controls were carried out without a primary antibody. Cells were analyzed with the MACSQuant analyzer (Miltenyi Biotec). For each experiment, 15,000 events were analyzed. Three independent experiments were performed for each cell line.
Proliferation Assay.
A cellular suspension of 1,500 melanocytes per well derived from normal or mutated hESCs was seeded in Corning 96-well plates in 254-CF medium (Invitrogen). From day 1 to day 4 or 8, the number of cells from five wells per condition was counted automatically after the addition of DAPI to the cell culture medium. Cell counting was done using the LEAP laser-enabled analysis and processing system (Cyntellect).
Cell Cycle.
The Click-iT EdU Alexa Fluor 647 flow cytometry assay kit (Life Technologies) was used to analyze the cell cycle of melanocytes. Analyses were performed using the MACSQuant analyzer following the manufacturer’s instructions.
Western Blot Analysis.
Cells were lysed in RIPA lysis buffer (Sigma-Aldrich) supplemented with antiproteases (Sigma-Aldrich) and antiphosphatase (Roche). SDS/PAGE was performed using NuPAGE Novex 4–12% or 3–8% Bis-Tris gels (Invitrogen). Proteins were transferred onto nitrocellulose membranes using the IBlot gel transfer stack (Invitrogen). After incubation with specific antibodies (Table S3), immunoreactive bands were revealed using Amersham ECL Plus Western blotting detection reagents (GE Healthcare). Quantification was performed using ImageJ software.
EM.
Cells were seeded on coverslips and fixed with 2.5% (vol/vol) glutaraldehyde in 0.1 M cacodylate buffer for 24 h, as described by Delevoye et al. (45). In brief, cells were rinsed with cacodylate buffer, postfixed in osmium tetroxide, dehydrated in increasing concentrations of ethanol, and embedded in Epon resin (TAAB) while on coverslips. Ultrathin sections were contrasted with uranyl acetate and lead citrate and observed with an electron microscope (CM120; FEI). Micrographs were obtained with a KeenView digital camera (Soft Imaging System).
Transient Transfection of siRNA.
A single pulse of 25 nmol/L of siRNA was administered to a 60% confluence culture by transfection with Lipofectamine RNAiMAX (Life Technologies) in 254CF medium (Invitrogen). Control scrambled (siCtrl) and NF1-specific siRNA [Hs_NF1_7 (7199-7219), NF1_8 (1623-1643), and NF1_15 (11037-11057)] were purchased from Qiagen.
Statistical Analysis.
Statistical analyses were performed using one-way ANOVA followed by Dunnett’s multiple-comparison test. P values < 0.05 were considered significant. Results are expressed as mean ± SD, normalized to the expression in control melanocytes derived from the WT-1 line (mel-WT-1).
Acknowledgments
We thank S. Viville and Dr. P. Tropel for providing hESCs; Dr. Y. Laabi for hESCs banking; D. Vidaud and Dr. B. Parfait for hESCs sequencing; Dr. A. Benchoua for providing HA1004; Dr. L. Larribere for participating in preliminary experiments; and S. Julie, A. Alquezar, and B. Champon for technical assistance. I-Stem is part of the Biotherapies Institute for Rare Diseases, supported by the Association Française contre les Myopathies. This work was supported by the Institut National de la Santé et de la Recherche Medicale, University Evry Val d’Essonne, Genopole, Kokcinelo Association for Neurofibromatosis Type 1, Domaine d'Intérêt Majeur (DIM) Biothérapies, Institut Curie, Laboratoire d'Excellence “Labex Revive” (Investissement d'Avenir; ANR-10-LABX-73), and the program INGESTEM (investissement d'avenir ANR-11-INBS-009-01). We acknowledge the Plateforme d'Imagerie Cellulaire et Tissulaire-Infrastructure en Biologie Santé et Agronomie, BioImaging Cell and Tissue Core Facility of the Institut Curie (PICT-IBiSA), member of the France BioImaging national research infrastructure, supported by the CelTisPhyBio Labex (ANR-10-LBX-0038) part of the IDEX PSL (ANR-10-IDEX-0001-02 PSL).
Footnotes
The authors declare no conflict of interest.
This article is a PNAS Direct Submission. L.I.Z. is a Guest Editor invited by the Editorial Board.
This article contains supporting information online at www.pnas.org/lookup/suppl/doi:10.1073/pnas.1501032112/-/DCSupplemental.
References
- 1.Trovó-Marqui AB, Tajara EH. Neurofibromin: A general outlook. Clin Genet. 2006;70(1):1–13. doi: 10.1111/j.1399-0004.2006.00639.x. [DOI] [PubMed] [Google Scholar]
- 2.Maertens O, et al. Molecular dissection of isolated disease features in mosaic neurofibromatosis type 1. Am J Hum Genet. 2007;81(2):243–251. doi: 10.1086/519562. [DOI] [PMC free article] [PubMed] [Google Scholar]
- 3.De Schepper S, Boucneau J, Lambert J, Messiaen L, Naeyaert J-M. Pigment cell-related manifestations in neurofibromatosis type 1: An overview. Pigment Cell Res. 2005;18(1):13–24. doi: 10.1111/j.1600-0749.2004.00206.x. [DOI] [PubMed] [Google Scholar]
- 4.Gutmann DH, et al. The diagnostic evaluation and multidisciplinary management of neurofibromatosis 1 and neurofibromatosis 2. JAMA. 1997;278(1):51–57. [PubMed] [Google Scholar]
- 5.Wolkenstein P, Zeller J, Revuz J, Ecosse E, Leplège A. Quality-of-life impairment in neurofibromatosis type 1: A cross-sectional study of 128 cases. Arch Dermatol. 2001;137(11):1421–1425. doi: 10.1001/archderm.137.11.1421. [DOI] [PubMed] [Google Scholar]
- 6.Ablon J. Gender response to neurofibromatosis 1. Soc Sci Med. 1996;42(1):99–109. doi: 10.1016/0277-9536(95)00076-3. [DOI] [PubMed] [Google Scholar]
- 7.Abramowicz A, Gos M. Neurofibromin in neurofibromatosis type 1 mutations in NF1gene as a cause of disease. Dev Period Med. 2014;18(3):297–306. [PubMed] [Google Scholar]
- 8.Fountain JW, et al. Physical mapping of the von Recklinghausen neurofibromatosis region on chromosome 17. Am J Hum Genet. 1989;44(1):58–67. [PMC free article] [PubMed] [Google Scholar]
- 9.Marchuk DA, et al. cDNA cloning of the type 1 neurofibromatosis gene: Complete sequence of the NF1 gene product. Genomics. 1991;11(4):931–940. doi: 10.1016/0888-7543(91)90017-9. [DOI] [PubMed] [Google Scholar]
- 10.Lau N, et al. Loss of neurofibromin is associated with activation of RAS/MAPK and PI3-K/AKT signaling in a neurofibromatosis 1 astrocytoma. J Neuropathol Exp Neurol. 2000;59(9):759–767. doi: 10.1093/jnen/59.9.759. [DOI] [PubMed] [Google Scholar]
- 11.Tong J, Hannan F, Zhu Y, Bernards A, Zhong Y. Neurofibromin regulates G protein-stimulated adenylyl cyclase activity. Nat Neurosci. 2002;5(2):95–96. doi: 10.1038/nn792. [DOI] [PubMed] [Google Scholar]
- 12.Johnson BL, Charneco DR. Café au lait spot in neurofibromatosis and in normal individuals. Arch Dermatol. 1970;102(4):442–446. [PubMed] [Google Scholar]
- 13.Jimbow K, Szabo G, Fitzpatrick TB. Ultrastructure of giant pigment granules (macromelanosomes) in the cutaneous pigmented macules of neurofibromatosis. J Invest Dermatol. 1973;61(5):300–309. doi: 10.1111/1523-1747.ep12676518. [DOI] [PubMed] [Google Scholar]
- 14.Jimbow K, Horikoshi T. The nature and significance of macromelanosomes in pigmented skin lesions: Their morphological characteristics, specificity for their occurrence, and possible mechanisms for their formation. Am J Dermatopathol. 1982;4(5):413–420. doi: 10.1097/00000372-198210000-00006. [DOI] [PubMed] [Google Scholar]
- 15.Kaufmann D, Wiandt S, Veser J, Krone W. Increased melanogenesis in cultured epidermal melanocytes from patients with neurofibromatosis 1 (NF 1) Hum Genet. 1991;87(2):144–150. doi: 10.1007/BF00204170. [DOI] [PubMed] [Google Scholar]
- 16.Lakkis MM, Epstein JA. Neurofibromin modulation of ras activity is required for normal endocardial-mesenchymal transformation in the developing heart. Development. 1998;125(22):4359–4367. doi: 10.1242/dev.125.22.4359. [DOI] [PubMed] [Google Scholar]
- 17.Brannan CI, et al. Targeted disruption of the neurofibromatosis type-1 gene leads to developmental abnormalities in heart and various neural crest-derived tissues. Genes Dev. 1994;8(9):1019–1029. doi: 10.1101/gad.8.9.1019. [DOI] [PubMed] [Google Scholar]
- 18.Jacks T, et al. Tumour predisposition in mice heterozygous for a targeted mutation in Nf1. Nat Genet. 1994;7(3):353–361. doi: 10.1038/ng0794-353. [DOI] [PubMed] [Google Scholar]
- 19.Deo M, Huang JL-Y, Fuchs H, de Angelis MH, Van Raamsdonk CD. Differential effects of neurofibromin gene dosage on melanocyte development. J Invest Dermatol. 2013;133(1):49–58. doi: 10.1038/jid.2012.240. [DOI] [PubMed] [Google Scholar]
- 20.Nissan X, et al. Functional melanocytes derived from human pluripotent stem cells engraft into pluristratified epidermis. Proc Natl Acad Sci USA. 2011;108(36):14861–14866. doi: 10.1073/pnas.1019070108. [DOI] [PMC free article] [PubMed] [Google Scholar]
- 21.Mica Y, Lee G, Chambers SM, Tomishima MJ, Studer L. Modeling neural crest induction, melanocyte specification, and disease-related pigmentation defects in hESCs and patient-specific iPSCs. Cell Reports. 2013;3(4):1140–1152. doi: 10.1016/j.celrep.2013.03.025. [DOI] [PMC free article] [PubMed] [Google Scholar]
- 22.Carvajal-Vergara X, et al. Patient-specific induced pluripotent stem cell-derived models of LEOPARD syndrome. Nature. 2010;465(7299):808–812. doi: 10.1038/nature09005. [DOI] [PMC free article] [PubMed] [Google Scholar]
- 23.Zhang J, et al. A human iPSC model of Hutchinson Gilford progeria reveals vascular smooth muscle and mesenchymal stem cell defects. Cell Stem Cell. 2011;8(1):31–45. doi: 10.1016/j.stem.2010.12.002. [DOI] [PubMed] [Google Scholar]
- 24.Marteyn A, et al. Mutant human embryonic stem cells reveal neurite and synapse formation defects in type 1 myotonic dystrophy. Cell Stem Cell. 2011;8(4):434–444. doi: 10.1016/j.stem.2011.02.004. [DOI] [PubMed] [Google Scholar]
- 25.Feyeux M, et al. Early transcriptional changes linked to naturally occurring Huntington’s disease mutations in neural derivatives of human embryonic stem cells. Hum Mol Genet. 2012;21(17):3883–3895. doi: 10.1093/hmg/dds216. [DOI] [PubMed] [Google Scholar]
- 26.Telias M, Ben-Yosef D. Modeling neurodevelopmental disorders using human pluripotent stem cells. Stem Cell Rev. 2014;10(4):494–511. doi: 10.1007/s12015-014-9507-2. [DOI] [PubMed] [Google Scholar]
- 27.Luo G, Kim J, Song K. The C-terminal domains of human neurofibromin and its budding yeast homologs Ira1 and Ira2 regulate the metaphase to anaphase transition. Cell Cycle. 2014;13(17):2780–2789. doi: 10.4161/15384101.2015.945870. [DOI] [PMC free article] [PubMed] [Google Scholar]
- 28.Raposo G, Marks MS. Melanosomes—dark organelles enlighten endosomal membrane transport. Nat Rev Mol Cell Biol. 2007;8(10):786–797. doi: 10.1038/nrm2258. [DOI] [PMC free article] [PubMed] [Google Scholar]
- 29.Sharma R, et al. Hyperactive Ras/MAPK signaling is critical for tibial nonunion fracture in neurofibromin-deficient mice. Hum Mol Genet. 2013;22(23):4818–4828. doi: 10.1093/hmg/ddt333. [DOI] [PMC free article] [PubMed] [Google Scholar]
- 30.Dang I, De Vries GH. Aberrant cAMP metabolism in NF1 malignant peripheral nerve sheath tumor cells. Neurochem Res. 2011;36(9):1697–1705. doi: 10.1007/s11064-011-0433-2. [DOI] [PubMed] [Google Scholar]
- 31.Diwakar G, Zhang D, Jiang S, Hornyak TJ. Neurofibromin as a regulator of melanocyte development and differentiation. J Cell Sci. 2008;121(Pt 2):167–177. doi: 10.1242/jcs.013912. [DOI] [PubMed] [Google Scholar]
- 32.De Schepper S, et al. Neurofibromatosis type 1 protein and amyloid precursor protein interact in normal human melanocytes and colocalize with melanosomes. J Invest Dermatol. 2006;126(3):653–659. doi: 10.1038/sj.jid.5700087. [DOI] [PubMed] [Google Scholar]
- 33.Arun V, Worrell L, Wiley JC, Kaplan DR, Guha A. Neurofibromin interacts with the cytoplasmic Dynein Heavy Chain 1 in melanosomes of human melanocytes. FEBS Lett. 2013;587(10):1466–1473. doi: 10.1016/j.febslet.2013.03.035. [DOI] [PubMed] [Google Scholar]
- 34.Martuza RL, et al. Melanin macroglobules as a cellular marker of neurofibromatosis: A quantitative study. J Invest Dermatol. 1985;85(4):347–350. doi: 10.1111/1523-1747.ep12276952. [DOI] [PubMed] [Google Scholar]
- 35.Kim HA, Ratner N, Roberts TM, Stiles CD. Schwann cell proliferative responses to cAMP and Nf1 are mediated by cyclin D1. J Neurosci. 2001;21(4):1110–1116. doi: 10.1523/JNEUROSCI.21-04-01110.2001. [DOI] [PMC free article] [PubMed] [Google Scholar]
- 36.Jessen WJ, et al. MEK inhibition exhibits efficacy in human and mouse neurofibromatosis tumors. J Clin Invest. 2013;123(1):340–347. doi: 10.1172/JCI60578. [DOI] [PMC free article] [PubMed] [Google Scholar]
- 37.Dasgupta B, Dugan LL, Gutmann DH. The neurofibromatosis 1 gene product neurofibromin regulates pituitary adenylate cyclase-activating polypeptide-mediated signaling in astrocytes. J Neurosci. 2003;23(26):8949–8954. doi: 10.1523/JNEUROSCI.23-26-08949.2003. [DOI] [PMC free article] [PubMed] [Google Scholar]
- 38.Warrington NM, et al. Spatiotemporal differences in CXCL12 expression and cyclic AMP underlie the unique pattern of optic glioma growth in neurofibromatosis type 1. Cancer Res. 2007;67(18):8588–8595. doi: 10.1158/0008-5472.CAN-06-2220. [DOI] [PubMed] [Google Scholar]
- 39.Brown JA, Diggs-Andrews KA, Gianino SM, Gutmann DH. Neurofibromatosis-1 heterozygosity impairs CNS neuronal morphology in a cAMP/PKA/ROCK-dependent manner. Mol Cell Neurosci. 2012;49(1):13–22. doi: 10.1016/j.mcn.2011.08.008. [DOI] [PMC free article] [PubMed] [Google Scholar]
- 40.Anastasaki C, Gutmann DH. Neuronal NF1/RAS regulation of cyclic AMP requires atypical PKC activation. Hum Mol Genet. 2014;23(25):6712–6721. doi: 10.1093/hmg/ddu389. [DOI] [PMC free article] [PubMed] [Google Scholar]
- 41.Ahn JH, Jin SH, Kang HY. LPS induces melanogenesis through p38 MAPK activation in human melanocytes. Arch Dermatol Res. 2008;300(6):325–329. doi: 10.1007/s00403-008-0863-0. [DOI] [PubMed] [Google Scholar]
- 42.Park H-Y, et al. Role of BMP-4 and its signaling pathways in cultured human melanocytes. Int J Cell Biol. 2009;2009:750482. doi: 10.1155/2009/750482. [DOI] [PMC free article] [PubMed] [Google Scholar]
- 43.Englaro W, et al. Inhibition of the mitogen-activated protein kinase pathway triggers B16 melanoma cell differentiation. J Biol Chem. 1998;273(16):9966–9970. doi: 10.1074/jbc.273.16.9966. [DOI] [PubMed] [Google Scholar]
- 44.Tropel P, et al. High-efficiency derivation of human embryonic stem cell lines following pre-implantation genetic diagnosis. In Vitro Cell Dev Biol Anim. 2010;46(3-4):376–385. doi: 10.1007/s11626-010-9300-8. [DOI] [PubMed] [Google Scholar]
- 45.Delevoye C, et al. AP-1 and KIF13A coordinate endosomal sorting and positioning during melanosome biogenesis. J Cell Biol. 2009;187(2):247–64. doi: 10.1083/jcb.200907122. [DOI] [PMC free article] [PubMed] [Google Scholar]


