

Significance
Scaffolds that serve as synthetic mimics of the extracellular matrix have applications in wound healing, tissue engineering, and stem cell expansion. When cells are cultured in these tunable matrices, little is known about local microenvironmental changes during degradation and remodeling. Methods that provide quantitative and predictable information about cell-mediated remodeling could significantly improve the biomaterial design process. We use passive microrheology, a technique that measures rheological properties from Brownian motion of embedded particles, to characterize remodeling of a cell-laden peptide-functionalized poly(ethylene glycol) hydrogel that degrades in response to cell-secreted enzymes. Results show microenvironmental changes at multiple time and size scales, and reveal an interesting degradation gradient, as mesenchymal stem cells attach, spread, and move through these synthetic extracellular matrix mimics.
Keywords: PEG–peptide hydrogels, human mesenchymal stem cells, cell migration, microrheology
Abstract
Biomaterials that mimic aspects of the extracellular matrix by presenting a 3D microenvironment that cells can locally degrade and remodel are finding increased applications as wound-healing matrices, tissue engineering scaffolds, and even substrates for stem cell expansion. In vivo, cells do not simply reside in a static microenvironment, but instead, they dynamically reengineer their surroundings. For example, cells secrete proteases that degrade extracellular components, attach to the matrix through adhesive sites, and can exert traction forces on the local matrix, causing its spatial reorganization. Although biomaterials scaffolds provide initially well-defined microenvironments for 3D culture of cells, less is known about the changes that occur over time, especially local matrix remodeling that can play an integral role in directing cell behavior. Here, we use microrheology as a quantitative tool to characterize dynamic cellular remodeling of peptide-functionalized poly(ethylene glycol) (PEG) hydrogels that degrade in response to cell-secreted matrix metalloproteinases (MMPs). This technique allows measurement of spatial changes in material properties during migration of encapsulated cells and has a sensitivity that identifies regions where cells simply adhere to the matrix, as well as the extent of local cell remodeling of the material through MMP-mediated degradation. Collectively, these microrheological measurements provide insight into microscopic, cellular manipulation of the pericellular region that gives rise to macroscopic tracks created in scaffolds by migrating cells. This quantitative and predictable information should benefit the design of improved biomaterial scaffolds for medically relevant applications.
Synthetic hydrogel scaffolds have been designed to serve as mimics of the native extracellular matrix (ECM) with the goal of promoting desired cell functions (e.g., proliferation, migration, differentiation), especially for applications in wound healing (1), tissue regeneration (2), and stem cell culture (3, 4). For example, poly(ethylene glycol) (PEG) hydrogels can serve as blank slates in which peptide cues can be systematically introduced in the scaffold to allow integrin binding (5, 6), proteolytic degradation (7, 8), and even local sequestering of growth factors (9). Furthermore, it is well known that cells respond to mechanical stimuli (e.g., stiffness) in their local microenvironment, the so-called pericellular region, and tuning of a scaffold’s mechanical properties can influence how a cell degrades and remodels its surroundings (10–12). The complex cell–matrix interactions that occur in the native ECM are often mimicked in peptide-functionalized hydrogels through the incorporation of adhesive binding peptides (e.g., RGDS, IKVAV) and enzymatically degradable peptide cross-linkers (e.g., GPQGIWGQ, GPLGLWAR), both of which are necessary for cell attachment, spreading (13), and motility (12, 14). However, changes in the local material properties as a result of this cell-mediated remodeling have largely remained a “black box,” limiting interpretation of data and confounding the design of more advanced biomaterials.
Macroscopically, cells degrade micrometer-sized channels into scaffolds as they move, an event that begins with microscopic remodeling of their pericellular region and eventually permanently reengineering the scaffold architecture and material properties on a larger scale. If one seeks to design synthetic ECM environments to direct cellular processes, such as migration, it is important to better understand how these inputs are dynamically altered on the local length scale. Such information can help advance biomaterial design, especially for applications focused on the delivery or recruitment of cells, where directing cell–material interactions and migration can be critically important. At present, cell matrices are generally engineered to have certain initial material properties, but the resulting cell motility and cell–material interactions are often only empirically correlated with these design parameters (7, 15). To overcome this obstacle and provide an in situ measurement of scaffold degradation, microrheological measurements have been used to fingerprint and understand changes in material properties in the pericellular region during cell motility.
Although real-time measurements of material properties near a cell are difficult, investigations have focused on developing techniques to access this information. In two dimensions, forces that cells exert when seeded on hydrogel surfaces have been measured using deflection of beds of microneedles (15) and deformation of gel surfaces (16). For example, Tan et al. (15) developed a measurement technique that exploits independent deflection of microneedles of varying lengths (and therefore stiffnesses) to measure the distribution of subcellular traction forces of both smooth muscle cells and fibroblasts. The main conclusion was that cellular spreading and morphology control the magnitude of the traction forces (15). The traction force of confluent cell sheets interacting with a gel surface was also analyzed, toward understanding how cellular processes are coordinated over large length scales. Using endothelial, epithelial, and breast cancer cell sheets, results showed that collective migration was due to a transmittance of normal stress across cell–cell junctions with migration orientated in the direction of the minimal intercellular shear stress (16).
Cell-mediated degradation of the local microenvironment plays a critical role in permitting cellular migration and invasion in vivo. These processes are important during development, wound regeneration, and pathophysiological states facilitated by proteolytic events via cellular protease secretion. Previous work has begun to elucidate the length scales and spatial effects of secreted proteases in relation to migrating tumor cells during collagen matrix remodeling (17–19). For example, Packard et al. (20) used matrix metalloproteinase (MMP)-sensitive biosensors to visualize protease activity in the pericellular region of migrating tumor cells in collagen, finding increased activity at the polarized leading edge. These seminal works have elucidated the spatial presence and local activity of proteases in relation to individual migrating cells. However, how migrating cells temporally degrade and remodel the local microenvironment on larger length scales remains relatively unknown.
Although 2D studies add to our understanding of cell–matrix interactions, 2D environments can unnaturally polarize cells, and some aspects of cell motility can be quite different in 2D versus 3D environments (21, 22). For these reasons, recent developments have focused on strategies to measure cell–material interactions in three dimensions (e.g., cell-laden hydrogels). Traction force microscopy measures spatial interfacial forces by quantifying the elastic deformation of a substrate (21). If the modulus of the material is known, this technique quantifies the forces cells exert in three dimensions calculated from embedded bead displacement. This approach has identified patterns of forces generated around distinct morphological regions during cellular invasion into a scaffold (21). Additionally, Bloom et al. (23) investigated the degradation of a collagen scaffold during the migration of a fibrosarcoma cell line (HT1080s) using embedded particle displacements. The authors showed that the hydrogel was reversibly deformed at the cell’s leading edge, but irreversibly remodeled at the trailing edge. Collectively, these pioneering investigations have provided insight into aspects of the complex interplay between cells and scaffold materials; however, complementary techniques that allow characterization of dynamic and local changes in mechanical properties, degradation, and scaffold erosion would be beneficial in further advancing our understanding of mechanotransduction, mechanisms of cell motility, and even biomaterials design.
In this contribution, multiple particle tracking microrheology (MPT) is used to measure how human mesenchymal stem cells (hMSCs) remodel peptide cross-linked PEG hydrogels as they migrate. hMSC migration is characterized by significant remodeling of the local environment through attachment, enzymatic degradation, and cellular traction. Furthermore, hMSCs are observed to degrade the synthetic network through two pathways, MMP secretion that cleaves the peptide cross-linker and myosin II-regulated adhesion and reversible remodeling of the network. We find that MPT has the sensitivity to capture the temporal transition of the hydrogel from an elastic gel to a viscous liquid, during hMSC-mediated degradation. MPT simultaneously provides information about the spatial region, proximal to the cell, over which this matrix remodeling occurs. The technique and measurements enhance our understanding of cell–material interactions in three dimensions and enable visualization of dynamic cell-mediated matrix degradation, the so-called fourth dimension. On longer timescales, these microscopic changes give rise to the creation of macroscopic channels in the hydrogel that are important for hMSC motility. We believe that this approach and characterization can provide an important link for better understanding outside-in signaling experienced by cells when embedded in 3D environments.
Results and Discussion
Microrheological Characterization of Hydrogel Degradation and Remodeling During hMSC Migration.
To characterize hMSC remodeling of their local environment when embedded in MMP-degradable hydrogels, we use MPT. The sensitivity of MPT in the low moduli range (10−3 to 4 Pa) of hydrogels enables measurements of transitions from loosely cross-linked networks to viscoelastic polymeric fluids, an important critical-state transition that correlates to many macroscopic changes in cell behavior (e.g., morphology, motility, secretory properties). The hydrogel scaffold before cell-mediated degradation is similar to the mechanical environment presented in many soft tissues, such as neural and adipose tissue (11, 24, 25). Here, we aimed to more fully understand 3D hMSC motility quantitatively by characterizing the remodeling and degradation of the scaffold, which typically results in spatial variations in the local matrix mechanics. Dynamic spatiotemporal rheological measurements of the rheological evolution during cell motility will bridge a missing link to identify the outside-in signaling a cell experiences during migration and can be exploited in advanced material design to promote tissue regeneration. MPT measurements use video microscopy for data collection, capturing spatial information about changes in hydrogel properties with time. This technique enables one to resolve both temporal and spatial information about the cellular microenvironment, and here, we report on the characterization of the remodeling and degradation of MMP-degradable PEG–peptide hydrogels by 3D encapsulated hMSCs.
Microrheology measures the Brownian motion of embedded probe particles (carboxylated polystyrene probes with radius a, μm) and relates this motion to rheological properties, such as viscosity and creep compliance, using the generalized Stoke–Einstein relation (GSER):
| [1] |
Here, is the mean-squared displacement (MSD), t is time, is the thermal energy, is the creep compliance, and a is the probe particle radius (26–29). The state of material, i.e., sol or gel, can be determined using the logarithmic slope of the mean-squared displacement, , and the critical relaxation exponent, n; both are determined at the shortest lag times measured with MPT. The shortest lag times are the largest frequencies measured and capture the longest relaxation times of the material. Probe particles freely diffusing in a liquid have a value of . When , probe particles are completely arrested in the gel network. All values of α between 0 and 1 are an elastic solid or viscoelastic liquid, and this transition is defined by the critical relaxation exponent, n. The value of n has been previously determined from measurements of the kinetics of degradation analyzed using time-cure superposition (30–33). To determine the state of a material, α is compared with n; if , the material is a viscoelastic fluid, and if , the material is an elastic solid (30). The value of n for the hydrogel studied here is (30). MPT relies on the thermal motion of particles to measure material properties resulting in a low upper measurable moduli limit, ≈ 4 Pa (34). At this modulus, probe particles are completely arrested in the gel material and bulk rheology is used to measure the continued evolution of the gelling material.
In general, PEG hydrogel scaffolds have been designed with a complexity that allows physical and chemical cues to be locally presented to encapsulated cells and elicit desired functions (10–12). The hydrogel used in this work was formed via a photoinitiated thiol–ene polymerization of norbornene functionalized PEGs cross-linked with thiol-containing peptides (Fig. 1A) (35, 36). Specifically, a four-arm star PEG (Mn, 20,000) was end functionalized with norbornene; PEG was chosen due to its hydrophilicity, resistance to nonspecific protein adsorption, and the ability to tailor cell–material interactions by conjugation of selected peptide sequences (36–38). Here, the PEG was cross-linked with a MMP-degradable peptide, KCGPQG IWGQCK, which is cleaved at a high rate by MMP-1, -2, -3, -8, and 9 on a timescale relevant for 3D cell culture (8, 12, 39). Hydrogels measured in the absence of cells and incubated in an identical manner to cell-laden hydrogels showed no significant scaffold degradation, indicating that this peptide cross-linker is being degraded by cell-secreted enzymes. A schematic of the hydrogel formation and the specific formulation used for cell encapsulation experiments is shown in Fig. 1A. Included in the hydrogel scaffold is an adhesive ligand (1 mM CRGDS) that promotes hMSC adhesion and motility in the otherwise bioinert PEG scaffold. Upon irradiation with UV light (3 min, 365-nm light at 10 mW⋅cm−2) in the presence of a photoinitiator (lithium phenyl-2,4,6-trimethylbenzoylphosphinate), the norbornene and thiol functionalities undergo alternating propagation and chain transfer reactions via a step growth mechanism to yield a covalently cross-linked network (35, 36). Previous work has shown the usefulness of this material chemistry for culture of cells in two and three dimensions, rendering it a suitable material for studying how degradation-induced matrix changes influence cell motility in four dimensions (i.e., 3D space and time) (12, 14).
Fig. 1.

Human mesenchymal stem cells (hMSCs) migrate and form focal adhesions within the MMP-degradable PEG-peptide hydrogel. (A) Schematic of network formation for the MMP-degradable PEG-norbornene hydrogel scaffold (0.65 thiol:ene; 3 mM 4-arm PEG-norbornene; Mn, 20,000 g⋅mol−1; f = 4; 3.9 mM KCGPQG IWGQCK; Mn, 1,305 g⋅mol−1; f = 2; 1 mM CRGDS). (B) hMSCs were encapsulated at a density of 2×10⁵ cells per mL, and the motility of individual cells was followed in real time for a period of 6 h. (Scale bar: 100 μm; phase contrast image.) (C) Representative image of an encapsulated hMSC immunostained for actin (red), β1-integrin (green), and DAPI (blue). (Scale bar: 20 μm.) Forty-eight hours after encapsulation, hMSCs spread within the gel and form actin stress fibers and punctate β1-integrin staining as observed at the end of these fibers shown in the Inset. (Inset scale bar: 10 μm.) (D) The migratory speed of hMSCs decreased when cells were treated with either an MMP inhibitor (InSolution GM 6001; 10 μM; immediately after encapsulation) or blebbistatin (50 μM; 2 h postencapsulation). *P 0.05.
All cell-monitoring experiments were performed using a hydrogel with a low cross-linking density and modulus (0.18 0.02 mM and , respectively), which was achieved by controlling the stoichiometric ratio of the thiol-to-ene functional groups as 0.65 (14). The mechanical properties of the chosen scaffold are similar to those previously used in cell culture and regenerative medicine applications, such as collagen gels ( mg/mL) and PEG-based scaffolds for investigations of cell motility (14, 40). Although in these types of investigations a range of material properties are usually used, 0.1–100 kPa, for this work we focus on a material that is loosely cross-linked to enable facile cell-mediated degradation and motility (11, 25). hMSCs encapsulated at a density of cells per mL in this gel formulation survive, spread, and migrate. Fig. 1 B–D shows examples of real-time cell-tracking experiments, where hMSC migration was followed for a period of 6 h, Fig. 1B. Cell tracking was used to calculate speed, persistence, and percentage of cells migrating, which were 18 1 μm⋅h−1, 156 23 min, and 59 12, respectively (14). During 3D migration, hMSCs were observed to move over large distances in the matrix (10–150 μm over 6 h), which implies significant cell-mediated network degradation and remodeling. In particular, the initial mesh size of the hydrogel is orders of magnitude smaller (tens of nanometers) than the size of a cell (tens of micrometers). As further evidence of cell–matrix interactions, immunostaining was performed (Fig. 1C). Punctate β1-integrin staining (green) at the ends of actin stress fibers (red) was observed, indicating strong cellular attachment and spreading of the hMSCs in these PEG microenvironments. Additionally, hMSC migration was inhibited by the addition of either an MMP inhibitor, which limits cell-mediated degradation of the matrix, or with blebbistatin, which inhibits cytoskeletal tension. In both cases, cell migration was significantly reduced compared with untreated hMSCs (Fig. 1D). These controls further emphasize the importance of cell-mediated degradation and cellular tension on microenvironmental remodeling and subsequently regulating the hMSC migration process within these materials.
Cell-Mediated Degradation During Early Stages of Motility.
Using MPT to characterize hMSC-laden gels, we measured the changes in material properties, temporally and spatially, in the pericellular region of individual cells as they attach, spread, and begin to migrate in MMP-degradable hydrogels. MPT data during cellularly dictated changes in the hydrogel scaffold were collected over 25–60 min, while hMSCs were migrating. Initially and immediately after encapsulation, hMSCs were essentially embedded in a largely elastic solid gel environment, and representative, surrounding probe particle trajectories are depicted in Fig. 2A. However, tens of minutes after encapsulation, the hMSCs began to spread, remodel, and degrade their local hydrogel microenvironment; in this region, the material begins to transition from an elastic solid to a viscoelastic fluid, and the probe particle trajectories become significantly longer (Fig. 2B). At much longer timescales, the hMSC morphology is highly extended and relatively fast migration is observed, presumably through regions that are largely in a polymeric liquid state, as observed by probe particle trajectories illustrated in Fig. 2C.
Fig. 2.

hMSC remodeling and degradation of peptide cross-linked PEG hydrogels. Schematic images illustrating representative visual changes that occur in cell-laden hydrogels, where the changes in the gel properties are captured by MPT probe particle trajectories. (A) Initial state, before hMSCs have caused any substantial changes in the local material properties and the cells experience a solid gel environment; (B) during cell spreading, the local environment degrades in response to cellular activity, and the material begins to transition from a gel to a sol in a local region; and (C) at longer timescales, the pericellular region is extensively degraded, becoming a sol, and cell motility is observed. (D) Logarithmic slope of the MSD () of probe particles in the pericellular region during hMSC migration. The gel–sol transition occurs at the critical relaxation exponent, . Values of represent materials that are a sol and are gelled materials. Data are highlighted for two stages of cell motility that will be described in detail in Figs. 3 and 4. Fig. 3 A–C shows a cell that is spreading and starting to degrade the pericellular region, and Fig. 4 A–C is a cell that is very motile in a sol.
The logarithmic slope of the MSD, α, was calculated for each of these time points and collected in the pericellular region. Measurements were repeated over 4–10 cells, and each dataset on the graph (Fig. 2D) represents measurements around an individual cell. Clearly, degradation on the microscopic length scale has macroscopic implications related to cell-mediated scaffold architectural reengineering that facilitates motility. For hMSCs migrating through the MMP-degradable gels, we measured cells at two different time points. Initially in the migration process, we calculated that , where the cell is encapsulated in the gel network before any remodeling. Over the next 15–30 min, hMSCs begin to attach and spread in the network, a process that necessitates some degree of local scaffold degradation. MPT measurements capture this remodeling, as an increase in α over , the value where the gel–sol transition occurs. In general, this parameter corresponds to a decrease in network connectivity and the transition of the material from a gel, a sample spanning cross-linked network, to a sol. Once cell-mediated degradation is complete (i.e., the gel to sol transition), rapid migration is observed as detailed below.
Optical fluorescent video microscopy was used to capture MPT data and enabled characterization of spatial changes in the material properties during hMSC migration. With these measurements, we aimed to identify regions where a cell adheres to the network during MMP secretion and matrix degradation, as well as characterize the distances over which this hMSC matrix remodeling occurs. As an example, Fig. 3 A–C maps the material properties surrounding an hMSC embedded in a gel and measures degradation of the environment through time. The color of each ring is the logarithmic slope of the MSD, α, calculated from the motion of particles within that area. Warm colors indicate that , and the region is basically a solid gel state; light blue represents where and is indicative of Brownian diffusion; cooler colors are , indicating ballistic or directed motion. Concentric rings on the map are centered around the original cell position, which was defined at the beginning of the video. Here, the central ring has a radius of 150 pixels μm, with each ring having a radius 150 pixels larger than the previous one, i.e., . In this scheme, the central circle represents a value of α 150 pixels from the center of the cell area, and the next circle represents a value of α of particles 150–300 pixels (37–74 μm) away from the cell. Each ring represents the movement of particles that are uniquely identified within the specified area from the initial particle position.
Fig. 3.

Dynamic rheological changes in the pericellular region during migration of an encapsulated hMSC over time. Data are taken at (A) 0, (B) 9, and (C) 27 min after the cell is identified. Particle image velocimetry (PIV) measurements quantify the long-time movement of probe particles between (D) 0 and 4, (E) 9 and 14, and (F) 23 and 27 min. Every other particle trajectory is displayed on PIV plots for clarity. Bright-field images are set in the background of MPT measurements with MSD values calculated spatially as the distance away from the cell. The z axis, indicated by color, is the logarithmic slope of the MSD, α, where a slope of 0 (red) indicates no particle movement, a slope of 1 (light blue) indicates Brownian motion, and a slope of 1.6 (purple) indicates ballistic motion. PIV measurements show the displacements using color and size of arrows. Warm colors and small arrows indicate small particle displacement, whereas cool colors and large arrows show large particle displacement. Both of these measurements confirm that, through time as the cell is spreading, the largest extent of degradation occurs furthest from the cell.
Fig. 3 A–C shows the changes in material properties over 27 min, during migration of an hMSC that is beginning to spread at the early stages of data collection (these data are highlighted in Fig. 2D with closed symbols). Throughout this time period, the area closest to the cell remains a gel until the final time point, indicating that the cell is likely adhering to this region of the scaffold during MMP secretion. In Fig. 3B, we measured the transition from a gel to a sol, as annotated by the orange color, and here, the area directly around the cell appears to remain a gel. As we move through time (Fig. 3C), we observe that the extent of degradation of the scaffold is highest in regions furthest from the cell. In fact, a gradient in degradation is measured with viscoelastic fluid properties observed furthest from the cell, but transitioning to an elastic solid as one approaches the cell. In Fig. 3C, the outer circle indicates that the region has returned to a gel state, and we believe that this may be due in part to swelling of partially degraded gel adjacent to the cellular eroded features. When this occurs, the dimensional changes in the gel will begin to fill the voids created by the cell, resulting in rheological measurements that indicate that the material has returned to a gelled state at the edge of the field of view.
The corresponding images in Fig. 3 D–F are particle image velocimetry (PIV) measurements of particle movements over long timescales (Δt = 4–5 min) where displacement of the particles was measured between two bright-field images separated by several minutes. Warm colors indicate small particle displacements, whereas cool colors correlate to larger displacements. Lack of arrows in the PIV map indicate that there is no detectable displacement. In these PIV maps, we quantified particle displacements that agree with our microrheological measurements and reveal displacements primarily due to cell traction. MPT data are collected over a 30-s acquisition window. At these short times, we do not measure drift in particle movement, enabling the characterization of rheological properties. Over longer times, captured by PIV, directed motion of particle displacement is measured due to cytoskeletal tension on the network. In Fig. 3D, few particle displacements were detected. Over the long time intervals used for PIV, Δt = 4–5 min, we measured the largest particle displacement furthest from the cell during spreading. This movement decreased, as characterized in regions closest to the center of the cell. On this timescale, we believe that the particle movement is due to cytoskeletal tension in regions of the scaffold that are degraded. The detected displacement shows that particles are moving in a persistent direction over this interval, which implies cellular remodeling and traction on the remaining porous scaffold. Furthest from the cell, MPT measurements describe an elastic fluid, and PIV measurements agree with MPT but also imply that there is a scaffold structure on length scales greater than accessed with MPT. Additionally, PIV measurements reveal that movement of particles at these long timescales is equivalent to cell speed. This quantitative correlation in speed and direction confirms that PIV measurements on long timescales are due to cellular traction and remodeling during motility. Together, MPT and PIV analyses illustrate the complex interplay between cellular remodeling due to both cell–matrix interactions leading to traction, as well as cell-secreted enzymatic degradation in the local pericellular region. Both processes play a vital role in understanding dynamic changes in cell-laden hydrogel environments and its effects on cell motility.
The gradient in extent of degradation, where the highest extent of degradation was observed furthest from the cell, suggests that the value of the Damköhler number, , is small. This physically indicates that the cell-secreted enzymes diffuse away from the cell faster than it binds to and cleaves scaffold cross-links. This hypothesis is further supported by the timescales of diffusion and measured MMP degradation. As previously reported, the hydrogel scaffold is completely degraded over 24–48 h in a sample of similar dimensions using varied concentrations (0.1–0.3 mg/mL) of collagenase, a mixture of MMPs delivered in bulk solution (30). MMPs diffuse through our scaffolds with a relatively short characteristic time constant. The initial mesh size, before material degradation, is on the order of ten nanometers, and the size of MMPs is several nanometers. This allows MMPs to diffuse through the matrix with a limited hindrance. The protein diffusion time is ∼1.35 h for our gels that are 0.6 mm thick; this value is defined as , where L is the thickness of the gel and D is the protein diffusivity, calculated as cm2⋅s−1 (30, 41). Therefore, these length scales would result in a small value of because the timescale of the reaction is much slower than the rate of MMP diffusion through the gel. However, one must recognize that all of this must be placed in the context of complexities that arise from cell adhesion and traction in the scaffold during motility. This asymmetric deformation can aid in diffusion of the enzyme contributing to the extent of degradation gradient measured in the pericellular region.
This gradient can also be attributed to competitive inhibition of MMP scaffold degradation due to binding of tissue inhibitor of metalloproteinases (TIMP) to MMPs (42–45). Measurements of the kinetics of inhibition in solution show that TIMP-1 and -2 bind quickly (kon ∼ 105 M−1⋅s−1) to MMP-2 and -9 and slowly unbinds (koff ∼ 10−3 s−1) (42). This phenomenon enables the diffusion of MMPs away from the cell with no measurable degradation. As TIMP unbinds from MMPs, the scaffold cross-links will begin to degrade. This is an additional mechanism that would result in the gradient in material properties in the pericellular region.
Local Hydrogel Remodeling by hMSCs During Migration.
After culture and initial spreading of hMSCs in MMP-degradable hydrogels, significant migration begins to occur with time, and this cellular degradation and remodeling of the matrix were characterized with MPT. On shorter timescales, hMSC were observed to actively degrade and remodel the pericellular region, creating an environment in which cells not only adhere and spread, but also migrate through the material via MMP-mediated mesenchymal mechanisms. However, at longer times in this process, hMSCs completely erode the hydrogel in the pericellular region, and significantly higher levels of motility (e.g., speed) are observed, as well as a more elongated morphology. The state of the material over the entire data collection window, 45 min, is that of a viscoelastic fluid (open symbols in Fig. 2D, ), and cells in these regions are highly motile.
Spatial measurements of the material properties in the pericellular region show this transition with time (Fig. 4 A–C). It is important to note that this transition enables rapid motility of hMSCs located in these regions ( μm/h), and ballistic or directed motion of the probe particles (values of ) are measured. The enhanced particle motion indicates that there is no scaffold structure on the length scale of the probe particles, but due to particle drift quantitative material properties cannot be extracted. As the cell begins to migrate out of the field of view (Fig. 4C), we observe that the probe particles start to resume trajectories more indicative of Brownian motion, which we hypothesize is evidence that hMSC motility primarily influences local particle trajectories during this long-range migration.
Fig. 4.

Dynamic spatial rheological data of the pericellular region during cell migration. Data are taken through time at (A) 0, (B) 24, and (C) 43 min after the cell is identified. This rapidly moving cell is causing the particles to move with the cell (outlined in black) as it migrates through the acquisition window. These measurements indicate that, once the cell is spread and begins to move, the scaffold is a viscoelastic fluid.
Visualization of Cellularly Degraded Pathways After Migration in 3D Hydrogels.
Cell migration in three dimensions necessitates matrix erosion and remodeling over larger lengths scales, much greater than those measured with microrheology. To complement MPT results, confirm some of the conclusions drawn using the MPT method, and directly observe cell-mediated macroscopic remodeling of the hydrogel, a fluorescently labeled peptide was directly and isotropically tethered to the hydrogel structure to allow direct visualization of matrix erosion. Two-photon laser-scanning confocal enables 3D reconstruction of macroscopic material remodeling in hMSC-laden hydrogels. Fig. 5 shows a minimum intensity projection of a compressed z stack of a fluorescently labeled hydrogel to visualize the cell-mediated remodeling of the local matrix during hMSC migration. The cell, initially located at the large void, α, was allowed to migrate for a period of 48 h resulting in a final spatial position, β, and a distance to origin of 175 μm. The final position, β, of the cell can be clearly seen in the complementary bright-field image (Fig. 5B) of the same region. In this image, the initial position of the cell is circled by a dashed line to highlight the total migrated distance. The black regions in the fluorescent image (Fig. 5A) represent voids created in the network, as the cell locally remodels and degrades the matrix. These representative images demonstrate that migrating cells lead to large matrix remodeling and erosion in three dimensions. MPT captures aspects of these tracks in the pericellular space, and this can be directly observed on the macroscale as tracks and tunnels that allow long-range motility of hMSCs within covalently cross-linked network. Certain regions of the cell track tunnel (e.g., near the final location of the cell) are on a smaller size scale than cannot be visualized using this method. As both the gel and the cells are deformable, cellular translocation can still occur within these regions despite the small size scale of the pores. Additionally, after a cell has migrated through these small tunnels, local hydrogel swelling and the limitations of visualizing dark regions within a highly fluorescent image may reduce the ability to image void regions. Measuring and characterizing this erosion provides fundamental insight into cell migration, the links between matrix remodeling and migration mechanisms, as well as strategies to direct cell migration through biophysical and biochemical scaffold design.
Fig. 5.
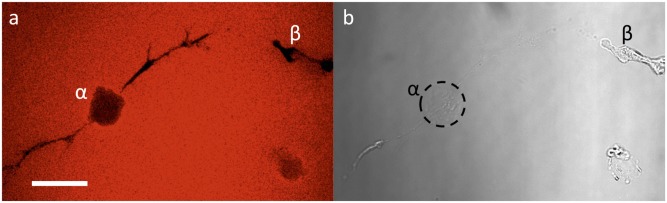
Fluorescently labeled hydrogels allow for the visualization of cell-mediated remodeling during migration. (A) A minimum intensity projection of a compressed z stack of a fluorescently labeled (AF-546) hydrogel permits visualization of the void (black) regions present in the gel from cellular degradation and remodeling. Over 48 h, the cell migrated 175 μm from its original location, α, to its final location, β. Void tracks from cell spreading and migration can be seen developing off of this spherical void. (B) The bright-field image depicts the initial cell location after polymerization circled with a dashed line, α, and the cell is located at its final position, β, after 48 h of migration. (Scale bar: 50 μm.)
Conclusions
Microrheological measurements were used to quantify cell–matrix interactions during 3D hMSC migration. MPT has proven to be a valuable technique to determine the state of cell-mediated scaffold remodeling in the pericellular region with a sensitivity to discriminate between areas of cell adhesion and cell-mediated scaffold degradation. Here, we measured degradation processes on two timescales for hMSCs encapsulated in three dimensions. On the short timescale, we observed the initial stages of cell-mediated degradation and cell spreading, and that the scaffold was fully degraded in areas farther away from the cell. These observations were attributed to the small Damköhler number (i.e., the diffusion timescale is much faster than the reaction timescale) of cell-secreted MMPs. PIV was used to characterize particle movement over time intervals of 4–5 min on length scales greater than those accessible by MPT. PIV measured persistent particle movement in regions farther away from the cell, likely due to cytoskeletal tension on the scaffold. At longer timescales, the pericellular region near the hMSCs is a viscoelastic fluid that cells can rapidly migrate through. This microscopic material degradation is the initiation of much larger macroscopic scaffold reengineering that ultimately results in irreversible tracks that are eroded in the scaffold. Collectively, these methods and results provide links that should help the field better understand the outside-in signaling that a cell experiences during migration, advance the development of biomaterials that manipulate basic cellular processes, and improve strategies for biomaterial design for regenerative-medicine, wound-healing, and 3D cell culture applications.
Materials and Methods
Hydrogel Scaffold.
All measurements were taken in a photopolymerizable thiol–ene network creating a chemically cross-linked MMP-degradable PEG hydrogel scaffold. Polymer functionalization was performed as described previously (36, 46). Briefly, the four-arm PEG molecule (, 20,000 g⋅mol−1; ; JenKem) is end functionalized with norbornene () and is reacted with an MMP-degradable peptide (KCGPQG IWGQCK; , 1,305 g⋅mol−1; ). This peptide is highly degradable, easily cleaved by cell secreted MMPs, and has been previously used to study 3D cellular migration (12, 14). An adhesion ligand, CRGDS (, 594 g⋅mol−1), is tethered to the network to promote adhesion and migration by binding to integrin receptors (47). The reaction is initiated by a highly water-soluble initiator, lithium phenyl-2,4,6-trimethylbenzoylphosphinate (LAP), and a 365-nm light source (46). Carboxylated fluorescently labeled probe particles ( 1.02 0.03 μm; Polysciences) are triple washed by centrifugation and resuspension in deionized water before being incorporated into the precursor solution to enable passive microrheological measurements. The hydrogel composition used for all experiments was 3 mM (7.2 1018 -ene functional groups) PEG-norbornene, 3.9 mM (4.7 1017 -SH functional groups) MMP-degradable peptide, 1 mM CRGDS, 0.04 (solids per volume) probe particles, and 2 105 hMSCs per mL with all components dissolved in 1× Dulbecco’s PBS (1× PBS; Life Technologies). This composition is chosen due to previous success studying hMSC migration (14). Hydrogels are formed in sample chambers (described below), ensuring that the gel has sufficient room to swell during incubation.
Device Fabrication and 3D Cell Encapsulation.
Hydrogels with encapsulated hMSCs are made in a device that enables MPT measurements. This device reduces drift of the probe particle as the hydrogel scaffold degrades and enables incubation of the encapsulated hMSCs during data collection. The device consists of a glass-bottom Petri dish (d = 0.35 mm, no. 1.5 glass coverslip; MatTek) with a polydimethylsiloxane (PDMS) (Dow Corning) chamber attached to the glass slide. The PDMS chamber is made using manufacturer’s instructions, namely, 10:1 silicone elastomer base:cross-linking agent. PDMS is degassed and cured in a flat sheet overnight for 65° C. The cured PDMS is cut using two biopsy punches and creates a circular chamber with an inner diameter of 6 mm and an outer diameter of 10 mm. The chamber is attached to the glass bottom using uncured PDMS and incubating at 65° C overnight. The sample chambers are sterilized with ethanol and UV light before cell-laden hydrogel formation. Hydrogels are made using the concentrations described above and are cured under UV light (365 nm, 10 mW⋅cm−2) for 3 min in a sterile hood. The volume of the gel created in the samples is adjusted to 17 μL, enabling complete swelling. Samples are incubated overnight before data acquisition.
hMSC Culture and Inhibitor Treatment.
hMSCs were isolated from bone marrow aspirates (Lonza). The isolation and freezing procedure are described previously (14). Cells were passaged, and passages 2 and 3 were used for each experiment.
MPT and PIV Measurements.
MPT was used to measure the material properties of the hydrogel scaffold during hMSC migration. MPT is a passive microrheological technique in which the Brownian motion of probe particles is measured and related to rheological properties using the GSER. Data are collected using optical video microscopy enabling simultaneous measurements of dynamic material properties, such as cell-mediated scaffold degradation, and visualization of the microenvironment. Data were taken using an inverted microscope (Nikon TE2000E; Nikon Instruments) with a low–numerical-aperture oil-immersion objective at 60× magnification (N.A., 1.4; 1× optovar; Nikon Instruments). An incubation chamber is connected to the microscope maintaining samples at 37° C and 5% CO2 to ensure cells remain healthy during data collection. Data were collected at 30 frames per s for 800 frames (≈ 27 s) and an exposure time of 1 ms (CMOS high-speed camera; Hi-Spec 3; 1,024 × 1,280 pixels; Fastec Imaging Corporation), parameters chosen to minimize the effects of static and dynamic particle tracking errors (29).
MPT measurements were collected of an area directly around a migrating hMSC, the pericellular region. This was done by first identifying a cell using bright-field microscopy. An image of each cell was collected with bright-field microscopy immediately before fluorescence MPT data were taken. Approximately 10 movies were collected in the pericellular region of each cell over approximately an hour. Particle tracking was performed using classic tracking algorithms developed by Crocker and Grier and maintained by Weeks (26, 28) that identify the brightness-weighted centroid of each particle and link the positions together in each frame to create a trajectory. From these data, the MSD of the probe particles was calculated and used to identify the state of the material (30). For each condition, three biological replicates were measured. Within the biological replicates, two separate gel stock solutions were measured over 2 d with two to three gels made per solution. Hydrogels were also measured in the absence of cells. These gels were made and incubated in an identical manner to cell-laden hydrogels and showed no significant scaffold degradation when incubated.
PIV analysis was performed on bright-field images taken of the same observation window as MPT data. Iterative PIV analysis was done using ImageJ (NIH Image) and the PIV plugin (48). In this analysis, the image is broken up into smaller interrogations windows, and the cross-correlation between particle movements in these windows is identified and plotted.
Visualizing Cell Tracks in Hydrogel.
For visualizing cell tracks present in the scaffolds, CRGDS was fluorescently labeled with Alexa Fluor 546 succinimidyl ester (AF546-NHS). Briefly, AF546-NHS was dissolved in dimethyl formamide and reacted overnight with the peptide before cleavage from the resin. The fluorescently labeled peptide was then introduced into the macromer solution before photopolymerization at 1 mM. hMSC encapsulation and hydrogel formation were performed as discussed above. After 48 h, z-stack images were taken using an LSM 710 confocal microscope (Carl Zeiss) at a step size of 0.78 μm. The z stacks were compressed, and a minimum intensity projection was created using ImageJ (NIH Image). Images presented within the manuscript were cropped and adjusted for contrast and brightness for better illustration of cell tracks.
Fig. S1.

Dynamic rheological changes in the pericellular region during migration of an encapsulated hMSC over time. Data are taken at (A) 0, (B) 24, and (C) 43 min after the cell is identified. Particle image velocimetry (PIV) measurements quantify the long-time displacement of probe particles between (D) 0 and 5, (E) 19 and 24, and (F) 38 and 43 min. Every other particle trajectory is displayed on PIV plots for clarity. Bright-field images are set in the background of MPT measurements with MSD values calculated spatially as the distance away from the cell. The z axis, indicated by color, is the logarithmic slope of the MSD, α, where a slope of 0 (red) indicates no particle movement, a slope of 1 (light blue) indicates Brownian motion, and a slope of 1.6 (purple) indicates ballistic motion. PIV measurements show the displacements using color and size of arrows. Warm colors and small arrows indicate small particle displacement, whereas cool colors and large arrows show large particle displacement. This rapidly moving cell is causing the particles to move with the cell as it migrates through the acquisition window. These measurements indicate that, once the cell is spread and begins to move, the scaffold is a viscoelastic fluid on the measurement length scale of 1 μm.
Fig. S2.

Dynamic spatial rheological data of the pericellular region during cell migration. Data are taken through time at (A) 0, (B) 19, (C) 33, (D) 38, and (E) 43 min after the cell is identified. Particle image velocimetry (PIV) measurements quantify the long-time displacement of probe particles between (F) 0 and 5, (G) 15 and 19, (H) 29 and 33, (I) 33 and 38, and (J) 38 and 43 min. In the bright-field images, a second cell can be seen that is not in the measurement field of view. MPT tracks particles in two dimensions; therefore, any changes in material properties due to the second cell’s movement are not part of our measurement and we do not measure any additional degradation. Both of these measurements confirm that, through time as the cell is spreading, the largest extent of degradation occurs furthest from the cell.
Fig. S3.

Dynamic spatial rheological data of the pericellular region during cell migration. Data are taken through time at (A) 0, (B) 28, (C) 33, (D) 37, and (E) 52 min after the cell is identified. Particle image velocimetry (PIV) measurements quantify the long-time displacement of probe particles between (F) 0 and 5, (G) 24 and 28, (H) 28 and 33, (I) 33 and 37, and (J) 37 and 52 min. Both of these measurements confirm that, through time as the cell is spreading, the largest extent of degradation occurs furthest from the cell.
Fig. S4.

Heterogeneity analysis of pericellular region during cellular remodeling and motility. An F test with a 95% confidence interval is used to determine whether particles are probing the same microenvironment. Each particle trajectory is tested against the remaining particles to determine whether these trajectories are statistically similar, indicating that the particle is probing the same microenvironment. Particles that have trajectories that are statistically similar are clustered together and color-coded. The colors of the particles only indicate particles belong to the same statistical cluster within that trajectory map. Similar colors between different graphs do not indicate similar particle movement, and these colors do not represent α values in MPT measurements. These trajectory maps correspond to a cell that is actively degrading the microenvironment (A–C) and a cell that is highly motile after scaffold degradation (D–F) with the same pericellular regions presented in Figs. 3 A–F and 4 A–C, respectively. Data are taken at (A) 0, (B) 9, (C) 27, (D) 0, (E) 24, and (F) 43 min after the cells were identified.
Acknowledgments
We acknowledge Dr. Jennifer Leight for helpful discussion. Funding for this work was provided by Howard Hughes Medical Institute, the National Science Foundation (CTS 1236662), and the National Institutes of Health (RO1DE016523).
Footnotes
The authors declare no conflict of interest.
This article contains supporting information online at www.pnas.org/lookup/suppl/doi:10.1073/pnas.1511304112/-/DCSupplemental.
References
- 1.Slaughter BV, Khurshid SS, Fisher OZ, Khademhosseini A, Peppas NA. Hydrogels in regenerative medicine. Adv Mater. 2009;21(32-33):3307–3329. doi: 10.1002/adma.200802106. [DOI] [PMC free article] [PubMed] [Google Scholar]
- 2.Hubbell JA. Biomaterials in tissue engineering. Biotechnology (N Y) 1995;13(6):565–576. doi: 10.1038/nbt0695-565. [DOI] [PubMed] [Google Scholar]
- 3.Peppas NA, Langer R. New challenges in biomaterials. Science. 1994;263(5154):1715–1720. doi: 10.1126/science.8134835. [DOI] [PubMed] [Google Scholar]
- 4.Kloxin AM, Kloxin CJ, Bowman CN, Anseth KS. Mechanical properties of cellularly responsive hydrogels and their experimental determination. Adv Mater. 2010;22(31):3484–3494. doi: 10.1002/adma.200904179. [DOI] [PMC free article] [PubMed] [Google Scholar]
- 5.Hern DL, Hubbell JA. Incorporation of adhesion peptides into nonadhesive hydrogels useful for tissue resurfacing. J Biomed Mater Res. 1998;39(2):266–276. doi: 10.1002/(sici)1097-4636(199802)39:2<266::aid-jbm14>3.0.co;2-b. [DOI] [PubMed] [Google Scholar]
- 6.DeLong SA, Moon JJ, West JL. Covalently immobilized gradients of bFGF on hydrogel scaffolds for directed cell migration. Biomaterials. 2005;26(16):3227–3234. doi: 10.1016/j.biomaterials.2004.09.021. [DOI] [PubMed] [Google Scholar]
- 7.Lutolf MP, et al. Synthetic matrix metalloproteinase-sensitive hydrogels for the conduction of tissue regeneration: Engineering cell-invasion characteristics. Proc Natl Acad Sci USA. 2003;100(9):5413–5418. doi: 10.1073/pnas.0737381100. [DOI] [PMC free article] [PubMed] [Google Scholar]
- 8.Patterson J, Hubbell JA. Enhanced proteolytic degradation of molecularly engineered PEG hydrogels in response to MMP-1 and MMP-2. Biomaterials. 2010;31(30):7836–7845. doi: 10.1016/j.biomaterials.2010.06.061. [DOI] [PubMed] [Google Scholar]
- 9.Lin CC, Boyer PD, Aimetti AA, Anseth KS. Regulating MCP-1 diffusion in affinity hydrogels for enhancing immuno-isolation. J Control Release. 2010;142(3):384–391. doi: 10.1016/j.jconrel.2009.11.022. [DOI] [PMC free article] [PubMed] [Google Scholar]
- 10.Discher DE, Janmey P, Wang YL. Tissue cells feel and respond to the stiffness of their substrate. Science. 2005;310(5751):1139–1143. doi: 10.1126/science.1116995. [DOI] [PubMed] [Google Scholar]
- 11.Engler AJ, Sen S, Sweeney HL, Discher DE. Matrix elasticity directs stem cell lineage specification. Cell. 2006;126(4):677–689. doi: 10.1016/j.cell.2006.06.044. [DOI] [PubMed] [Google Scholar]
- 12.Schwartz MP, et al. A synthetic strategy for mimicking the extracellular matrix provides new insight about tumor cell migration. Integr Biol (Camb) 2010;2(1):32–40. doi: 10.1039/b912438a. [DOI] [PMC free article] [PubMed] [Google Scholar]
- 13.Anderson SB, Lin CC, Kuntzler DV, Anseth KS. The performance of human mesenchymal stem cells encapsulated in cell-degradable polymer-peptide hydrogels. Biomaterials. 2011;32(14):3564–3574. doi: 10.1016/j.biomaterials.2011.01.064. [DOI] [PMC free article] [PubMed] [Google Scholar]
- 14.Kyburz KA, Anseth KS. Three-dimensional hMSC motility within peptide-functionalized PEG-based hydrogels of varying adhesivity and crosslinking density. Acta Biomater. 2013;9(5):6381–6392. doi: 10.1016/j.actbio.2013.01.026. [DOI] [PMC free article] [PubMed] [Google Scholar]
- 15.Tan JL, et al. Cells lying on a bed of microneedles: An approach to isolate mechanical force. Proc Natl Acad Sci USA. 2003;100(4):1484–1489. doi: 10.1073/pnas.0235407100. [DOI] [PMC free article] [PubMed] [Google Scholar]
- 16.Tambe DT, et al. Collective cell guidance by cooperative intercellular forces. Nat Mater. 2011;10(6):469–475. doi: 10.1038/nmat3025. [DOI] [PMC free article] [PubMed] [Google Scholar]
- 17.Wolf K, Friedl P. Mapping proteolytic cancer cell-extracellular matrix interfaces. Clin Exp Metastasis. 2009;26(4):289–298. doi: 10.1007/s10585-008-9190-2. [DOI] [PubMed] [Google Scholar]
- 18.Wolf K, et al. Multi-step pericellular proteolysis controls the transition from individual to collective cancer cell invasion. Nat Cell Biol. 2007;9(8):893–904. doi: 10.1038/ncb1616. [DOI] [PubMed] [Google Scholar]
- 19.Wolf K, et al. Physical limits of cell migration: Control by ECM space and nuclear deformation and tuning by proteolysis and traction force. J Cell Biol. 2013;201(7):1069–1084. doi: 10.1083/jcb.201210152. [DOI] [PMC free article] [PubMed] [Google Scholar]
- 20.Packard BZ, Artym VV, Komoriya A, Yamada KM. Direct visualization of protease activity on cells migrating in three-dimensions. Matrix Biol. 2009;28(1):3–10. doi: 10.1016/j.matbio.2008.10.001. [DOI] [PMC free article] [PubMed] [Google Scholar]
- 21.Legant WR, et al. Measurement of mechanical tractions exerted by cells in three-dimensional matrices. Nat Methods. 2010;7(12):969–971. doi: 10.1038/nmeth.1531. [DOI] [PMC free article] [PubMed] [Google Scholar]
- 22.Guvendiren M, Burdick JA. Engineering synthetic hydrogel microenvironments to instruct stem cells. Curr Opin Biotechnol. 2013;24(5):841–846. doi: 10.1016/j.copbio.2013.03.009. [DOI] [PMC free article] [PubMed] [Google Scholar]
- 23.Bloom RJ, George JP, Celedon A, Sun SX, Wirtz D. Mapping local matrix remodeling induced by a migrating tumor cell using three-dimensional multiple-particle tracking. Biophys J. 2008;95(8):4077–4088. doi: 10.1529/biophysj.108.132738. [DOI] [PMC free article] [PubMed] [Google Scholar]
- 24.Alkhouli N, et al. The mechanical properties of human adipose tissues and their relationships to the structure and composition of the extracellular matrix. Am J Physiol Endocrinol Metab. 2013;305(12):E1427–E1435. doi: 10.1152/ajpendo.00111.2013. [DOI] [PubMed] [Google Scholar]
- 25.Khetan S, et al. Degradation-mediated cellular traction directs stem cell fate in covalently crosslinked three-dimensional hydrogels. Nat Mater. 2013;12(5):458–465. doi: 10.1038/nmat3586. [DOI] [PMC free article] [PubMed] [Google Scholar]
- 26.Crocker JC, Grier DG. Methods of digital video microscopy for colloidal studies. J Colloid Interface Sci. 1996;179(1):298–310. [Google Scholar]
- 27.Mason TG, Ganesan K, van Zanten JH, Wirtz D, Kuo SC. Particle tracking microrheology of complex fluids. Phys Rev Lett. 1997;79(17-21):3282–3285. [Google Scholar]
- 28.Crocker JC, Weeks ER. Particle tracking using IDL. 2011 Available at www.physics.emory.edu/faculty/weeks//idl. Accessed March 7, 2011.
- 29.Savin T, Doyle PS. Static and dynamic errors in particle tracking microrheology. Biophys J. 2005;88(1):623–638. doi: 10.1529/biophysj.104.042457. [DOI] [PMC free article] [PubMed] [Google Scholar]
- 30.Schultz KM, Anseth KS. Monitoring degradation of matrix metalloproteinases-cleavable PEG hydrogels via multiple particle tracking microrheology. Soft Matter. 2013;9:1570–1579. [Google Scholar]
- 31.Schultz KM, et al. Capturing the comprehensive modulus profile and reverse percolation transition of a degrading hydrogel. Macro Lett. 2012;1(6):706–708. doi: 10.1021/mz300106y. [DOI] [PMC free article] [PubMed] [Google Scholar]
- 32.Adolf D, Martin JE. Time-cure superposition during crosslinking. Macromolecules. 1990;23(15):3700–3704. [Google Scholar]
- 33.Winter HH, Chambon F. Analysis of linear viscoelasticity of a crosslinking polymer at the gel point. J Rheol. 1986;30(2):367–382. [Google Scholar]
- 34.Schultz KM, Furst EM. Microrheology of biomaterial hydrogelators. Soft Matter. 2012;8:6198–6205. [Google Scholar]
- 35.Aimetti AA, Machen AJ, Anseth KS. Poly(ethylene glycol) hydrogels formed by thiol-ene photopolymerization for enzyme-responsive protein delivery. Biomaterials. 2009;30(30):6048–6054. doi: 10.1016/j.biomaterials.2009.07.043. [DOI] [PMC free article] [PubMed] [Google Scholar]
- 36.Fairbanks BD, et al. A versatile synthetic extracellular matrix mimic via thiol-norbornene photopolymerization. Adv Mater. 2009;21(48):5005–5010. doi: 10.1002/adma.200901808. [DOI] [PMC free article] [PubMed] [Google Scholar]
- 37.Raeber GP, Lutolf MP, Hubbell JA. Molecularly engineered PEG hydrogels: A novel model system for proteolytically mediated cell migration. Biophys J. 2005;89(2):1374–1388. doi: 10.1529/biophysj.104.050682. [DOI] [PMC free article] [PubMed] [Google Scholar]
- 38.Kienberger F, et al. Static and dynamical properties of single poly(ethylene glycol) molecules investigated by force spectroscopy. Single Mol. 2000;1(2):123–128. [Google Scholar]
- 39.Miller JS, et al. Bioactive hydrogels made from step-growth derived PEG-peptide macromers. Biomaterials. 2010;31(13):3736–3743. doi: 10.1016/j.biomaterials.2010.01.058. [DOI] [PMC free article] [PubMed] [Google Scholar]
- 40.Yang YL, Leone LM, Kaufman LJ. Elastic moduli of collagen gels can be predicted from two-dimensional confocal microscopy. Biophys J. 2009;97(7):2051–2060. doi: 10.1016/j.bpj.2009.07.035. [DOI] [PMC free article] [PubMed] [Google Scholar]
- 41.Weber LM, Lopez CG, Anseth KS. Effects of PEG hydrogel crosslinking density on protein diffusion and encapsulated islet survival and function. J Biomed Mater Res A. 2009;90(3):720–729. doi: 10.1002/jbm.a.32134. [DOI] [PMC free article] [PubMed] [Google Scholar]
- 42.Olson MW, Gervasi DC, Mobashery S, Fridman R. Kinetic analysis of the binding of human matrix metalloproteinase-2 and -9 to tissue inhibitor of metalloproteinase (TIMP)-1 and TIMP-2. J Biol Chem. 1997;272(47):29975–29983. doi: 10.1074/jbc.272.47.29975. [DOI] [PubMed] [Google Scholar]
- 43.Lozito TP, Tuan RS. Mesenchymal stem cells inhibit both endogenous and exogenous MMPs via secreted TIMPs. J Cell Physiol. 2011;226(2):385–396. doi: 10.1002/jcp.22344. [DOI] [PubMed] [Google Scholar]
- 44.Reed MJ, Koike T, Sadoun E, Sage EH, Puolakkainen P. Inhibition of TIMP1 enhances angiogenesis in vivo and cell migration in vitro. Microvasc Res. 2003;65(1):9–17. doi: 10.1016/s0026-2862(02)00026-2. [DOI] [PubMed] [Google Scholar]
- 45.Mascall KS, Small GR, Gibson G, Nixon GF. Sphingosine-1-phosphate-induced release of TIMP-2 from vascular smooth muscle cells inhibits angiogenesis. J Cell Sci. 2012;125(Pt 9):2267–2275. doi: 10.1242/jcs.099044. [DOI] [PubMed] [Google Scholar]
- 46.Fairbanks BD, Schwartz MP, Bowman CN, Anseth KS. Photoinitiated polymerization of PEG-diacrylate with lithium phenyl-2,4,6-trimethylbenzoylphosphinate: Polymerization rate and cytocompatibility. Biomaterials. 2009;30(35):6702–6707. doi: 10.1016/j.biomaterials.2009.08.055. [DOI] [PMC free article] [PubMed] [Google Scholar]
- 47.Nuttelman CR, Tripodi MC, Anseth KS. Synthetic hydrogel niches that promote hMSC viability. Matrix Biol. 2005;24(3):208–218. doi: 10.1016/j.matbio.2005.03.004. [DOI] [PubMed] [Google Scholar]
- 48.Tseng Q. PIV (Particle Image Velocimetry)—ImageJ plugin. 2014 Available at https://sites.google.com/site/qingzongtseng/piv. Accessed November 28, 2014.