

Significance
Osteoporosis is a morbid disease afflicting millions of people worldwide. To unlock the unique regenerative powers of the skeleton that have not yet been exploited, we used stem cell gene therapy to dramatically increase bone formation at sites where bone is lost during osteoporosis. Our therapy tremendously increased de novo trabecular bone formation and trabecular connections, resulting in a large increase in bone strength. Our therapy has clinical potential, may serve as a prototype for future skeletal stem cell gene therapies, and is a model for mechanistic studies of de novo trabecular bone formation.
Keywords: PDGFB, hematopoietic stem cells, bone formation, gene therapy
Abstract
Substantial advances have been made in the past two decades in the management of osteoporosis. However, none of the current medications can eliminate the risk of fracture and rejuvenate the skeleton. To this end, we recently reported that transplantation of hematopoietic stem/progenitor cells (HSCs) or Sca1+ cells engineered to overexpress FGF2 results in a significant increase in lamellar bone matrix formation at the endosteum; but this increase was attended by the development of secondary hyperparathyroidism and severe osteomalacia. Here we switch the therapeutic gene to PDGFB, another potent mitogen for mesenchymal stem cells (MSCs) but potentially safer than FGF2. We found that modest overexpression of PDGFB using a relatively weak phosphoglycerate kinase (PGK) promoter completely avoided osteomalacia and secondary hyperparathyroidism, and simultaneously increased trabecular bone formation and trabecular connectivity, and decreased cortical porosity. These effects led to a 45% increase in the bone strength. Transplantation of PGK-PDGFB–transduced Sca1+ cells increased MSC proliferation, raising the possibility that PDGF-BB enhances expansion of MSC in the vicinity of the hematopoietic niche where the osteogenic milieu propels the differentiation of MSCs toward an osteogenic destination. Our therapy should have potential clinical applications for patients undergoing HSC transplantation, who are at high risk for osteoporosis and bone fractures after total body irradiation preconditioning. It could eventually have wider application once the therapy can be applied without the preconditioning.
Osteoporosis is a major public health problem in the United States and in the world. Currently, there are almost 10 million osteoporosis-related fractures annually worldwide (1). Over the past two decades, the treatment of osteoporosis has advanced dramatically, primarily because of the successful development of several effective antiresorptive therapies (2), which can reduce the fracture rate by as much as 50% (3). An anabolic therapy, namely parathyroid hormone (PTH), was subsequently developed and approved by the Food and Drug Administration. This therapy increases bone formation as opposed to antiresorptive drugs that reduce bone resorption, but the efficacy of this anabolic therapy in terms of fracture reduction has been the same as that of antiresorptive drugs (4). Multiple newer and more potent anabolic agents are currently being evaluated in clinical trials (5–7), but none of these entities appear to have the potential to rejuvenate the osteoporotic skeleton back to one with normal bone density and strength.
All of the aforementioned medications fall into the realm of pharmaceutical or biologic therapies. However, we have now entered the era of the third pillar of medicine: cell therapy (8). “Cells uniquely sense their surroundings, make decisions and exhibit varied and regulable behaviors,” such as targeting (8). In this regard, we have initiated the development of an anabolic cell therapy for the skeleton (9). Our past work has focused on establishing proof-of-principle for this approach in the mouse model, using genetically engineered hematopoietic stem/progenitor (HSC) cell therapy, which could be given intravenously and would result in rejuvenation of the skeleton (9). We have shown engraftment of donor HSCs that were genetically engineered to overexpress FGF2 at sites where bone is lost in osteoporosis (i.e., the HSC niches), which in turn resulted in substantial augmentation of bone matrix formation at these sites (9). Despite these advances, we encountered several issues that severely compromised the efficacy of our therapy. Instead of being stronger, the resulting bones were actually weaker and sometimes fractured during tissue processing. This was associated with severe hypocalcemia, secondary hyperparathyroidism, and osteomalacia developed in response to the therapy.
In the present study, we sought to resolve these adverse side effects. Two changes in our therapy were made compared with our previous work. First, we switched the therapeutic gene from FGF2 to PDGFB, because PDGF-BB is normally secreted after platelet activation and circulates at concentrations that are some 100-times higher than FGF2 (and thus could be safer). We use the term PDGFB to refer the gene that encodes the human platelet-derived growth factor (PDGF) B chain, and the term PDGF-BB to refer the homodimeric protein. PDGF-BB is a major growth factor found in bone matrix (10) and has also been shown to increase bone formation after intravenous administration (11). In addition, there have been considerable successful applications of PDGF-BB–based therapies on various types of maladies, including tendon, periodontal ligament, and bone fracture repairs (12, 13). The safety of PDGF-BB has been demonstrated in several clinical trials (14, 15), and it has been approved by the Food and Drug Administration for treatment of patients with oral and maxillofacial bony defects (15). Second, we used various promoters of different strengths to express PDGFB to identify the optimal PDGF-BB dosage. In the present study, we showed that when a relatively weak physiologic promoter (i.e., phosphoglycerate kinase or PGK promoter) was used, the therapy yielded marked increases in endosteal/trabecular bone formation without significant elevation in the circulating level of PDGF-BB. It also avoided adverse effects, such as osteomalacia, and led to a 45% increase in bone strength (maximal load to failure). In this respect, no traditional monotherapy for osteoporosis has shown long-term beneficial effect on the bone strength of the treated bone (16). Moreover, our therapy uniquely produced a 20-fold increase in trabecular connectivity and substantial reduction in cortical porosity, both of which are relevant to the bone mechanical performance.
Results
Transplantation with Lenti-SFFV-PDGFB–Transduced Sca1+ Cells Leads to Massive Endosteal/Trabecular Bone Formation but also Induces Osteomalacia.
Our cell-based therapy consists of isolation of HSCs from a donor mouse, genetically engineering these cells to overexpress PDGFB, and transplantation of these modified HSCs into a syngeneic recipient mouse after irradiation (Fig. 1A) (9). HSCs are used as a vehicle because these cells specifically target to the HSC niche at the endosteal bone surface and the HSC niches at the marrow vascular surfaces: the two major sites of bone loss in humans with osteoporosis. We first used a strong promoter, spleen focus-forming virus (SFFV), to overexpress PDGFB. Four weeks following transplantation with Lenti-SFFV-PDGFB–transduced Sca1+ cells, the femoral bone mineral density (BMD) was significantly greater than that of control mice (325 mg/cm3 vs. 135 mg/cm3, P < 0.01) (Fig. 1B). However, the von Kossa staining, which stains mineralized bone (17), reveals that the newly formed bone was largely unmineralized (Fig. 1 C and D). When we stratified the PDGFB-treated mice into the low-serum PDGF-BB (<1,000 pg/mL) and the high-serum PDGF-BB (>1,000 pg/mL) subgroups, the BMD of the low-serum PDGF-BB group was significantly higher than that of the high-serum PDGF-BB group (402 vs. 290 mg/cm3, P < 0.05) (Fig. 1E). These data indicate that the PDGFB-based HSC cell therapy promotes de novo trabecular bone formation in the mouse, but high levels of PDGF-BB have unintended negative effects on BMD.
Fig. 1.

Transplantation with Lenti-SFFV-PDGFB–transduced Sca1+ cells leads to massive endosteal/trabecular bone formation but also induces osteomalacia. (A) Schematic representation of the experimental design. (B) Femoral trabecular BMD (determined by pQCT) at 4 wk after transplantation. **P < 0.01. Control group: n = 8; SFFV-PDGFB group: n = 13. (C) Von Kossa staining of frozen sections of femur from SFFV-PDGFB–treated or control mice. Black color: mineralized bone. (Scale bar, 200 μm.) (D) High-magnification images of Von Kossa staining. Osteomalacia-like phenotype was seen in SFFV-PDGFB–treated mice (indicated by an asterisk). Dash lines indicate the edge of osteoid. Red arrows indicate the osteoid width. (Scale bar, 100 μm.) (E) pQCT data from SFFV-PDGFB–treated animals was stratified into the low-serum PDGF-BB group (200–600 pg/mL, n = 4) and the high-serum PDGF-BB group (1,000–3,000 pg/mL, n = 9). *P < 0.05.
Optimal PDGFB Expression Driven by a Weaker Promoter Promotes Endosteal/Trabecular Bone Formation Without Osteomalacia or Secondary Hyperparathyroidism.
Because mice with low-level serum PDGF-BB showed higher BMD, we decided to reduce PDGFB expression by using two weaker promoters: that is, the PGK promoter (∼500 bp in length) and the truncated PGK promoter, P200 (∼200 bp in length) (Fig. S1). The P200 truncated promoter is less potent compared with the original PGK promoter. To assess relative potency of these different promoters in Sca1+ cells, we used GFP as the reporter gene. Sca1+ cells were transduced with the Lenti SFFV-GFP, PGK-GFP, or P200-GFP, each at the same low multiplicity of infection (MOI) of 0.1. A low MOI was used because it would allow a better comparison of the transduction efficiency among strong and weak promoters. As shown in Fig. 2A, the transduction efficiency for the three test vectors in Sca1+ cells was very similar (i.e., ∼4% in each transduced cell population). As expected, the level of GFP expression driven by the PGK promoter was ∼85% lower than that driven by the SFFV promoter (15% vs. 100%), and the GFP expression level controlled by the P200 promoter was ∼50% lower than PGK promoter (9% vs. 15%) (Fig. 2B).
Fig. S1.
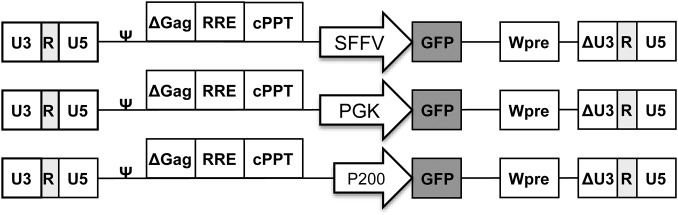
Schematic representation of the lentiviral vectors. Δ Represents the self-inactivation design by partially deleting the U3 domain of the 3′ long terminal repeat. cPPT, central polypurine tract; RRE, rev-responsive element; Wpre, posttranscriptional regulatory element; ψ, packaging signal.
Fig. 2.

Optimal PDGFB transgene expression with the PGK promoter increases serum ALP levels. (A) FACS analysis of the transduction efficiency of Sca1+ cells with Lenti SFFV-GFP, PGK-GFP, or P200-GFP, each at the MOI of 0.1. (B) Quantitative analysis of GFP intensity. *P < 0.05. (C) Serum PDGF-BB levels in each test group of animals at 5 wk posttransplantation. ***P < 0.001. n = 8 per group. (D) Serum ALP activity in recipient mice after transplantation of Lenti-GFP–, Lenti-PGK-PDGFB–, or Lenti-P200-PDGFB–transduced Sca1+ cells. *P < 0.05. n = 8 per group. (E, Left) Cytochemical staining of ALP activity on femur frozen sections. (Scale bar, 200 μm.) (Right) Quantification of ALP surface showed a significant increase in the bone section of PGK-PDGFB–treated mice compared with GFP control animals. ***P < 0.001. (F) Representative images of H&E staining showed more activated osteoblasts (arrows in PGK-PDGFB group) than in control group. (Scale bar, 25 μm.)
To investigate the dosage effects of PDGF-BB on bone formation, we transduced Sca1+ cells with Lenti SFFV-PDGFB, PGK-PDGFB, P200-PDGFB, or GFP control (each at an MOI of 2). Each transduced cell population (1 × 10⁶ cells) was then transplanted into recipient mice after preconditioning with 6 Gy irradiation (n = 8 per group). At 5 wk posttransplantation, the serum PDGF-BB levels of the SFFV-PDGFB mice were two- to threefold higher than those of the GFP control mice (1,074 ± 422 vs. 342 ± 118 pg/mL, P < 0.001) (Fig. 2C). Conversely, there was no significant difference in the serum PDGF-BB level among the PGK-PDGFB group (398 ± 248 pg/mL), the P200-PDGFB group (285 ± 49 pg/mL), and the GFP control group (342 ± 118 pg/mL, P > 0.05).
Because the SFFV-PDGFB–treated mice showed severe osteomalacia, we focused on mice treated with the two PGK promoters. To monitor the dynamics of bone formation, we measured serum alkaline phosphatase (ALP) activity [a bone formation bio-marker (18)] at 5, 7, 9, and 11 wk posttransplantation (Fig. 2D). The serum ALP activity in the PGK-PDGFB group was 50% higher than that in the GFP control animals from 5 to 11 wk posttransplantation. Cytochemical staining for ALP activity in femur sections indicated that the surface of ALP-expressing osteoblast cells along the endosteal bone surface in PGK-PDGFB–treated mice was increased by ∼fivefold compared with that of the control mice (7.1 ± 2.3 vs. 1.5 ± 0.5 mm/mm2) (Fig. 2E). H&E staining showed that bone-lining cells were spindle-shaped in the control group, whereas osteoblasts in the PGK-PDGFB group were of cuboidal shape (Fig. 2F) with increased cell size (Fig. S2A), suggesting that osteoblasts in PGK-PDGFB–treated bone are highly activated. In contrast, P200-PDGFB cells transplanted femur did not show any increases in ALP activity in serum (Fig. 2D). Consistent with increased bone formation in PGK-PDGFB–treated mice, the serum levels of osteocalcin, another bone formation biomarker, in PGK-PDGFB–treated mice was ∼150% higher than that in control animals (12.1 ± 6.1 vs. 5.4 ± 1.2 ng/mL; P < 0.01) (Fig. S2B).
Fig. S2.

PGK-PDGFB treatment activates osteoblasts in vivo and increases serum osteocalcin level. (A) The size of osteoblasts is enlarged after PGK-PDGFB treatment. The size of osteoblasts was quantified from the H&E-stained bone sections. The size of osteoblasts was significantly increased in the PGK-PDGFB group compared with the control (81.8 ± 12.4 vs. 40.1 ± 18.6 ×10⁻⁶ mm2, ***P < 0.0001). (B) The serum osteocalcin level in mice of the Lenti-PGK-PDGFB group was significantly increased compared with that of the Lenti-GFP control group at 11 wk posttransplantation. **P < 0.01. n = 8 in each group.
To examine the architectural structure of the newly formed bony tissue, we performed microcomputed tomography (µCT) analysis on femurs of the Lenti-PGK-PDGFB–treated and control mice. After the PGK-PDGFB treatment, the marrow cavity at the sites of metaphysis and midshaft was packed with thick and well-connected trabeculae. In contrast, there were substantially fewer trabeculae in the metaphysis and virtually no trabeculae in the midshaft of the femur of Lenti-GFP–treated control mice (Fig. 3A). The relative trabecular bone volume (Tb.BV/TV), trabecular thickness (Tb.Th), trabecular number (Tb.N), and connectivity density (ConnD) were substantially increased in PGK-PDGFB–treated bones compared with control bones (P < 0.001 for each) (Fig. 3 B and C). De novo bone formation was seen only on the endosteal surface but not on the periosteal surface. The cortical bone volume (Ct.BV/TV) was also increased by 20–30% (Fig. 3D). Of note, the cortical porosity of PGK-PDGFB–treated bones was significantly reduced by 40% compared with control bones (4.5% ± 0.8 vs. 2.7% ± 0.2; P = 0.0003) (Fig. 3E).
Fig. 3.

PGK-PDGFB treatment promotes de novo bone formation and enhances bone strength without causing osteomalacia. (A) The μCT 3D reconstruction images of a representative femur from the GFP control mice and the PGK-PDGFB–treated mice at 12 wk posttransplantation. (Upper) The bisected longitudinal image of the femur that shows trabecular structure within the marrow cavity. (Scale bar, 1 mm) (Lower) The cross-sectional area at secondary spongiosa of distal metaphysis of the femur. (Scale bar, 200 μm.) (B and C) Summary of the trabecular bone parameters at the distal metaphysis (B) and midshaft (C) of femurs of the PGK-PDGFB group and the GFP control group. n = 6 for each group. *P < 0.05. n = 6 per group. (D and E) Cortical bone volume (D) and cortical porosity (E) were determined at the midshaft of the PGK-PDGFB group and GFP control group. ***P < 0.001. (F and G) Von Kossa staining of femurs. Increased de novo bone formation in the marrow space in the Lenti-PGK-PDGFB group was observed. (Scale bars, 500 μm in F and 100 μm in G.) (H) Quantification of osteoid width (O.Wi). ns, not significant. (I) A representative loading force displacement curve of each test group. (J and K) Maximum load-to-failure (J) and stiffness (K) was significantly increased in the PGK-PDGFB–treated femurs compared with control or P200-PDGFB–treated bones. n = 6 per group. **P < 0.01.
To investigate whether the large increase in de novo bone formation in PGK-PDGFB–treated animals would also cause incomplete mineralization of the newly formed bone (i.e., osteomalacia), we conducted Von Kossa staining on longitudinal thin bone sections. The newly formed bone in PGK-PDGFB–treated animals was mostly mineralized with similar osteoid width (O.Wi) compared with control animals (Fig. 3 F–H), indicating that the PGK-PDGFB therapy does not impair mineralization of the newly formed bone matrix. Moreover, serum levels of calcium, phosphate, PTH, and FGF23 in PGK-PDGFB–treated animals were also not significantly different from those of control animals (Fig. S3), suggesting the PGK-PDGFB treatment does not perturb serum Ca2+/Pi/PTH homeostasis in recipient mice. Taken together, these data suggest that the HSC-based PGK-PDGFB treatment does not cause hypocalcemia or secondary hyperparathyroidism, which may have attributed to the absence of impaired mineralization of the newly formed bone. The bone formation response to PDGF-BB was dose-dependent, as reduction in PDGFB expression by 50% with the use of the P200 promoter did not yield significant de novo bone formation. These data strongly suggest that maintaining an appropriate PDGF-BB dose is critically important for an optimal bone formation response that would simultaneously avoid the adverse effect of osteomalacia.
Fig. S3.

PGK-PDGFB treatment does not significantly affect serum calcium, phosphate, PTH, and FGF23 levels. (A) Serum calcium levels. Hypocalcamia was observed in the SFFV-PDGFB–treated animals, but not in the PGK-PDGFB–treated animals. (B) Serum phosphate levels. Serum phosphate levels in the SFFV-PDGFB group at 7 wk after transplantation were significantly lower than those in all of the other groups (*P < 0.05). (C) Serum PTH levels at 11 wk after transplantation. GFP control vs. PGK-PDGFB, P = 0.5, not significant. (D) Serum FGF23 levels at 11 wk after transplantation. GFP control vs. PGK-PDGFB, P = 0.5, not significant.
PGK-PDGFB Treatment Increases Bone Strength.
The mechanical strength of the bone is the ultimate predictor of fracture risks (19). To investigate whether the increase in bone formation following the PGK-PDGFB treatment can be translated into an increase in bone strength, we subjected the Lenti-PGK-PDGFB–treated and the Lenti-GFP–treated control femur to three-point bending mechanical testing. Fig. 3I shows the loading force-displacement curves of a representative femur from each test group. The PGK-PDGFB treatment caused a 45% increase in maximum load-to-failure in the midshaft of the femurs (32.0 ± 5.0 vs. 22.1 ± 4.2 N, P = 0.001) and a 46% increase in its stiffness (the slope of the force displacement curve) (265.1 ± 43.5 vs. 181.7 ± 33.5 N/mm, P = 0.0037) (Fig. 3 J and K). Femurs of the P200-PDGFB–treated group showed very similar maximal load-to-failure force (22.7 ± 3.0 vs. 22.1 ± 4.2 N, P = 0.56) and stiffness as those of femurs of the GFP control mice. Moreover, the maximum load-to-failure force correlated positively with both cortical bone mass (Ct.BV/TV) and trabecular bone mass (Tb.BV/TV) at the midshaft (R2 = 0.75, P = 0.0005 for each) (Fig. S4). These data indicate that the newly formed bone is mechanically functional and of high quality.
Fig. S4.

Correlation of maximum load-to-failure force with cortical bone volume and midshaft trabecular bone volume. (A) The maximum load-to-failure force was correlated positively to the femur cortical bone volume (Ct.BV/TV) (R2 = 0.75, P = 0.0005). (B) The maximum load-to-failure force was correlated positively with the trabecular bone volume (Tb.TV/BV) in the midshaft (R2 = 0.75, P = 0.0005).
PDGFB Treatment Promotes Proliferation of Mesenchymal Stem Cells and Angiogenesis.
Previously, we have tested several different bone growth factors in our HSC-based gene therapy regimen (9, 20, 21); only FGF2 and PDGFB are effective in increasing bone formation. There are several possible mechanisms for the effectiveness of these two growth factors, such as: (i) HSC proliferation and thereby providing a competitive proliferative advantage over the host cells, (ii) bone marrow mesenchymal stem cell (MSC) proliferation, and (iii) angiogenesis that is essential for bone formation (22, 23). To examine the effects of PDGF-BB on HSC proliferation, we cultured Sca1+ cells transduced with Lenti-PDGFB or Lenti-GFP and observed no significant difference in cell proliferation rate between the two groups after 6 d of in vitro culture (Fig. S5), ruling out this possibility.
Fig. S5.

The quantification of Sca1+ cell proliferation: 2 × 10⁵ Sca1+ cells were transduced with either control Lenti PGK-GFP or Lenti PGK-PDGFB and cultured for 6 d. There is no difference on total cell number after culture between the two groups (P = 0.16). ns, no significance.
To investigate the effects of PDGF-BB on MSC proliferation and their osteoblastic potential, we quantified MSCs and osteoblasts in the bone marrow of recipient mice at 12 wk posttransplantation using the CFU-fibroblast (F) and CFU-osteoblast (Ob) assay, respectively. There was an ∼50% and 100% increase in the CFU-F and CFU-Ob number in the marrow cells from the PGK-PDGFB–treated mice compared with the control mice (Fig. 4 A and B). We next measured the effects of PDGF-BB on proliferation of marrow-derived MSC in vitro. Bone marrow cells were cultured in MSC medium supplemented with PDGF-BB at various concentrations (0, 0.3, 3, or 30 ng/mL). Both 3 and 30 ng/mL PDGF-BB significantly increased MSC proliferation (Fig. 4C), suggesting that PDGF-BB can promote MSC expansion.
Fig. 4.

The PDGF-BB therapy promotes bone formation by increasing numbers of MSC, preosteoblasts and osteoblasts, as well as enhancing osteogenesis-related gene expression. (A) Representative images of CFU-F colonies stained with Crystal violet (Upper) and CFU-Ob colonies stained with Alizarin red (Lower). CFU-F and CFU-Ob assays were conducted with bone marrow cells harvested from GFP control or PGK-PDGFB–treated mice. (B) Quantification of the CFU-F and CFU-Ob numbers. GFP control vs. PGK-PDGFB, *P < 0.05. (C) MSC proliferation curve. GFP control vs. PDGF-BB (3 or 30 ng/mL), *P < 0.05. (D) Alizarin red staining for osteoblastic differentiation of MSCs. Bone nodule formation was enhanced by PDGF-BB protein at 0.3 ng/mL and 3 ng/mL when BMP2 was added, but reduced by PDGF-BB at 30 ng/mL. Red stained are bone nodules after 3 wk of culture in osteogenic medium. (E) Immunohistochemical staining for Runx2, Sp7, and osteocalcin on thin sections of mouse femurs. (Scale bar, 100 μm.) (F) Real-time qPCR analysis of osteogenesis-related genes in the tibias. GFP control vs. PGK-PDGFB, *P < 0.05.
We further evaluated the effects of PDGF-BB on angiogenesis by assessing relative vascularization in marrow cavity. Immunohistochemical staining of the endothelial marker, vWF, showed significantly more small vessels in the marrow cavity of PGK-PDGFB–treated mice compared with control mice (Fig. S6). These findings together suggest that increases in MSC proliferation and angiogenesis are two tenable mechanisms that might explain the effectiveness of PDGF-BB in our therapeutic regimen. However, further work is required to determine if other factors might also be contributory.
Fig. S6.

PGK-PDGFB treatment increases angiogenesis in bone marrow cavity. Provided is a low-power perspective view of vWF immunostaining on the tibial longitudinal sections (A and B) in conjunction with a higher magnification corresponding selected site from the GFP control section (C) and the PGK-PDGFB section (D). Arrows indicate areas stained positive for the vascular endothelium-specific vWF antibody. (Scales bars: 500 µm in A and B, and 100 µm in C and D.)
Optimal Doses of PDGF-BB Enhance Osteoblast Differentiation.
We next investigated the effects of PDGF-BB on osteoblastic differentiation with the in vitro bone nodule formation assay. In the absence of bone morphogenetic protein 2 (BMP2), no significant difference was seen in the number of mineralized nodules in either the 0.3 or the 3 ng/mL PDGF-BB group compared with control group, whereas nodules in the 30 ng/mL PDGF-BB groups did not mineralize. However, when BMP2 was added, substantial increases in the number of mineralized nodules were seen in cells treated with 0.3 ng/mL or 3 ng/mL PDGF-BB compared with the control group (Fig. 4D). PDGF-BB at 30 ng/mL remained to be inhibitory even in the presence of BMP2. These data suggest that PDGF-BB at optimal doses synergizes with BMP2 to enhance osteoblast differentiation. These in vitro findings are consistent with in vivo observation that optimal doses of local marrow concentration of PDGF-BB in Lenti-PGK-PDGFB–treated mice strongly induce bone formation, whereas high-level local PDGF-BB in Lenti-SFFV-PDGFB–treated mice induce osteomalacia by compromising osteoblastic differentiation of MSCs.
To further evaluate the effect of the PGK-PDGFB treatment on osteogenesis in vivo, we performed immunostaining for Runx2 and Sp7 (two transcription factors expressed by preosteoblasts), as well as osteocalcin (a marker for mature osteoblasts). As expected, expression levels of Runx2 and Sp7 as well as osteocalcin were considerably increased in PGK-PDGFB–treated femurs compared with control femurs (Fig. 4E). Expression of ALP mRNA and type Iα collagen (Col1a1) mRNA was increased sevenfold and fivefold, respectively, in the PGK-PDGF–treated femurs (Fig. 4F), strongly supporting that the PGK-PDGFB therapy enhances osteogenesis in vivo. Next, we measured the expression levels of two mediators of osteoblastic differentiation, Bmp2 and Bmp4. Both were significantly increased in the PGK-PDGFB–treated mice (Fig. 4F). To investigate whether PDGF-BB directly stimulates Bmp2 and Bmp4, we treated MSCs and MC-3T3E1 cells, an osteoblast progenitor cell line, with or without PDGF-BB. Quantitative RT-PCR (RT-qPCR) analysis showed that PDGF-BB did not increase expression of Bmp2 or Bmp4 in either MSCs or MC-3T3E1 cells (Figs. S7 and S8). To assess the effects of PGK-PDGFB treatment on osteoblast proliferation and the Bmp-mediated osteoblast differentiation in vivo, we stained Ki-67 (a proliferation marker) and pSmad1/5 (a major downstream mediator of Bmp2 signaling) in femur sections. There was a marked increase in Ki-67+ cell number in the marrow space of femur of the PGK-PDGFB group compared with the control group. Similarly, there were also substantially more pSmad1/5-expressing cells in PGK-PDGFB group compared with control group (Fig. S9), suggesting that activation of the BMP signaling was involved in the osteogenic response following the PGK-PDGFB treatment. Taken together, these data demonstrate that an optimal dose of PDGF-BB enhances osteoblastogenesis both in vitro and in vivo.
Fig. S7.

RT-qPCR analysis of Alp (A), Bmp2 (B), and Bmp4 (C) expression in MSCs after in vitro culture in osteogenic medium for 1 and 2 wk. PDGF-BB protein was added at a concentration of 3 ng/mL. *P < 0.05.
Fig. S8.

RT-qPCR analysis of Alp (A), Bmp2 (B), and Bmp4 (C) expression in MC3T3 cells after culture for 24 h. PDGF-BB protein was added at a concentration of 3 ng/mL. *P < 0.05.
Fig. S9.

Ki-67 (A) and pSmad1/5 (B) immunohistochemical staining of the femur sections from control or PGK-PDGFB treated mice. The brown stain indicates the Ki-67 (arrows in A) and pSmad1/5 (arrows in B) proteins. [Scale bars, 100 μm in the low-magnification images (Upper) and 20 μm in the high-magnification images (Lower).]
PDGFB Treatment Increases Bone Remodeling.
Finally, we asked whether osteoclastogenesis was also affected by the PGK-PDGFB treatment. We measured the activity of tartrate-resistant acid phosphatase (TRAP), a marker of osteoclasts. The bone surface of the PGK-PDGFB–treated femur was occupied by significantly more osteoclasts, as indicated by the ∼threefold increase in TRAP+ surface, compared with the control (1.2 ± 0.7 vs. 0.4 ± 0.2 mm/mm2, P = 0.031) (Fig. 5 A and B). These observations, along with the finding that PGK-PDGFB treatment leads to heightened osteoblast activities at bony surfaces, indicate that the PGK-PDGFB–treated animals have an increased bone remodeling. Consistent with an increased bone turnover, serum C-telopeptide of type I collagen (CTX-1), a biochemical marker of bone resorption (24), was increased by 30–40% in PGK-PDGFB mice compared with control mice (P < 0.05) (Fig. 5C). The expression of several osteoclastogenesis-related genes in the tibias of PGK-PDGFB–treated mice at 12 wk posttransplantation was also significantly increased (Fig. 5D). Specifically, Tnfsf11 (which encodes Rankl) and Csf1 (which encodes M-CSF) was up-regulated by ∼threefold and sixfold, respectively. These results suggest that PGK-PDGFB treatment also promotes bone remodeling. Intriguingly, expression of Tnfrsf11b (which encodes osteoprotegerin, a decoy receptor for Rankl) was also increased in PGK-PDGFB–treated tibia. Although the Rankl to Opg ratio is often viewed as an indicator of bone resorption, this assumption may be an oversimplification of the role of Rankl itself.
Fig. 5.

PGK-PDGFB treatment increases bone turnover. (A) Histocytochemical staining for TRAP at the secondary spongiosa of distal femur of a representative GFP control or a representative PGK-PDGFB–treated mouse. Osteoclasts are stained red. (Scale bar, 200 μm.) (B) Quantification of TRAP+ bone surface showed a significant increase in the bone section of PGK-PDGFB–treated mice compared with GFP control animals. *P < 0.05. (C) Serum CTX-1 levels at 9 wk after transplantation. PGK-PDGFB–treated mice showed significant increase in serum CTX-1 level (*P < 0.05). n = 8 per group. (D) Real-time qPCR analysis of osteoclastogenesis-related genes in the tibias. GFP control vs. PGK-PDGFB, *P < 0.05.
Discussion
Here we show that transplantation of mouse HSCs that were engineered to overexpress PDGF-BB driven by the PGK promoter results in a rapid, robust, and persistent formation of mineralized trabecular bone on the endosteum, leading to a 45% increase in the bone strength as measured by three-point bending. Importantly, net bone formation was seen at all of the critical sites where bone is lost during osteoporosis and aging in humans: at the endosteum of cortical surfaces, intracortical canals, and in the trabecular compartment. One of the most remarkable findings with respect to the sites of bone formation was a 20-fold increase in trabecular connections and a 50% decrease in cortical porosity, both of which have mechanical performance implications. In relation to this, we also found evidence for de novo bone formation in the marrow cavity: trabecular bone was found in situ where no trabeculae existed in the control animals. Accordingly, our strategy has the potential to completely replace all bone lost in the osteoporotic process, in a sense of a complete rejuvenation of the skeleton.
One of the most important aspects of our therapy is targeting. We used HSCs because sites of bone loss correspond to hematopoietic niches. Accordingly, transplanted HSCs are able to home to the bone marrow cavity and specifically engraft at the endosteal niches (25), where aging-induced bone loss occurs.
One of the potential problems currently in developing anabolic therapies is a resistance to therapy after a year or so of treatment (26). We did not address this issue directly, but we did not see any decrease in ALP levels that were increased after PGK-PDGFB treatment over the 3-mo experimental period. Moreover, in the context of our experimental animal (normal bone mass), bone formation was occurring robustly despite the fact that the additional bone was not mechanically required. This raises the possibility that our therapy has the potential to cause large increment in skeletal mass in diseased skeleton.
The most critical issue in osteoporosis therapy is bone strength and resistance to fractures. We tested only the bone strength with the three-point bending test. In the future, it would be important to do torsional testing as well as finite element analysis to determine trabecular orientations and whether we have achieved optimal distribution of bone mass for the optimal mechanical performance. Our animals were studied under normal conditions of loading. It will be necessary in the future to determine if additional loading at certain sites would result in a complementary increase in de novo trabecular bone formation at such sites. If so, this stem cell gene therapy could be used in combination with a specific exercise program to enhance the trabecular compartment at mechanically appropriate sites.
In the past, we have used several different growth factors in our HSC-based transplantation strategy (9, 20, 21). BMP4, the first growth factor that we tested, showed no positive effects on bone formation (20). The growth factor that did show a positive response was FGF2, which is a strong mitogen to increase MSC proliferation (27). One of the reasons for studying PDGF-BB was that, similar to FGF2, PDGF-BB also dramatically increases MSC proliferation (28). In aggregate, the studies raise the possibility that to have substantial osteogenic activity, the transplanted cells need to be able to promote MSC proliferation. Accordingly, our findings that the PGK-PDGFB treatment yielded a marked increase in Ki-67+ cells in the marrow space (Fig. S9) and ∼fivefold increase in the ALP-stained bone surface (Fig. 2E) in PGK-PDGFB–treated animals compared with the control group are entirely consistent with an increase in mitogenic activity of mesenchymal bone progenitor cells as a consequence of PDGF-BB in our study. We have proposed a mechanism of action for our therapeutic regimen, which is shown in Fig. 6. Following transplantation, PDGFB-overexpressing Sca1+ cells home in on the HSC niches at the endocortical surfaces and at the trabecular surfaces. PDGF-BB released from Sca1+ cells stimulates MSC proliferation and recruits MSCs to the niches. It also promotes angiogenesis (29). PGK-PDGFB treatment was associated with an increase of Bmp2 and Bmp4 production (Fig. 4F), which, however, was probably caused by an increased number of mature osteoblasts rather than an increased Bmp production per cell (Figs. S7 and S8). On the other hand, the increased osteoblast size and higher levels of pSmad1/5 in the PGK-PDGFB–treated femurs, along with the findings that PDGF-BB–induced nodule formation was increased in the presence of BMP2, raises the strong possibility that there is a cross-talk between the PDGF-BB and BMP2 signaling pathways in our study. However, the exact nature of the interaction between the two signaling pathways will require additional investigation. Nevertheless, the fact that the bone formation-inducing effects of PDGF-BB require the presence of BMPs may raise the interesting possibility that BMP signaling is involved in our PDGF-BB–based stem cell gene therapy, which also would explain why PDGF-BB increases bone formation in bone but not in other tissues. Accordingly, we interpret that the osteogenic milieu facilitates MSCs differentiation toward osteogenic cells around the HSC niches, resulting targeted bone augmentation where bone loss occurs.
Fig. 6.

Schematic diagram of PDGFB-Sca1+ cells induced bone formation at the endosteal niche. (Upper) Normal niche: Under normal conditions, PDGF-BB produced by osteoblasts and osteoclasts/preosteoclasts (and perhaps other local cells) promotes the proliferation of MSCs and endothelial progenitor cells. (Lower) Treated niche: The intravenously injected PDGFB–Sca1+ cells homed to the HSC niche at the endosteum following preconditioning. After engraftment in the niche, the HSCs constitutively produce large amounts of PDGF-BB (large gray arrow), which acts as potent mitogen for nearby MSCs and endothelial progenitor cells. The local production of the Bmps is sufficient to promote the differentiation of MSCs ultimately to osteoblasts. PDGF-BB may also activate Bmp signaling in osteoblasts. As a result, there is a robust increase in endosteal bone formation (Lower, treated niche). We propose the same sequence of events for the perivascular niches, which leads to increased trabecular bone formation.
Previous studies have shown that PDGF receptor β is detected on osteoclasts (30). In addition to enhancing bone formation, PDGF-BB directly stimulates bone resorption (31). Our findings of increased expression of Csf1 and Tnfsf11, an increased number of TRAP+ osteoclasts at the bone surface, and elevated serum CTX-1 levels in PGK-PDGFB–treated mice are entirely consistent with a PDGF-BB–induced increase in bone resorption. Accordingly, inasmuch as the serum PTH was normal in the PGK-PDGFB–treated group, we interpret this finding to be consistent with previous reports on the innate ability of PDGF-BB to stimulate bone resorption (11). Such an increase in bone resorption is indicative of an increase in bone remodeling, which could increase bone quality and improve the mechanical performance of bone. Although we favor that the increased osteoclastogenesis is the direct effect by PDGF-BB, there is no data to rule out the possibility that PDGF-BB–induced osteoclastogenesis is coupled through osteoblastogenesis. Future experiments are needed to determine the mechanism of PDGF-BB–induced osteoclastogenesis in our system.
This study has several limitations: First, our experimental animal model was the C57BL/6 mouse with a normal skeleton. Future work is needed to determine if similar results can be achieved in osteoporotic models. In this regard, it is worth noting that anabolic therapy is effective in ovariectomized mice and osteogenic therapy is effective in aged humans (26). Second, we used promoters of different strengths to obtain an appropriate dose of PDGF-BB, which is far too rigid for appropriate dosage control. Future studies will need to evaluate transcriptional regulation of PDGFB doses. Of note, except for the spleen weight, we did not observe any difference in the weight of major organs and in the body weight between the control and the PGK-PDGFB–treated mice (Fig. S10), suggesting that our therapy does not appear to have serious detrimental effect on other major organs. The reason for the enlarged spleen in the PGK-PDGFB–treated mice was probably the result of an increase in extramedullary hematopoiesis in the spleen, because a substantial amount of the marrow cavity was now occupied by newly formed bone tissue. This is not expected to be an inherent adverse effect because in the future it should be possible to adjust the dose of PDGFB to regenerate the skeleton without compromising marrow hematopoiesis. Third, we used three-point bending to assess the mechanical capacity of our treatment regime. It will be important in future studies to measure the more osteoporotic-relevant parameters of torsional stress and axial compression strength. Fourth, the requirement of irradiation for preconditioning is unacceptable for a non–life-threatening disease. However, it may be possible to use our therapy without irradiation because there are established protocols for donor cell engraftment without irradiation (32, 33). It is important to note that the osteogenic response with our therapy is so robust that only a low engraftment level would lead to a substantial increase in bone formation. Moreover, patients who are already receiving HSC transplantation and are at high risk for osteoporosis (34) could be considered for this therapy.
Fig. S10.

PGK-PDGFB treatment did not change body weight (A), heart weight (B), kidney weight (C), and liver weight (D) of mice. The spleen weight (E) is significantly increased in the PGK-PDGFB group. (*P = 0.038).
In conclusion, transplantation of mouse HSCs engineered to express PDGF-BB by the PGK promoter in the normal mouse results in a rapid, robust, and persistent formation of mineralized bone, leading to a considerable increase in bone strength, which is attributed to large increase in de novo trabecular formation and trabecular connectivity, and a significant reduction in cortical porosity. The stem cell gene-therapy approach may be potentially safer than intravascular injection of PDGF-BB, because optimal levels of PDGF-BB in bone marrow can be achieved without affecting PDGF-BB baseline levels in circulation. These data suggest that our HSC-based PDGFB treatment may be developed into a novel anabolic therapy for bone loss-related disorders in the future.
Materials and Methods
Detailed information is provided in SI Materials and Methods.
All animal work was approved by the Institutional Animal Care and Use Committee of the Loma Linda University and the Animal Care and Use Review Office of the United States Department of the Army. Bone marrow Sca1+ cell isolation and lentivirus preparation and transduction were performed as previously described (35). Trabecular BMD was measured with a STRATEC XCT 960M peripheral quantitated computed tomography (pQCT) using XCT software v5.40 (Roche Diagnostics) as previously described (35). μCT analysis of the femoral bone was performed using a Scanco VivaCT 40 instrument (Scanco Medical). The mechanical strength of the femurs was evaluated at midshaft by the three-point bending test, using an Instron DynaMight 8841 servohydraulic tester (Instron). The RT-qPCR was done as previously reported (35). Primer sequences are listed in Table S1. A total of 2 × 10⁵ marrow cells were plated into 0.01% gelatin-coated plates for CFU-F and CFU-Ob assays. Crystal violet staining was stained for CFU-F assay after 14 d, and Alizarin red staining was used for CFU-Ob assay after 21 d.
Table S1.
Primer sequences used for RT-qPCR analysis
| Gene | Primer sequences |
| Gapdh | Forward primer: 5′–GGGTGTGAACCACGAGAAAT-3′ |
| Reverse primer: 5′–CCTTCCACAATGCCAAAGTT–3′ | |
| Alp | Forward primer: 5′–CTTGACTGTGGTTACTGCTG–3′ |
| Reverse primer: 5′–GAGCGTAATCTACCATGGAG–3′ | |
| Bmp2 | Forward primer: 5′–TGGAAGTGGCCCATTTAGAG–3′ |
| Reverse primer: 5′–TGACGCTTTTCTCGTTTGTG–3′ | |
| Bmp4 | Forward primer: 5′–CCTCAAGGGAGTGGAGATTG–3′ |
| Reverse primer: 5′–GACTACGTTTGGCCCTTCTG–3′ | |
| Sp7 | Forward primer: 5′–AGCTCACTATGGCTCCAGTCC–3′ |
| Reverse primer: 5′–GCGTATGGCTTCTTTGTGCCT–3′ | |
| Cbfa1 | Forward primer: 5′–CCAAGAAGGCACAGACAGAA–3′ |
| Reverse primer: 5′–ATACTGGGATGAGGAATGCG–3′ | |
| Spp1 | Forward primer: 5′–GGTGATAGCTTGGCTTATGGACTG–3′ |
| Reverse primer: 5′–GCTCTTCATGTGAGAGGTGAGGTC–3′ | |
| Col1a1 | Forward primer: 5′–GAGCGGAGAGTACTGGATCG–3′ |
| Reverse primer: 5′–TACTCGAACGGGAATCCATC–3′ | |
| Tnfsf11 | Forward primer: 5′–CAGCATCGCTCTGTTCCTGTA–3′ |
| Reverse primer: 5′–CTGCGTTTTCATGGAGTCTCA–3′ | |
| Tnfrsf11b | Forward primer: 5′–ACCCAGAAACTGGTCATCAGC–3′ |
| Reverse primer: 5′–CTGCAATACACACACTCATCACT–3′ | |
| Csf1 | Forward primer: 5′–GGCTTGGCTTGGGATGATTCT–3′ |
| Reverse primer: 5′–GAGGGTCTGGCAGGTACTC–3′ |
Data are presented as mean ± SD. Data comparison between two groups was analyzed using Student’s t test. Data comparison between more than two groups was analyzed using one-way ANOVA followed by Turkey’s multiple comparisons test. We measured the linear relationships between maximum load force and femur cortical bone volume, as well as that between maximum load force and trabecular bone volume in the midshaft of femurs using Pearson’s correlation coefficient. The P value of < 0.05 was considered statistically significant. Sample sizes were n = 8 for each group, or otherwise indicated.
SI Material and Methods
Mice.
Six-week-old female C57BL/6 mice were purchased from the Jackson laboratory. All experimental protocols were approved by the Institutional Animal Care and Use Committee at Loma Linda University and the Animal Care and Use Review Office of the United States Department of the Army. In conducting research using animals, the investigators adhered to the Animal Welfare Act Regulations and other Federal statutes relating to animals and experiments involving animals and the principles set forth in the current version of the Guide for Care and Use of Laboratory Animals, National Research Council.
Bone Marrow Sca1+ Cells Isolation.
Bone marrow Sca1+ cell isolation was performed as previously described (35). Briefly, bone marrow cells were harvested from femurs and tibias, and Sca1+ cells were purified using Sca1 MACS magnetic beads (MiltenyiBiotec). Before viral transduction, cells were cultured 48 h in Iscove’s modified Dulbecco’s medium (IMDM, Invitrogen) containing 10% (vol/vol) FBS (Invitrogen) and 100 ng/mL each of human TPO, mouse SCF, human FL, human IL-3, and human G-CSF.
Lentiviral Vectors and Transduction of Sca1+ Cells.
Human PDGFB ORF was subcloned into a lentiviral vector under the control of the SFFV promoter, the PGK promoter, or the truncated PGK promoter (P200). Lentiviral packaging was performed as previous described (35). SIN lentiviral vectors were produced by transient transfection of the vector plasmid in human 293T cells along with helper plasmid (CMVdR8.74) and envelope plasmid (MD.G). Sca1+ cells were transduced once at a MOI of 2 for 6 h in six-well nontissue culture-treated plates precoated with RetroNectin (Takara). Transduction efficiency was ∼70% as determined by flow cytometry and real-time PCR analysis.
Transplantation.
Recipient mice were irradiated with a 60Co source (Eldorado model, Atomic Energy of Canada) at a single dose of 6 Gy (1 Gy/min). Twenty-four hours later, 1 × 10⁶ lentiviral transduced Sca1+ cells were resuspended in 200 µL IMDM and transplanted into each recipient mouse via tail vein injection.
Flow Cytometry.
To compare the relative strength of the test promoters in mouse HSCs, Sca1+ cells were transduced with lentiviral vectors (i.e., SFFV-GFP, PGK-GFP, or P200-GFP, each at an MOI of 0.1). Three days later, cells were collected and resuspended in PBS. A total of 50,000 cells from each sample were analyzed on a FACSAria II flow cytometer (BD Biosciences). Analysis was performed with BD FACSDiva software v6.1.2.
Bone Histology and Immunostaining.
Mouse femurs were fixed in 1% paraformaldehyde (PFA) containing 0.1% picric acid overnight at 4 °C, and frozen sections were obtained as previously described (36). Briefly, undecalcified femurs were embedded in SCEM embedding medium (Section Lab). After trimming, the sample surface was covered with the Cryofilm type 2C adhesive film (Section Lab) and 5-µm-thick sections were cut using Cryostat (Leica CM3050S). The sections were used for cytochemical staining for ALP activity or TRAP activity, for von Kossa staining of mineralized bone matrix, and for immunohistochemical staining of osteoblast-specific proteins. Cytochemical staining for ALP activity was performed using the Alkaline Phosphatase Staining Kit II (Stemgent). For TRAP activity cytochemical staining, sections were preincubated for 10 min in TRAP solution (15.2 mg/mL sodium acetate trihydrate, 22.6 mg/mL potassium sodium tartrate, 0.28% glacial acetic acid, 0.5 mg/mL naphthol AS-BI phosphate, 1% dimethyl formamide), followed by 5 min of incubation in development solution (2 mg/mL pararosanilline and 20 mg/mL sodium nitrate). For von Kossa staining, sections were first incubated with 1% silver nitrate solution for 45 min, then rinsed thoroughly in distilled water, and subsequently incubated with 5% (wt/vol) thiosulfate solution for 5 min. After washes, sections were counterstained with H&E. For immunohistochemical staining, sections were blocked with 3% (vol/vol) hydrogen peroxide for 10 min followed by 4% (vol/vol) normal horse serum for 30 min, and subsequently incubated overnight at 4 °C with specific primary antibodies against Runx2 (Abcam), Sp7 (Abcam), osteocalcin (Takara), vWF (Dako), Ki-67 (Abcam), or pSmad1/5 (Cell Signaling). The slides were then incubated with respective biotinylated secondary antibody (Vector Laboratories) and developed with DAB (Diaminobenzidine) reagent (Vector Laboratories). All images were captured using an Olympus BX51 microscope system (Olympus).
For ALP or TRAP surface quantification, we measured the total length of ALP+ or TRAP+ surface and the tissue area in three continuous fields, directly underneath the lowest point of the growth plate, using the OsteoMeasure system (OsteoMetrics). The final data were calculated as total ALP or TRAP length versus the total tissue area. Six animals per group were measured.
pQCT Analysis.
Femurs were fixed in 4% (wt/vol) PFA overnight and then stored in PBS with 0.1% sodium azide at 4°C until analyzed. Trabecular BMD was measured with a STRATEC XCT 960M pQCT using XCT software v5.40 (Roche Diagnostics), as previously described (35). Trabecular BMD value was calculated by dividing trabecular mineral content by the trabecular bone volume and expressed as milligrams per cubic centimeter.
μCT Analysis.
μCT analysis of the femoral bone was performed using a Scanco VivaCT 40 instrument (Scanco Medical). Femurs were scanned at an isotropic voxel size of 10.4 µm3, and energies of 55 keV and 70 keV were used to scan the metaphysis and midshaft, respectively. For metaphyseal scans, the region of interest was a set distance proximal to the condylar growth plate after the bone was normalized for variations in length. Midshaft scans were also normalized for any variations in bone length. Trabecular bone was segmented at a density of greater than 220 mg/cm3 and the cortical bone segmented at a density of greater than 260 mg/cm3. Cortical porosity parameters were determined from the true 3D indices as calculated from a two-contour examination of the femoral midshaft cortex. The cortical porosity was calculated as 1 − BV/TV (midshaft).
Serum Analyses.
Serum PDGF-BB, PTH, FGF23, osteocalcin, and CTX-1 levels were measured using PDGFB ELISA kit (R&D Systems), PTH ELISA kit (RayBiotech), FGF23 ELISA kit (Millipore), osteocalcin ELISA kit (Biomedical technologies), and CTX-1 ELISA kit (Novateinbio), respectively. Serum calcium and phosphate were measured using colorimetric assay kits (Biovision). Serum ALP activity was measured by QuantiChrom ALP kit (BioAssay Systems).
Quantitative RT-PCR.
RNA was extracted from tibias using QIAzol lysis reagent (Qiagen) followed by purification with RNeasy kit and DNase treatment (Qiagen) according to the manufacturer’s instructions. Reverse transcription into cDNA was performed using EasyScript Reverse Transcript kit (Applied Biological Materials). Real-time PCR was performed using SYBRGreen PCR Master Mix (Applied Biosystems) on the 7500 Fast Real-Time PCR System (Applied Biosystems). The samples were normalized to GAPDH expression. Primer sequences are listed in Table S1.
CFU-F and CFU-Ob Assays.
At 12 wk posttransplantation, bone marrow cells were harvested from long bones of PGK-PDGFB–treated mice or GFP-treated control mice, and cell number was counted after lysis of red blood cells. A total of 2 × 10⁵ marrow cells were plated into 0.01% gelatin-coated plates for CFU-F and CFU-Ob assay. For the CFU-F assay, cells were maintained in MSC Medium Kit (Applied Biological Materials) for 14 d, and stained with Crystal violet. For CFU-Ob assay, cells were maintained in osteogenic medium (α-MEM supplemented with 10% (vol/vol) FBS, 100 U/mL penicillin/streptomycin, 5 mM β-glycerophosphate, 10 µM dexamethasone, and 50 µg/mL ascorbic acid) for 21 d. Mineralized nodules were stained with Alizarin red.
In Vitro MSC Culture.
Mouse MSCs were isolated and cultured using standard protocols (37). Bone marrow cells were obtained from 6-wk-old mice by flushing the femurs and tibia with α-MEM medium. After lysis of red blood cells, bone marrow cells were plated in α-MEM medium supplemented with 2% FBS, 5% serum replacement, 100 IU/mL of penicillin, and 100 μg/mL of streptomycin. After 24 h, nonadherent cells were removed by washing with PBS and adherent cells were continuously cultured until reaching 80–90% confluence. Subsequent passaging was performed, and cells at passage 3 were used. For the MSC proliferation assay, 1 × 10⁵ cells were plated in each well of six-well plates with α-MEM complete medium supplemented with PDGF-BB (R&D Systems) at different concentrations (0, 0.3, 3, or 30 ng/mL). Culture medium was changed every 2 d. Cell number was counted every 3 d. For bone nodule assay, a total of 1 × 10⁵ cells were maintained in osteogenic medium (α-MEM supplemented with 10% (vol/vol) FBS, 100 U/mL penicillin/streptomycin, 5 mM β-glycerophosphate, 10 μM dexamethasone, and 50 μg/mL ascorbic acid) for 21 d. Culture medium was changed every 2 d, and mineralized nodules were stained with Alizarin red.
Mechanical Testing of Bone Strength.
The mechanical strength of the femurs was evaluated at midshaft by the three-point bending test, using an Instron DynaMight 8841 servohydraulic tester (Instron). Bones were stored frozen in saline-soaked gauze, and thawed and rehydrated in saline before testing. The femur was positioned on the tester with the anterior aspect upwards on supports that were 7 mm apart. The bone was preloaded to 1 N at the midshaft and then loaded to failure using a blade excursion rate of 5.0 mm/s. The loading force that caused the bone to break is the maximal load-to-failure force, and the slope of the load-displacement curve (Fig. 3I) represents the stiffness of the bone.
Acknowledgments
This work was supported by the Telemedicine and Advanced Technology Research Center at the US Army Medical Research Acquisition Activity under Grant W81XWH-08-1-0697.
Footnotes
Conflict of interest statement: A provisional patent application has been filed on the basis of some of the findings. D.J.B., K.-H.W.L., X.-B.Z., and W.C. are the coinventors.
This article is a PNAS Direct Submission.
This article contains supporting information online at www.pnas.org/lookup/suppl/doi:10.1073/pnas.1501759112/-/DCSupplemental.
References
- 1.Johnell O, Kanis JA. An estimate of the worldwide prevalence and disability associated with osteoporotic fractures. Osteoporos Int. 2006;17(12):1726–1733. doi: 10.1007/s00198-006-0172-4. [DOI] [PubMed] [Google Scholar]
- 2.Rachner TD, Khosla S, Hofbauer LC. Osteoporosis: Now and the future. Lancet. 2011;377(9773):1276–1287. doi: 10.1016/S0140-6736(10)62349-5. [DOI] [PMC free article] [PubMed] [Google Scholar]
- 3.Ettinger B, et al. Multiple Outcomes of Raloxifene Evaluation (MORE) Investigators Reduction of vertebral fracture risk in postmenopausal women with osteoporosis treated with raloxifene: Results from a 3-year randomized clinical trial. JAMA. 1999;282(7):637–645. doi: 10.1001/jama.282.7.637. [DOI] [PubMed] [Google Scholar]
- 4.Canalis E, Giustina A, Bilezikian JP. Mechanisms of anabolic therapies for osteoporosis. N Engl J Med. 2007;357(9):905–916. doi: 10.1056/NEJMra067395. [DOI] [PubMed] [Google Scholar]
- 5.McClung MR, et al. Romosozumab in postmenopausal women with low bone mineral density. N Engl J Med. 2014;370(5):412–420. doi: 10.1056/NEJMoa1305224. [DOI] [PubMed] [Google Scholar]
- 6.Horwitz MJ, et al. A comparison of parathyroid hormone-related protein (1-36) and parathyroid hormone (1-34) on markers of bone turnover and bone density in postmenopausal women: The PrOP study. J Bone Miner Res. 2013;28(11):2266–2276. doi: 10.1002/jbmr.1978. [DOI] [PMC free article] [PubMed] [Google Scholar]
- 7.Cabal A, et al. A semimechanistic model of the time-course of release of PTH into plasma following administration of the calcilytic JTT-305/MK-5442 in humans. J Bone Miner Res. 2013;28(8):1830–1836. doi: 10.1002/jbmr.1900. [DOI] [PubMed] [Google Scholar]
- 8.Fischbach MA, Bluestone JA, Lim WA. Cell-based therapeutics: The next pillar of medicine. Sci Transl Med. 2013;5(179):179ps7. doi: 10.1126/scitranslmed.3005568. [DOI] [PMC free article] [PubMed] [Google Scholar]
- 9.Hall SL, et al. Sca-1(+) hematopoietic cell-based gene therapy with a modified FGF-2 increased endosteal/trabecular bone formation in mice. Mol Ther. 2007;15(10):1881–1889. doi: 10.1038/sj.mt.6300258. [DOI] [PubMed] [Google Scholar]
- 10.Kasperk CH, et al. Interactions of growth factors present in bone matrix with bone cells: Effects on DNA synthesis and alkaline phosphatase. Growth Factors. 1990;3(2):147–158. doi: 10.3109/08977199009108277. [DOI] [PubMed] [Google Scholar]
- 11.Mitlak BH, et al. The effect of systemically administered PDGF-BB on the rodent skeleton. J Bone Miner Res. 1996;11(2):238–247. doi: 10.1002/jbmr.5650110213. [DOI] [PubMed] [Google Scholar]
- 12.Al-Zube L, et al. Recombinant human platelet-derived growth factor BB (rhPDGF-BB) and beta-tricalcium phosphate/collagen matrix enhance fracture healing in a diabetic rat model. J Orthop Res. 2009;27(8):1074–1081. doi: 10.1002/jor.20842. [DOI] [PubMed] [Google Scholar]
- 13.Solchaga LA, et al. Comparison of the effect of intra-tendon applications of recombinant human platelet-derived growth factor-BB, platelet-rich plasma, steroids in a rat Achilles tendon collagenase model. J Orthop Res. 2014;32(1):145–150. doi: 10.1002/jor.22483. [DOI] [PubMed] [Google Scholar]
- 14.Nevins M, et al. Platelet-derived growth factor stimulates bone fill and rate of attachment level gain: Results of a large multicenter randomized controlled trial. J Periodontol. 2005;76(12):2205–2215. doi: 10.1902/jop.2005.76.12.2205. [DOI] [PubMed] [Google Scholar]
- 15.Solchaga LA, Hee CK, Roach S, Snel LB. Safety of recombinant human platelet-derived growth factor-BB in Augment(®) Bone Graft. J Tissue Eng. 2012;3(1):2041731412442668. doi: 10.1177/2041731412442668. [DOI] [PMC free article] [PubMed] [Google Scholar]
- 16.Amugongo SK, et al. Effect of sequential treatments with alendronate, parathyroid hormone (1-34) and raloxifene on cortical bone mass and strength in ovariectomized rats. Bone. 2014;67:257–268. doi: 10.1016/j.bone.2014.04.033. [DOI] [PMC free article] [PubMed] [Google Scholar]
- 17.Sheehan DZ, Hrapchack BB, editors. Theory and Practice of Histotechnology. 2nd Ed CV Mosby; St. Louis, MO: 1980. [Google Scholar]
- 18.Tobiume H, et al. Serum bone alkaline phosphatase isoenzyme levels in normal children and children with growth hormone (GH) deficiency: A potential marker for bone formation and response to GH therapy. J Clin Endocrinol Metab. 1997;82(7):2056–2061. doi: 10.1210/jcem.82.7.4081. [DOI] [PubMed] [Google Scholar]
- 19.Cole JH, van der Meulen MC. Whole bone mechanics and bone quality. Clin Orthop Relat Res. 2011;469(8):2139–2149. doi: 10.1007/s11999-011-1784-3. [DOI] [PMC free article] [PubMed] [Google Scholar]
- 20.Hall SL, et al. Stem cell antigen-1+ cell-based bone morphogenetic protein-4 gene transfer strategy in mice failed to promote endosteal bone formation. J Gene Med. 2009;11(10):877–888. doi: 10.1002/jgm.1369. [DOI] [PubMed] [Google Scholar]
- 21.Hall SL, et al. Stem cell antigen-1 positive cell-based systemic human growth hormone gene transfer strategy increases endosteal bone resorption and bone loss in mice. J Gene Med. 2011;13(2):77–88. doi: 10.1002/jgm.1542. [DOI] [PubMed] [Google Scholar]
- 22.Xie H, et al. PDGF-BB secreted by preosteoclasts induces angiogenesis during coupling with osteogenesis. Nat Med. 2014;20(11):1270–1278. doi: 10.1038/nm.3668. [DOI] [PMC free article] [PubMed] [Google Scholar]
- 23.Ramasamy SK, Kusumbe AP, Wang L, Adams RH. Endothelial Notch activity promotes angiogenesis and osteogenesis in bone. Nature. 2014;507(7492):376–380. doi: 10.1038/nature13146. [DOI] [PMC free article] [PubMed] [Google Scholar]
- 24.Tyagi AM, et al. Estrogen deficiency induces the differentiation of IL-17 secreting Th17 cells: A new candidate in the pathogenesis of osteoporosis. PLoS ONE. 2012;7(9):e44552. doi: 10.1371/journal.pone.0044552. [DOI] [PMC free article] [PubMed] [Google Scholar]
- 25.Chanda D, Kumar S, Ponnazhagan S. Therapeutic potential of adult bone marrow-derived mesenchymal stem cells in diseases of the skeleton. J Cell Biochem. 2010;111(2):249–257. doi: 10.1002/jcb.22701. [DOI] [PMC free article] [PubMed] [Google Scholar]
- 26.McClung MR, et al. Effects of 2 years of treatment with romosozumab followed by 1 year of denosumab or placebo in postmenopausal women with low bone mineral density. J Bone Miner Res. 2014;29(Suppl 1):1152 (abstr). doi: 10.1002/jbmr.3452. [DOI] [PubMed] [Google Scholar]
- 27.Hanada K, Dennis JE, Caplan AI. Stimulatory effects of basic fibroblast growth factor and bone morphogenetic protein-2 on osteogenic differentiation of rat bone marrow-derived mesenchymal stem cells. J Bone Miner Res. 1997;12(10):1606–1614. doi: 10.1359/jbmr.1997.12.10.1606. [DOI] [PubMed] [Google Scholar]
- 28.Tokunaga A, et al. PDGF receptor beta is a potent regulator of mesenchymal stromal cell function. J Bone Miner Res. 2008;23(9):1519–1528. doi: 10.1359/jbmr.080409. [DOI] [PubMed] [Google Scholar]
- 29.Ponte AL, et al. The in vitro migration capacity of human bone marrow mesenchymal stem cells: Comparison of chemokine and growth factor chemotactic activities. Stem Cells. 2007;25(7):1737–1745. doi: 10.1634/stemcells.2007-0054. [DOI] [PubMed] [Google Scholar]
- 30.Zhang Z, Chen J, Jin D. Platelet-derived growth factor (PDGF)-BB stimulates osteoclastic bone resorption directly: The role of receptor beta. Biochem Biophys Res Commun. 1998;251(1):190–194. doi: 10.1006/bbrc.1998.9412. [DOI] [PubMed] [Google Scholar]
- 31.Tashjian AH, Jr, Hohmann EL, Antoniades HN, Levine L. Platelet-derived growth factor stimulates bone resorption via a prostaglandin-mediated mechanism. Endocrinology. 1982;111(1):118–124. doi: 10.1210/endo-111-1-118. [DOI] [PubMed] [Google Scholar]
- 32.Zielske SP, Reese JS, Lingas KT, Donze JR, Gerson SL. In vivo selection of MGMT(P140K) lentivirus-transduced human NOD/SCID repopulating cells without pretransplant irradiation conditioning. J Clin Invest. 2003;112(10):1561–1570. doi: 10.1172/JCI17922. [DOI] [PMC free article] [PubMed] [Google Scholar]
- 33.Falahati R, et al. Chemoselection of allogeneic HSC after murine neonatal transplantation without myeloablation or post-transplant immunosuppression. Mol Ther. 2012;20(11):2180–2189. doi: 10.1038/mt.2012.136. [DOI] [PMC free article] [PubMed] [Google Scholar]
- 34.McClune BL, Majhail NS. Osteoporosis after stem cell transplantation. Curr Osteoporos Rep. 2013;11(4):305–310. doi: 10.1007/s11914-013-0180-1. [DOI] [PubMed] [Google Scholar]
- 35.Meng X, et al. Erythroid promoter confines FGF2 expression to the marrow after hematopoietic stem cell gene therapy and leads to enhanced endosteal bone formation. PLoS ONE. 2012;7(5):e37569. doi: 10.1371/journal.pone.0037569. [DOI] [PMC free article] [PubMed] [Google Scholar]
- 36.Kawamoto T, Shimizu M. A method for preparing 2- to 50-micron-thick fresh-frozen sections of large samples and undecalcified hard tissues. Histochem Cell Biol. 2000;113(5):331–339. doi: 10.1007/s004180000149. [DOI] [PubMed] [Google Scholar]
- 37.Tondreau T, et al. Isolation of BM mesenchymal stem cells by plastic adhesion or negative selection: Phenotype, proliferation kinetics and differentiation potential. Cytotherapy. 2004;6(4):372–379. doi: 10.1080/14653240410004943. [DOI] [PubMed] [Google Scholar]