Abstract
Objective
To examine associations of patient and injury characteristics, inpatient rehabilitation therapy activities, and neurotropic medications with outcomes at discharge and 9 months post-discharge for patients with traumatic brain injury (TBI)
Design
Prospective, longitudinal observational study
Setting
10 inpatient rehabilitation centers (9 US, 1 Canada)
Participants
Consecutive patients (n=2130) enrolled between 2008 and 2011, admitted for inpatient rehabilitation after an index TBI injury
Interventions
Not applicable
Main Outcome Measures
Rehabilitation length of stay, discharge to home, and Functional Independence Measure (FIM) at discharge and 9 months post-discharge
Results
The admission FIM Cognitive score was used to create 5 relatively homogeneous subgroups for subsequent analysis of treatment outcomes. Within each subgroup, significant associations were found between outcomes and patient and injury characteristics, time spent in therapy activities, and medications used. Patient and injury characteristics explained on average 35.7% of the variation in discharge outcomes and 22.3% in 9-month outcomes. Adding time spent and level of effort in therapy activities, as well as percent of stay using specific medications, explained approximately 20.0% more variation for discharge outcomes and 12.9% for 9-month outcomes. After patient, injury, and treatment characteristics were used to predict outcomes, center differences added only approximately 1.9% additional variance explained.
Conclusions
At discharge, greater effort during therapy sessions, time spent in more complex therapy activities, and use of specific medications were associated with better outcomes for patients in all admission FIM Cognitive subgroups. At 9 months post-discharge, similar but less pervasive associations were observed for therapy activities, but not classes of medications. Further research is warranted to examine more specific combinations of therapy activities and medications that are associated with better outcomes.
Keywords: brain injuries, rehabilitation, craniocerebral trauma, outcome assessment (health care)
A major challenge in traumatic brain injury (TBI) inpatient rehabilitation practice is how best to customize available resources to optimize patient outcomes. Many previous studies have examined only the effects of patient and injury characteristics on outcomes.1–7 The association of TBI rehabilitation outcomes with processes of care has not been studied comprehensively. Studies that have examined treatments have focused on specific rehabilitation techniques or aggregate time in physical (PT), occupational (OT), or speech (ST) therapy. 8–14 However, several of these investigators concluded that the potential impact of multiple confounding variables were not accounted for and that research was needed to move beyond the simple question of whether aggregate measures of rehabilitation time or rehabilitation programs were effective. Research needs to examine factors such as specific activities performed during therapy sessions and salient patient characteristics that optimize clinical outcomes. TBI rehabilitation studies typically have been limited to a single set or subset of interventions and rarely examine multiple processes of care concurrently. Failure to optimize rehabilitation therapies and treatment interventions can result in too few or too many resources relative to a patient’s needs and preferred outcomes.
The introductory article in this series describes the purpose, design, and scope of the overall study, as well as a literature review that establishes the case for the multicenter, TBI practice-based evidence study (TBI-PBE).15 Other articles in this series have documented the nature, scope, and variation of TBI rehabilitation practice as observed in this study,16–18 which was designed to identify associations among TBI rehabilitation patient and injury characteristics, therapeutic processes, and outcomes.15 Clinicians and researchers defined granular details of the care rendered. Previous studies have not included sufficient detail to determine how various services—alone, in combination, or sequentially—predict functional independence, length of stay (LOS), and discharge to a private residence. Previous studies have focused only on the amount of therapy provided daily or weekly, rather than the actual content of therapy provided and the patient’s participation in the session.12,19 In contrast, the present study sought to determine what therapeutic activities should be provided, to whom, and under what conditions.
In the current article, rehabilitation factors described in the earlier papers were integrated in order to examine the cumulative contribution of individual and rehabilitation factors to outcomes. Predictors fell into three general categories: (1) patient and injury characteristics, (2) discipline-specific activities and the effort given to treatment, and (3) use of neurotropic medications. Six outcomes were predicted: LOS in acute rehabilitation, discharge from rehabilitation to a private residence, and motor and cognitive functional independence at discharge and 9 months post-discharge. We sought to determine how specific rehabilitation activities—therapies and medications—relate to outcomes when patient and injury characteristics have been fully accounted for.
METHODS
From October 2008 to September 2011, patients with a primary diagnosis of TBI who were consecutively admitted to 10 acute inpatient rehabilitation facilities were enrolled in the TBI-PBE study. The methodology of the study is fully described elsewhere, including participating facilities, patient selection criteria, validity and reliability of data collection instruments, and a detailed description of the cohort.15, 20 The 10 participating centers constituted a convenience sample of TBI adult inpatient rehabilitation centers based on their willingness to conduct the research; however, the sample closely resembled the US population of adolescents and adults receiving acute rehabilitation for a primary diagnosis of TBI.15 The Institutional Review Board at each center approved the study; each patient or his/her proxy gave informed consent.
Participants
All patients enrolled and consented in the study (n=2130) were eligible for inclusion in the analyses reported here. Participants (a) sustained a TBI, defined as damage to brain tissue caused by an external force and evidenced by loss of consciousness, post-traumatic amnesia, skull fracture, or objective neurological findings, (b) received inpatient care at one of the 10 participating facilities, and (c) were at least 14 years of age or older upon entry into the facility. Fairly homogenous patient subgroups were formed using the Functional Independence Measure (FIM™) Cognitive score upon admission to rehabilitation. FIM is a measure of functional independence, and consists of 18 items in two domains: Motor (13 items) and Cognitive (5 items). Each item is rated on a 7-point scale, ranging from 1: total assistance, to 7: complete independence. The five homogenous subgroups of patients based on admission FIM Cognitive were defined as follows: scores ≤6 (n=339), 7–10 (n=374), 11–15 (n=495), 16–20 (n=408), and ≥21 (n=504). Ten patients missing admission FIM Cognitive scores were not included in subsequent analyses. More details about these subgroups are presented elsewhere.15
A listing of all variables capturing patient and injury characteristics that were eligible for inclusion in prediction models can be found in table 1. Only variables actually included in at least one final model are described here. Patient variables were comprised of (a) demographic characteristics (age, gender, race categories, education [some high school, but no diploma], payer [Medicaid]); (b) pre-injury health information (indication of substance use and body mass index less than 18.5 [based on the Center for Disease Control definition of underweight]); (c) injury and rehabilitation stay characteristics (presence of anxiety or depression, percent of rehabilitation stay agitated, days from injury to rehabilitation admission, presence of post-traumatic amnesia upon admission to rehabilitation, Comprehensive Severity Index [CSI®] scores); and (d) functional status characteristics (admission functional status [Rasch-transformed admission FIM Motor and FIM Cognitive scores]).21
Table 1.
Patient, Treatment, and Outcome Variables by Admission FIM Cognitive Score
| Variable | Overall (n=2130) | Adm Cog <=6 (n=339) | Adm Cog 7–10 (n=374) | Adm Cog 11–15 (n=495) | Adm Cog 16–20 (n=408) | Adm Cog >=21 (n=504) | P-Value |
|---|---|---|---|---|---|---|---|
| Demographic characteristics | |||||||
| Age, mean (SD) | 44.5 (21.3) | 43.0 (21.9) | 42.3 (20.0) | 43.1 (20.9) | 46.9 (21.6) | 46.8 (21.8) | <.001 |
| Male, (%) | 72.5 | 71.7 | 76.5 | 75.8 | 71.3 | 67.7 | 0.018 |
| Race/Ethnicity (%) | 0.083 | ||||||
| Black | 15.1 | 15.3 | 13.9 | 16.8 | 15.4 | 13.9 | |
| White non Hispanic | 74.4 | 77.9 | 73.5 | 73.5 | 74.3 | 73.4 | |
| White Hispanic | 6.2 | 5.0 | 8.0 | 5.7 | 6.6 | 5.8 | |
| Other and unknown | 4.4 | 1.8 | 4.5 | 4.0 | 3.7 | 6.9 | |
| Education: some high school no diploma (%) | 22.9 | 20.1 | 25.9 | 25.1 | 26.7 | 17.5 | 0.002 |
| Payer Medicaid (%) | 15.5 | 20.9 | 18.2 | 16.4 | 17.2 | 7.7 | <.001 |
| Pre-injury health information | |||||||
| Substance use (%) | 51 | 45.4 | 57.5 | 51.7 | 52.9 | 47.6 | 0.009 |
| Body Mass Index (BMI) <18.5 (%) | 9.9 | 14.2 | 13.1 | 9.7 | 9.1 | 5.6 | <.001 |
| Injury and rehabilitation stay characteristics | |||||||
| Anxiety (%) | 40.8 | 32.4 | 46.5 | 45.3 | 41.4 | 37.5 | <.001 |
| Depression (%) | 48.9 | 47.5 | 52.9 | 54.1 | 49.8 | 41.1 | <.001 |
| % of rehab stay agitated, mean (SD) | 8.9 (19.4) | 18.8 (25.2) | 15.9 (25.1) | 8.5 (17.8) | 4.1 (12.9) | 1.2 (7.2) | <.001 |
| Days from injury to rehab admission, mean (SD) | 29.3 (34.3) | 36.5 (38.7) | 34.2 (37.6) | 27.5 (32.3) | 26.0 (33.5) | 24.9 (30.1) | <.001 |
| PTA cleared prior to rehab admission (%) | 40 | 1.2 | 8 | 25.7 | 62.5 | 86.5 | <.001 |
| Maximum brain injury component of CSI score, mean (SD) | 48.4 (24.8) | 77.2 (18.3) | 66.8 (16.6) | 50.8 (15.6) | 36.1 (13.3) | 22.0 (10.2) | <.001 |
| Maximum non-brain injury component of CSI score, mean (SD) | 24.8 (20.9) | 30.6 (23.5) | 30.7 (21.7) | 25.8 (20.7) | 22.7 (20.3) | 16.8 (15.4) | <.001 |
| Functional status characteristics | |||||||
| Admission FIM Motor Rasch- transformed, mean (SD) | 33.2 (19.3) | 11.5 (14.5) | 23.2 (16.4) | 34.2 (14.8) | 40.5 (12.5) | 48.3 (15.2) | <.001 |
| Admission FIM Cog Rasch-transformed, mean (SD) | 37.2 (19.5) | 2.5 (4.4) | 25.7 (4.8) | 38.4 (3.0) | 47.5 (2.4) | 59.6 (7.7) | <.001 |
| Treatment factors | |||||||
| Total minutes/week | |||||||
| OT total min/week, mean (SD) | 295.7 | 320.7 (91.1) | 302.9 (90.9) | 296.8 (95.6) | 282.5 (109.4) | 282.8 (120.9) | <.001 |
| PT total min/week, mean (SD) | 312 (111.9) | 343.8 (94.9) | 318.3 (100.1) | 305.6 (102.8) | 303.4 (116.7) | 299.6 (130.8) | <.001 |
| ST total min/week, mean (SD) | 245.3 | 268.0 (108.0) | 287.4 (103.6) | 276.9 (114.2) | 233.4 (113.2) | 176.1 (126.5) | <.001 |
| PSY total min/week, mean (SD) | 64.9 (80.8) | 41.7 (59.7) | 60.2 (63.7) | 82.8 (78.2) | 72.9 (90.7) | 60.1 (93.5) | <.001 |
| TREC total min/week, mean (SD) | 65.9 (73.1) | 47.6 (52.2) | 68.8 (65.9) | 86.4 (82.8) | 73.6 (76.4) | 49.9 (71.3) | <.001 |
| Average OT, PT, ST level of effort, mean (SD) | 4.2 (0.9) | 3.3 (0.8) | 3.7 (0.7) | 4.2 (0.6) | 4.5 (0.6) | 4.9 (0.7) | <.001 |
| Occupational therapy | |||||||
| casting min/week, mean (SD) | 3 (10.8) | 6.3 (16.5) | 3.2 (9.0) | 2.6 (9.2) | 1.9 (9.1) | 1.6 (9.0) | <.001 |
| cognitive impairment min/week, mean (SD) | 73.9 (62.5) | 89.1 (67.6) | 76.4 (57.6) | 76.0 (60.3) | 70.5 (59.6) | 63.1 (64.9) | <.001 |
| community IADLs min/week, mean (SD) | 15.6 (28.5) | 7.6 (14.4) | 14.3 (23.9) | 18.4 (29.4) | 15.4 (25.8) | 19.7 (37.6) | <.001 |
| education min/week, mean (SD) | 6.9 (11.7) | 5.3 (9.4) | 4.6 (7.2) | 6.6 (11.2) | 7.9 (11.8) | 9.0 (15.4) | <.001 |
| environmental adaption min/week, mean (SD) | 0.5 (3) | 0.3 (1.3) | 0.6 (2.5) | 0.7 (2.6) | 0.5 (2.9) | 0.4 (4.5) | 0.311 |
| evaluation min/week, mean (SD) | 5.3 (12.4) | 3.0 (6.9) | 3.7 (8.7) | 4.9 (10.9) | 7.5 (16.0) | 6.8 (15.0) | <.001 |
| home IADLs min/week, mean (SD) | 26.5 (26.4) | 16.2 (18.1) | 24.7 (27.1) | 29.1 (25.6) | 28.9 (26.7) | 30.4 (29.0) | <.001 |
| physical impairments min/week, mean (SD) | 63.1 (57) | 78.7 (57.9) | 66.1 (52.3) | 57.1 (47.4) | 58.3 (53.6) | 59.5 (67.8) | <.001 |
| wheelchair management min/week, mean (SD) | 1.7 (4.9) | 2.2 (4.9) | 1.6 (3.7) | 1.5 (5.2) | 1.5 (4.4) | 1.6 (5.7) | 0.22 |
| assessment min/week, mean (SD) | 27.3 (30.2) | 14.6 (14.9) | 18.3 (19.3) | 27.7 (25.1) | 27.6 (26.8) | 41.8 (42.8) | <.001 |
| bed/chair/WC transfer, feeding, dressing (basic) min/week, mean (SD) | 51.2 (46.8) | 73.8 (48.8) | 65.5 (48.5) | 50.3 (45.2) | 43.0 (40.8) | 32.8 (40.5) | <.001 |
| personal care/transfers (advanced) min/week, mean (SD) | 20.6 (21.2) | 23.7 (22.5) | 23.8 (20.1) | 22.0 (19.5) | 19.3 (21.8) | 15.9 (21.5) | <.001 |
| Physical therapy | |||||||
| advanced locomotion min/week, mean (SD) | 106.5 (86.1) | 106.2 (84.2) | 104.9 (79.7) | 107.8 (77.2) | 105.9 (91.4) | 107.7 (95.8) | 0.985 |
| equip management, transitional movements (basic) min/week, mean (SD) | 58.9 (59.9) | 85.8 (56.1) | 78.2 (65.9) | 61.5 (60.6) | 46.8 (52.2) | 32.7 (48.1) | <.001 |
| evaluation at patient home min/week, mean (SD) | 0.2 (2.3) | 0.1 (0.6) | 0.0 (0.1) | 0.2 (2.1) | 0.2 (2.0) | 0.3 (3.8) | 0.433 |
| formal assessment min/week, mean (SD) | 26.4 (22.8) | 14.3 (12.3) | 18.3 (15.0) | 26.0 (20.0) | 28.7 (20.1) | 39.3 (29.7) | <.001 |
| pre-functional activity and therapeutic exercise min/week, mean (SD) | 64.4 (48.1) | 70.6 (52.6) | 57.1 (39.8) | 55.7 (42.0) | 65.2 (45.4) | 74.0 (55.7) | <.001 |
| pre-gait/standing min/week, mean (SD) | 28.2 (25.1) | 34.0 (23.5) | 32.1 (22.3) | 28.9 (24.3) | 25.4 (26.8) | 23.0 (26.2) | <.001 |
| preparation time min/week, mean (SD) | 7.3 (9.5) | 10.9 (11.9) | 8.2 (10.2) | 6.9 (8.7) | 6.4 (8.4) | 5.1 (8.1) | <.001 |
| resting min/week, mean (SD) | 20.2 (22.4) | 21.9 (19.9) | 19.6 (21.7) | 18.6 (21.4) | 24.9 (25.3) | 17.4 (22.2) | <.001 |
| Speech therapy | |||||||
| assessment min/week, mean (SD) | 40.3 (35.6) | 35.1 (35.3) | 32.9 (31.2) | 40.9 (31.2) | 42.2 (31.9) | 47.5 (43.3) | <.001 |
| attention (both) min/week, mean (SD) | 6.5 (12.7) | 6.8 (9.9) | 7.6 (10.7) | 8.0 (14.0) | 7.1 (16.0) | 3.6 (10.8) | <.001 |
| auditory comprehension (advanced) min/week, mean (SD) | 4.8 (9.1) | 4.6 (7.5) | 5.1 (8.0) | 5.7 (9.3) | 5.4 (11.7) | 3.3 (8.2) | <.001 |
| auditory comprehension/expression (basic) min/week, mean (SD) | 20.2 (35.3) | 52.4 (50.7) | 32.4 (42.1) | 13.3 (22.4) | 9.3 (21.2) | 4.5 (12.9) | <.001 |
| augmentation devices min/week, mean (SD) | 0.6 (5.9) | 0.7 (5.4) | 1.8 (11.2) | 0.5 (5.4) | 0.0 (0.3) | 0.0 (0.1) | <.001 |
| community access/games min/week, mean (SD) | 34.6 (52.6) | 23.0 (39.2) | 40.0 (48.4) | 49.0 (59.1) | 34.8 (56.8) | 23.9 (49.6) | <.001 |
| computer applications min/week, mean (SD) | 0.5 (2.6) | 0.4 (2.3) | 0.6 (2.4) | 0.5 (2.2) | 0.4 (2.5) | 0.5 (3.2) | 0.838 |
| education min/week, mean (SD) | 13 (14.4) | 10.5 (12.2) | 12.4 (12.2) | 15.0 (14.4) | 14.3 (14.9) | 12.1 (16.7) | <.001 |
| expression (advanced) min/week, mean (SD) | 8.4 (14.2) | 8.1 (12.2) | 7.5 (11.0) | 9.8 (14.1) | 9.2 (15.7) | 7.0 (15.9) | 0.012 |
| lip reading min/week, mean (SD) | 0 (0.3) | 0.1 (0.6) | 0.0 (0.2) | 0.0 (0.3) | 0.0 (0.2) | 0.0 (0.0) | <.001 |
| motor speech (basic) min/week, mean (SD) | 4.4 (13) | 6.4 (14.6) | 5.8 (13.8) | 3.7 (11.2) | 4.0 (13.6) | 2.9 (11.9) | <.001 |
| PMV/speaking valve/cork min/week, mean (SD) | 0.6 (3.5) | 1.6 (5.6) | 1.0 (4.7) | 0.4 (2.3) | 0.2 (1.5) | 0.2 (2.5) | <.001 |
| problem solving, math/money, memory/orientation (advanced) min/week, mean (SD) | 77.6 (60.6) | 63.5 (50.3) | 89.4 (58.6) | 95.2 (60.6) | 81.5 (62.2) | 58.0 (59.7) | <.001 |
| reading/writing (advanced) min/week, mean (SD) | 3.4 (8.3) | 1.8 (4.3) | 2.4 (5.3) | 3.6 (7.6) | 4.4 (9.4) | 4.4 (11.2) | <.001 |
| reading/writing (basic) min/week, mean (SD) | 2.5 (7.6) | 3.7 (6.4) | 3.9 (7.7) | 2.8 (7.5) | 1.8 (8.4) | 1.0 (7.2) | <.001 |
| swallowing min/week, mean (SD) | 27.9 (41.5) | 49.2 (45.7) | 44.5 (46.2) | 28.6 (40.4) | 18.8 (37.1) | 7.2 (23.3) | <.001 |
| Psychology | |||||||
| cognitive remediation min/week, mean (SD) | 4.2 (25.3) | 6.3 (30.3) | 3.0 (20.0) | 2.0 (12.0) | 6.0 (33.7) | 4.6 (27.0) | 0.057 |
| total indirect min/week, mean (SD) | 1.2 (6.5) | 1.4 (7.9) | 1.5 (7.3) | 1.0 (4.3) | 1.3 (6.5) | 0.9 (6.4) | 0.56 |
| general TBI education min/week, mean (SD) | 7 (16.3) | 3.0 (7.7) | 6.9 (12.6) | 10.4 (18.1) | 8.0 (19.0) | 5.4 (18.0) | <.001 |
| information and history gathering min/week, mean (SD) | 5.7 (10.2) | 2.8 (8.3) | 3.4 (5.6) | 6.1 (9.9) | 7.3 (10.3) | 8.0 (13.1) | <.001 |
| testing/assessment/behavioral min/week, mean (SD) | 46.8 (61.1) | 28.2 (37.3) | 45.3 (49.5) | 63.4 (64.4) | 50.3 (66.6) | 41.1 (69.4) | <.001 |
| Therapeutic recreation | |||||||
| art min/week, mean (SD) | 3.5 (11.1) | 3.1 (7.2) | 4.2 (10.0) | 4.8 (13.0) | 2.9 (12.7) | 2.4 (10.6) | 0.005 |
| cognitive activity min/week, mean (SD) | 24.5 (37) | 16.3 (24.3) | 24.8 (34.7) | 30.7 (40.5) | 31.0 (42.7) | 18.7 (35.5) | <.001 |
| music min/week, mean (SD) | 1 (4.6) | 1.2 (5.0) | 1.7 (5.8) | 1.4 (6.0) | 0.4 (2.8) | 0.2 (1.9) | <.001 |
| sports min/week, mean (SD) | 6.5 (15.2) | 5.6 (11.5) | 7.1 (14.5) | 8.4 (16.2) | 7.5 (18.0) | 4.1 (13.9) | <.001 |
| community reintegration min/week, mean (SD) | 14.1 (34.1) | 7.9 (17.6) | 13.0 (27.0) | 21.5 (40.6) | 14.4 (33.9) | 11.5 (39.1) | <.001 |
| Medications | |||||||
| % of rehab stay on narcotic-analgesics, mean (SD) | 47.2 (42) | 39.8 (39.9) | 42.0 (39.7) | 45.5 (40.9) | 52.3 (42.6) | 53.8 (44.4) | <.001 |
| % of rehab stay on nonnarcotic- analgesics, mean (SD) | 38.4 (38.8) | 37.6 (37.3) | 33.7 (37.9) | 33.6 (35.9) | 39.7 (38.9) | 46.4 (42.0) | <.001 |
| % of rehab stay on antianxiety agents, mean (SD) | 18.7 (35) | 24.7 (38.5) | 23.5 (36.5) | 18.6 (35.1) | 17.5 (34.9) | 11.9 (29.5) | <.001 |
| % of rehab stay on anticonvulsants, mean (SD) | 38.2 (45.2) | 38.7 (44.2) | 40.1 (44.5) | 38.6 (45.2) | 40.4 (46.9) | 34.2 (44.9) | 0.232 |
| % of rehab stay on antidepressants- new SSRIs, mean (SD) | 9.8 (27) | 10.0 (25.5) | 12.0 (29.5) | 9.7 (27.1) | 10.3 (28.2) | 7.4 (24.3) | 0.161 |
| % of rehab stay on antidepressants- other, mean (SD) | 47.4 (44.2) | 55.8 (43.6) | 54.3 (42.8) | 47.9 (44.7) | 49.1 (44.0) | 34.6 (42.6) | <.001 |
| % of rehab stay on antiparkinsonians, mean (SD) | 18.1 (34.9) | 37.4 (42.1) | 28.3 (40.1) | 16.7 (34.3) | 10.6 (27.1) | 4.8 (20.3) | <.001 |
| % of rehab stay on antipsychotics- second generation, mean (SD) | 16 (32.9) | 21.2 (34.3) | 22.6 (37.4) | 19.0 (36.4) | 13.8 (30.8) | 6.3 (22.3) | <.001 |
| % of rehab stay on hypnotics, mean (SD) | 18 (33.6) | 20.4 (34.9) | 23.1 (36.7) | 19.0 (34.1) | 14.1 (30.8) | 14.6 (31.2) | <.001 |
| % of rehab stay on psychotherapeutics, mean (SD) | 12.5 (29.6) | 14.1 (28.8) | 12.4 (29.0) | 15.2 (32.6) | 14.6 (32.6) | 7.0 (23.8) | <.001 |
| % of rehab stay on stimulants, mean (SD) | 18.5 (33.6) | 38.5 (39.9) | 30.7 (39.6) | 16.0 (31.3) | 9.9 (26.1) | 4.9 (18.8) | <.001 |
| Site, (%) | <.001 | ||||||
| Site 1 | 0.3 | 1.9 | 2.4 | 6.4 | 20.4 | ||
| Site 2 | 18 | 35.6 | 35.4 | 20.3 | 11.7 | ||
| Site 3 | 1.8 | 2.9 | 3.2 | 3.9 | 4.4 | ||
| Site 4 | 7.4 | 12 | 13.1 | 18.6 | 11.3 | ||
| Site 5 | 12.4 | 4.5 | 6.7 | 6.4 | 7.9 | ||
| Site 6 | 13.9 | 5.9 | 5.1 | 7.4 | 9.9 | ||
| Site 7 | 2.9 | 6.4 | 7.5 | 4.4 | 4.6 | ||
| Site 8 | 6.8 | 4.5 | 5.5 | 4.2 | 7.3 | ||
| Site 9 | 23 | 12 | 8.3 | 13 | 7.3 | ||
| Site 10 | 13.6 | 14.2 | 12.9 | 15.4 | 15.1 | ||
| Outcomes | |||||||
| Rehab length of stay excluding interruptions, mean (SD) | 26.5 (19.9) | 40.4 (27.6) | 32.5 (18.4) | 24.4 (15.4) | 21.0 (15.5) | 19.0 (15.1) | <.001 |
| Discharge destination- home (%) | 83.9 | 73.7 | 78.1 | 85.7 | 85 | 92.3 | <.001 |
| Discharge FIM Motor Rasch-transformed, mean (SD) | 55.7 (15.9) | 44.8 (17.5) | 50.7 (13.7) | 56.0 (12.6) | 58.7 (13.2) | 64.4 (15.4) | <.001 |
| Discharge FIM Cog Rasch-transformed, mean (SD) | 54.4 (15.1) | 40.2 (18.0) | 47.0 (10.6) | 53.0 (9.4) | 57.9 (8.5) | 68.3 (11.1) | <.001 |
| 9-Month FIM Motor Rasch-transformed, mean (SD) | 80.7 (20) | 72.6 (25.0) | 77.7 (20.8) | 82.4 (19.1) | 82.8 (16.8) | 85.4 (16.4) | <.001 |
| 9-Month FIM Cog Rasch-transformed, mean (SD) | 76.3 (17.9) | 68.2 (20.6) | 72.0 (18.7) | 76.8 (16.6) | 79.1 (16.2) | 82.3 (14.8) | <.001 |
CSI is a disease-specific severity assessment system that calculates severity scores using physical exam findings, vital signs, and laboratory results at specified levels of abnormality found in a patient’s chart. CSI is based on diseases defined by International Classification of Diseases, 9th Revision, Clinical Modification (ICD-9-CM) and was segmented into signs and symptoms directly related to the brain injury versus all remaining severity symptoms.15
Treatments
Treatments studied were separated into three categories: (a) total minutes per week spent in therapy and level of effort, (b) minutes per week spent in specific activities provided by clinicians from various disciplines including OT, PT, ST, psychology (PSY), and therapeutic recreation (TREC); and (c) percent of the inpatient stay the patient received various pharmacological classes of medications. More detailed information on medication prevalence and use patterns in this sample is presented elsewhere.18 Because of the large number of therapy activities, some collapsing was necessary so that models were not over-specified. OT, PT, and ST activity collapses can be found in detail elsewhere.16 For PSY activities, originally stratified by patient, family, and patient & family minutes, we combined the time spent with patient, family, or both for each PSY activity. TREC activities were grouped into sports, arts, music, cognitive activities, other, and community reintegration. Additional collapsing within each discipline was made for highly correlated (|r|>0.6) and similarly complex activities, but never across disciplines.
To assess each patient’s effort in therapy we also included a single OT/PT/ST average level of effort over the rehabilitation stay as measured by a clinician-rated effort score. Level of effort was measured using the Rehabilitation Intensity of Therapy Scale (RITS), which is a single item, 7-point scale, behaviorally anchored by a hierarchy of observable levels of 60 goal-directed activities including initiating, attending to, and sustaining an activity. Further details about this measure are presented elsewhere.22
Outcomes
Six outcome variables were studied: LOS (which excludes days out of the rehabilitation facility resulting from readmission to acute care), discharge destination (private residence versus institutional setting), and Rasch-transformed FIM Motor and Cognitive scores at two time points: discharge from rehabilitation and 9 months post-discharge.
Data Analyses
Analyses were performed using SAS version 9.2 (SAS Institute, Inc., Cary, NC). When data were missing, one or more adjustments were made depending on the variable and its intended use in analyses. In some instances, we categorized values simply as “unknown” (and included this category in analysis as a dummy variable representing absent data); in other instances we collapsed a continuous variable with missing data into a categorical one and placed the cases with missing information into one of these categories using corroborating data available. In some circumstances missing data resulted in an observation being excluded from a specific model—final sample sizes are reported for all models. Examples are the following: Patients missing continuous measure predictors were allowed to fall out of the models (e.g., 10 patients were missing admission FIM cognitive or motor score, and thus fell out of the model). BMI, while continuous, was broken into <18.5 vs >18.5, where missing was lumped into the reference category (>18.5), since these patients were more similar to one another. Patients who did not receive psychology or therapeutic recreation would necessarily be missing for those variables; we decided to assign these patients a 0 for each activity.
Descriptive statistics were used to provide frequencies and percentages for categorical variables describing patients, treatments, and outcomes; mean, median, quartiles, and standard deviation (SD) were used to summarize continuous measures. Bivariate analyses were conducted to examine differences among FIM Cognitive subgroups. For discrete variables, we used the Fisher’s Exact test or chi-square test to determine significance. For continuous variables we used t-tests, analysis of variance (ANOVA), or the Kruskal-Wallis test. A two-sided p value <0.05 was considered statistically significant.
The intraclass correlation coefficient (ICC) due to site (how strongly patients in the same site resemble one another) and using the full study sample (not divided into subgroups) for the 6 outcomes ranged from 0.03 to 0.10 for all outcomes except Rasch-transformed discharge FIM Motor score, with ICC of 0.22. After dividing into FIM Cognitive subgroups, the average ICC for each outcome ranged from 0.06 to 0.12 for all outcomes except Rasch-transformed discharge FIM Motor score, with average ICC of 0.18. None of these ICC values is very high, so it justifies using ordinary least squares (OLS) to analyze the data, without the need to nest on site.
To assess associations between covariates and outcomes, we used OLS multiple regression or logistic regression. Variables with at least 20 observations that were allowed to enter into the regression models were checked for multi-collinearity. If a correlation ≥|0.60| was observed, one of the pair of variables was removed. The most parsimonious models were created for each of six outcomes within each of the five admission FIM Cognitive subgroups by allowing only significant (p<.05) variables to remain in the models. Variables entering any model and their descriptive statistics are shown in table 1. We used R2 and c statistics to capture how much variation in an outcome was explained by the predictor variables.
Covariates were allowed to enter and be added into each model in one of five blocks: (1) patient and injury characteristics, (2) discipline-specific total minutes/week, (3) percent of stay on medications from each of 8 pharmacological classes (defined elsewhere),18 (4) level of effort (LOE), (5) discipline-specific activity minutes/week, and (6) centers participating in the study. We computed the amount of variation explained when we allowed various combinations of the variable blocks to enter models predicting outcomes. Eight combinations of the blocks of variables numbered above were examined: block 1; blocks 1 and 2; blocks 1 and 3; blocks 1 and 4; blocks 1 and 5; blocks 1, 4, and 5; blocks 1, 3, 4, and 5; and blocks 1, 3, 4, 5, and 6. Within block 6, the centers participating in the study were included to determine whether a significant source of between-center differences remained unexplained after the final model that included all therapeutic activities, LOE, and medications.
RESULTS
Patient, Process, and Outcome Characteristics
Table 1 shows how the 5 FIM Cognitive subgroups differed by predictor and outcome variables. All patient demographic, injury and health, and functional status characteristics except race (p=.083) were significantly different (p<.02) among the admission FIM Cognitive subgroups. The lower cognitive functioning subgroups had more days from injury to rehabilitation admission, lower admission FIM motor scores, tended to be younger, had a larger proportion of patients classified as underweight, a larger proportion of patients with Medicaid as the primary payer, more severe CSI component scores, were agitated for a larger percentage of their rehabilitation stay, and had lower average OT/PT/ST level of effort scores. The greatest percent of patients with anxiety and depression were in the middle admission FIM Cognitive subgroups 7–10 and 11–15 subgroups. Although the number of patient and injury characteristics used in these analyses were fewer when compared to the number of patient individual differences used by Corrigan et al.,23 the total amount of variance accounted for by patient and injury characteristics alone used in this analysis was comparable to that resulting from the more comprehensive starting point.
The data collected demonstrated extreme variation within and between FIM Cognitive subgroups with respect to amount of time spent in various discipline-specific activities. The higher functioning subgroups (admission FIM Cognitive score ≥16) received less OT, PT, and ST total minutes/week than did the lower functioning subgroups (admission FIM Cognitive score ≤10). PSY and TREC showed a bell-shaped pattern with the middle functioning subgroups (admission FIM Cognitive score between 11 and 20) receiving the most minutes/week. For many activities across each of the disciplines, the standard deviation was bigger than the mean minutes/week, suggesting that even within the relatively homogenous admission FIM Cognitive subgroups, there was significant treatment variation.
Between admission and discharge, all subgroups showed improved outcomes for Rasch-transformed FIM Motor and Cognitive scores, with the lower functioning subgroups generally receiving more therapeutic activities compared to the higher functioning subgroups. Going from lower to higher functioning subgroups, the change in Rasch-transformed FIM Motor scores from admission to discharge went from 33.3 points to 16.1 points decreasing monotonically across higher subgroups. For Rasch-transformed FIM Cognitive scores, the change from admission to discharge went from 37.7 points to 8.7 points decreasing monotonically. Also, improvement in outcomes was seen between discharge and 9 months post-discharge in both higher and lower functioning patients (see table 1).
Classes of medications used also varied greatly between and within admission FIM Cognitive subgroups. Lower functioning patients (admission FIM Cognitive score ≤10) tended to use narcotic-analgesics for a smaller percentage of their rehabilitation stay, and a larger percentage of their stay using antianxiety agents, antiparkinson agents, older antidepressants, second-generation antipsychotics, hypnotics, and stimulants. Standard deviations were often larger than means, again suggesting great variation in use within admission FIM Cognitive subgroups.
All outcomes (except discharge to a private residence in the 11–20 admission FIM Cognitive subgroup) showed a monotonic relationship across FIM Cognitive subgroups—lower functioning patients tended to have longer lengths of stay, smaller proportions discharged to a private residence, and lower Rasch-transformed FIM Motor and Cognitive scores at discharge and 9 months post-discharge.
Ordinary Least Squares and Logistic Regression Results
Table 2 shows the number of patients included in each model, along with the R2 values for blocks of variables for continuous outcomes, and c-statistics for blocks of variables for the dichotomous discharge destination. Patient and injury characteristics alone explained from 10% to 71% of the variation in discharge outcomes. On average, patient and injury characteristics explained much more variation in Rasch-transformed FIM Motor scores at discharge than in either the Rasch-transformed FIM Cognitive scores at discharge or rehabilitation length of stay. In contrast, patient and injury characteristics alone explained from 5% to 39% of the variation in 9-month outcomes. When total discipline-specific therapy minutes/week were allowed to enter, little additional explanatory power resulted beyond that found for patient and injury characteristics (between 0% and 5%, with a mean added R2 of 1.5% across subgroups and outcomes).
Table 2.
Ordinary Least Squares or Logistic Regression Model Blocks for all Dependent Variables by Admission FIM Cognitive Score
| Dependent Variable | Block | R2/c-Statistic Adm Cog <=6 | R2/c-Statistic Adm Cog 7–10 | R2/c-Statistic Adm Cog 11–15 | R2/c-Statistic Adm Cog 16–20 | R2/c-Statistic Adm Cog >=21 |
|---|---|---|---|---|---|---|
| Rehab Length of Stay (LoS) | N used | 338 | 366 | 481 | 382 | 400 |
| Patient, injury | 0.1564 | 0.3121 | 0.4068 | 0.3931 | 0.4338 | |
| Patient, injury + POC tot | 0.204 | 0.3263 | 0.3985 | 0.3931 | 0.4643 | |
| Patient, injury + meds | 0.217 | 0.322 | 0.4322 | 0.3931 | 0.4487 | |
| Patient, injury + LOE | 0.1564 | 0.3121 | 0.4076 | 0.4056 | 0.4338 | |
| Patient, injury + POC act | 0.3382 | 0.4684 | 0.533 | 0.5302 | 0.589 | |
| Patient, injury + POC act + LOE | 0.3382 | 0.469 | 0.5331 | 0.5482 | 0.5893 | |
| Patient, injury + POC act + LOE + meds | 0.3738 | 0.4828 | 0.5498 | 0.5482 | 0.5893 | |
| Patient, injury + POC act + LOE + meds + sites | 0.4531 | 0.4828 | 0.5831 | 0.5837 | 0.5804 | |
| Discharge to home (dcH) | N used | 339 | 373 | 493 | 407 | 502 |
| Patient, injury | 0.734 | 0.793 | 0.778 | 0.748 | 0.712 | |
| Patient, injury + POC tot | 0.779 | 0.793 | 0.783 | 0.766 | 0.738 | |
| Patient, injury + meds | 0.734 | 0.793 | 0.778 | 0.789 | 0.712 | |
| Patient, injury + LOE | 0.753 | 0.816 | 0.788 | 0.764 | 0.713 | |
| Patient, injury + POC act | 0.896 | 0.858 | 0.841 | 0.792 | 0.778 | |
| Patient, injury + POC act + LOE | 0.906 | 0.844 | 0.845 | 0.802 | 0.779 | |
| Patient, injury + POC act + LOE + meds | 0.906 | 0.865 | 0.845 | 0.84 | 0.779 | |
| Patient, injury + POC act + LOE + meds + sites | 0.906 | 0.865 | 0.845 | 0.84 | 0.779 | |
| Discharge FIM Motor (dcM) | N used | 339 | 373 | 493 | 407 | 502 |
| Patient, injury | 0.3784 | 0.4789 | 0.4811 | 0.5363 | 0.7143 | |
| Patient, injury + POC tot | 0.4077 | 0.4916 | 0.4811 | 0.558 | 0.7222 | |
| Patient, injury + meds | 0.4143 | 0.4789 | 0.4811 | 0.5459 | 0.7163 | |
| Patient, injury + LOE | 0.5917 | 0.561 | 0.5344 | 0.5578 | 0.7151 | |
| Patient, injury + POC act | 0.6874 | 0.6475 | 0.5769 | 0.5908 | 0.7617 | |
| Patient, injury + POC act + LOE | 0.7417 | 0.6951 | 0.6249 | 0.6207 | 0.7619 | |
| Patient, injury + POC act + LOE + meds | 0.7391 | 0.6988 | 0.626 | 0.6263 | 0.7644 | |
| Patient, injury + POC act + LOE + meds + sites | 0.7391 | 0.7053 | 0.6325 | 0.6493 | 0.7759 | |
| Discharge FIM Cognitive (dcC) | N used | 339 | 373 | 493 | 407 | 502 |
| Patient, injury | 0.2088 | 0.2102 | 0.1412 | 0.0958 | 0.4049 | |
| Patient, injury + POC tot | 0.2232 | 0.2189 | 0.1412 | 0.1066 | 0.4382 | |
| Patient, injury + meds | 0.229 | 0.2213 | 0.1563 | 0.1139 | 0.4115 | |
| Patient, injury + LOE | 0.5377 | 0.4193 | 0.2731 | 0.2217 | 0.4539 | |
| Patient, injury + POC act | 0.5294 | 0.3738 | 0.2419 | 0.164 | 0.4423 | |
| Patient, injury + POC act + LOE | 0.6452 | 0.5097 | 0.3847 | 0.2904 | 0.501 | |
| Patient, injury + POC act + LOE + meds | 0.6394 | 0.5183 | 0.3948 | 0.3005 | 0.501 | |
| Patient, injury + POC act + LOE + meds + sites | 0.6697 | 0.5586 | 0.4498 | 0.3469 | 0.5788 | |
| 9-month FIM Motor (fuM) | N used | 241 | 273 | 359 | 282 | 347 |
| Patient, injury | 0.3792 | 0.3608 | 0.3892 | 0.2763 | 0.2528 | |
| Patient, injury + POC tot | 0.422 | 0.3608 | 0.3892 | 0.2763 | 0.2494 | |
| Patient, injury + meds | 0.4038 | 0.3772 | 0.3892 | 0.2903 | 0.2652 | |
| Patient, injury + LOE | 0.4675 | 0.3881 | 0.4136 | 0.3035 | 0.2298 | |
| Patient, injury + POC act | 0.6442 | 0.5036 | 0.5065 | 0.3147 | 0.3341 | |
| Patient, injury + POC act + LOE | 0.6454 | 0.5006 | 0.5097 | 0.3318 | 0.3324 | |
| Patient, injury + POC act + LOE + meds | 0.6454 | 0.5283 | 0.5097 | 0.3511 | 0.3479 | |
| Patient, injury + POC act + LOE + meds + sites | 0.6619 | 0.5283 | 0.5165 | 0.3511 | 0.38 | |
| 9-month FIM Cognitive (fuC) | N used | 246 | 275 | 363 | 284 | 356 |
| Patient, injury | 0.1791 | 0.1841 | 0.076 | 0.0482 | 0.0891 | |
| Patient, injury + POC tot | 0.23 | 0.1982 | 0.076 | 0.0617 | 0.1173 | |
| Patient, injury + meds | 0.1791 | 0.1972 | 0.076 | 0.0941 | 0.0993 | |
| Patient, injury + LOE | 0.2698 | 0.1999 | 0.0858 | 0.0867 | 0.1121 | |
| Patient, injury + POC act | 0.3714 | 0.3079 | 0.1101 | 0.1614 | 0.1421 | |
| Patient, injury + POC act + LOE | 0.3558 | 0.3179 | 0.0971 | 0.1894 | 0.1425 | |
| Patient, injury + POC act + LOE + meds | 0.3558 | 0.3385 | 0.0971 | 0.2029 | 0.1527 | |
| Patient, injury + POC act + LOE + meds + sites | 0.3558 | 0.3352 | 0.0971 | 0.1887 | 0.1462 |
There were greater increases in explanatory power when time for each discipline was broken down by specific activities performed. When minutes/week of discipline-specific activities were allowed to enter the models, the mean added value of R2 was 13.1% (14.1% for discharge outcomes and 11.6% for 9-month outcomes) compared to the R2 for patient and injury characteristics alone. When OT/PT/ST patient effort in therapy was added, in addition to discipline-specific activities, the increase was higher: 16.4% average added R2 (19.3% for discharge outcomes and 11.9% for 9-month outcomes).
For all outcomes and within every admission FIM Cognitive subgroup, medication use added less to the variation explained than did the discipline-specific activities. When medications were added to patient and injury characteristics and time and effort spent in discipline-specific activities, the mean added R2 was less than 2% beyond the mean R2 without medications. The block of variables indicating which center a patient was treated in also added little explanatory power. The most variance accounted for by site indicators was an additional 8% for the model predicting discharge FIM cognitive in the admission FIM Cognitive subgroup >21; the mean added R2 was 1.9% beyond that of patient, injury, activity times, level of effort, and medications (see table 2).
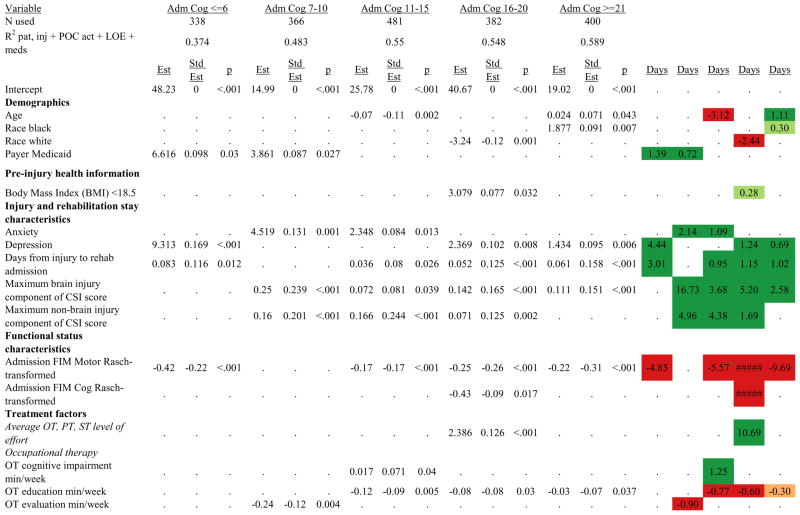
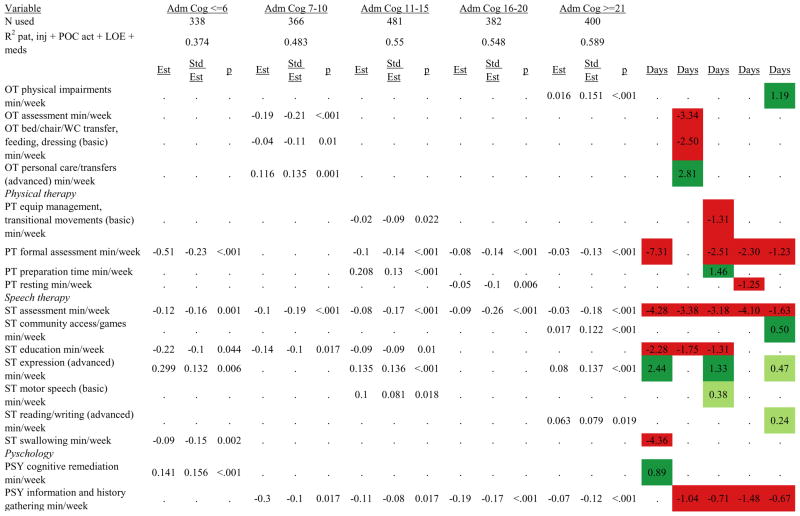
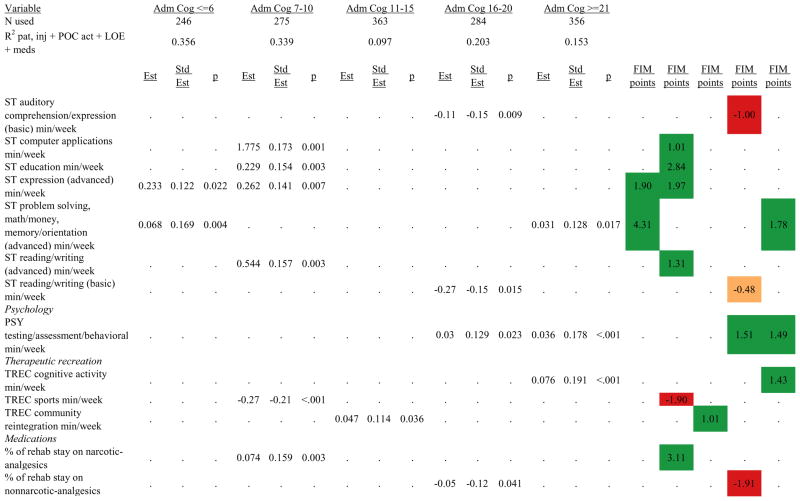
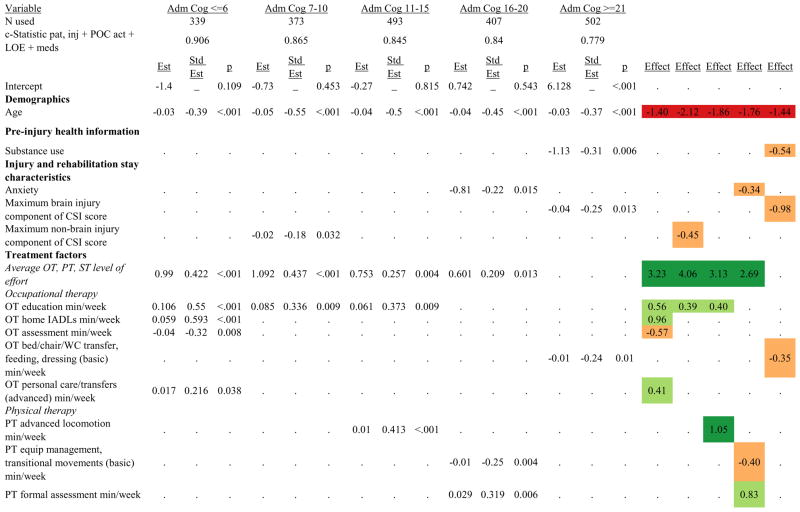
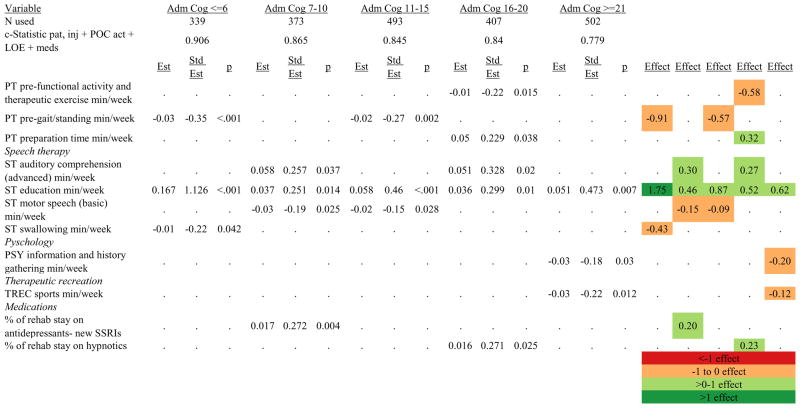
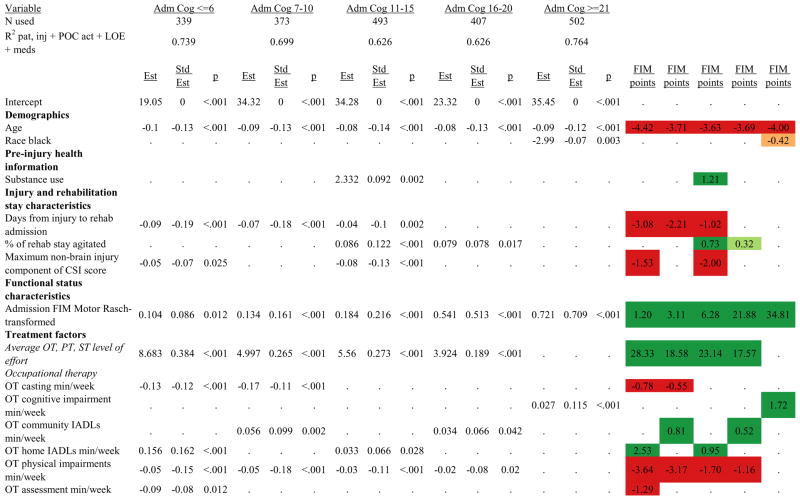
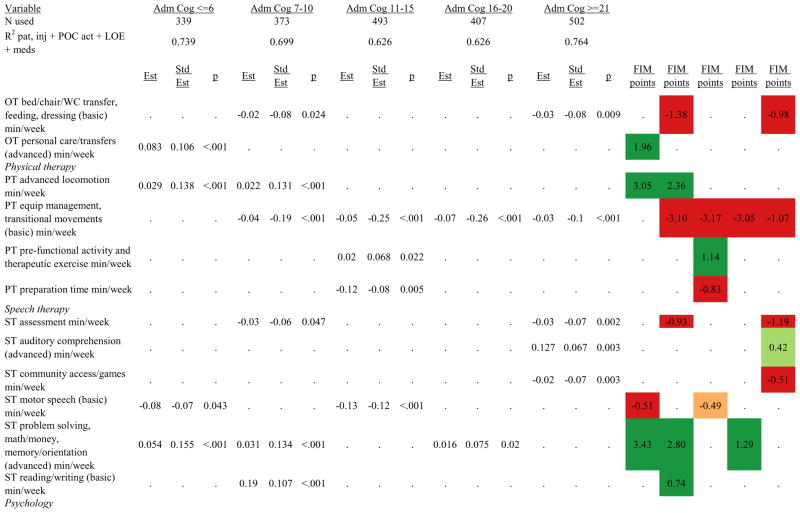
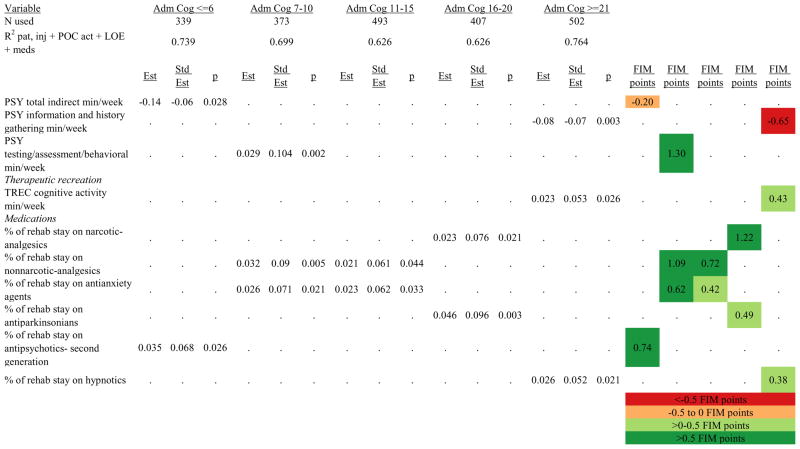
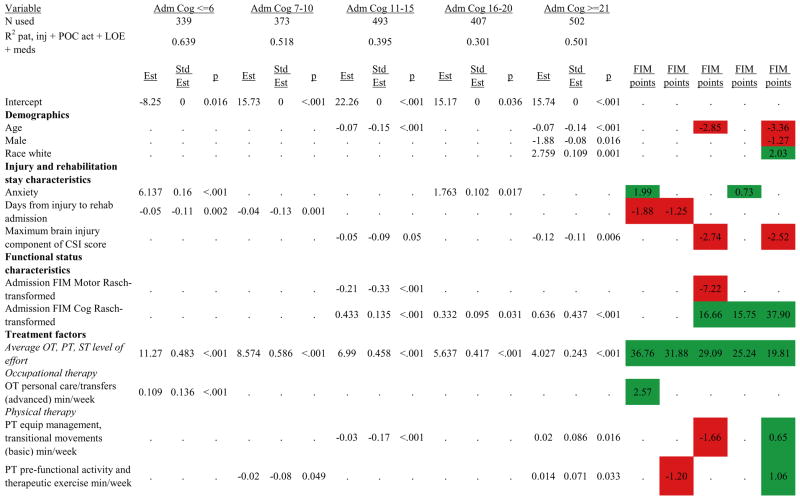
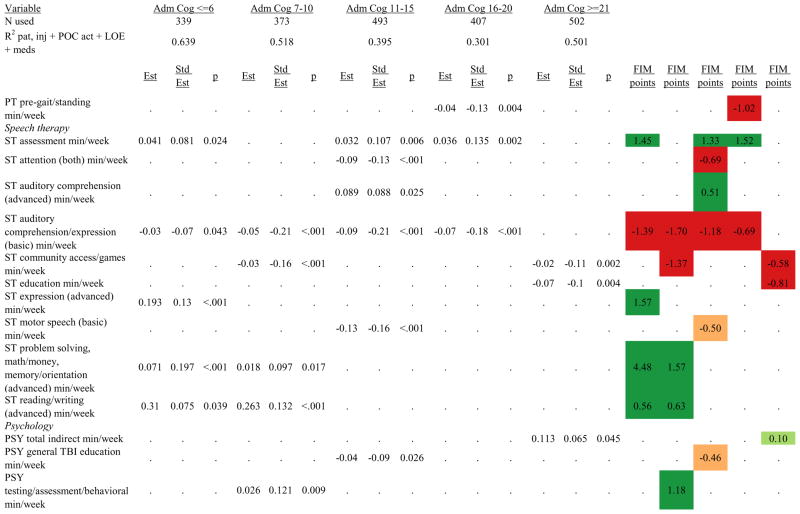
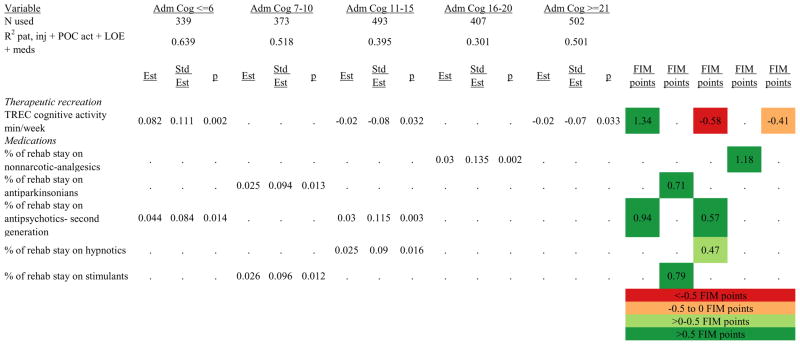
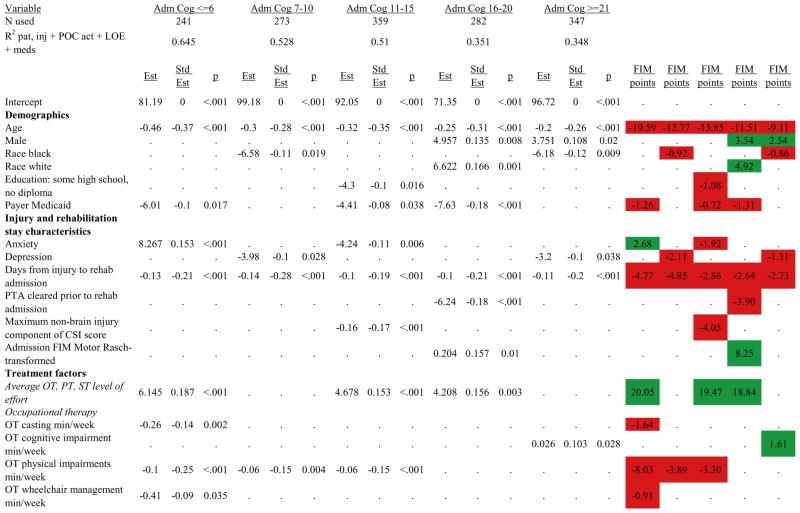
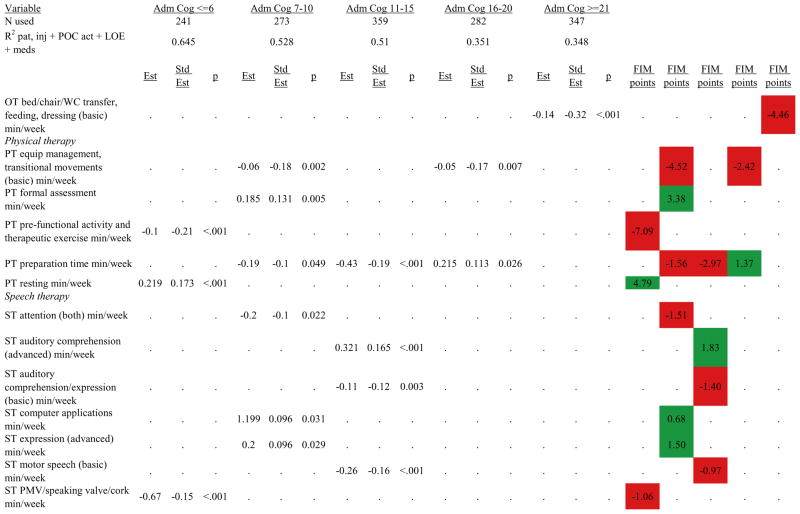
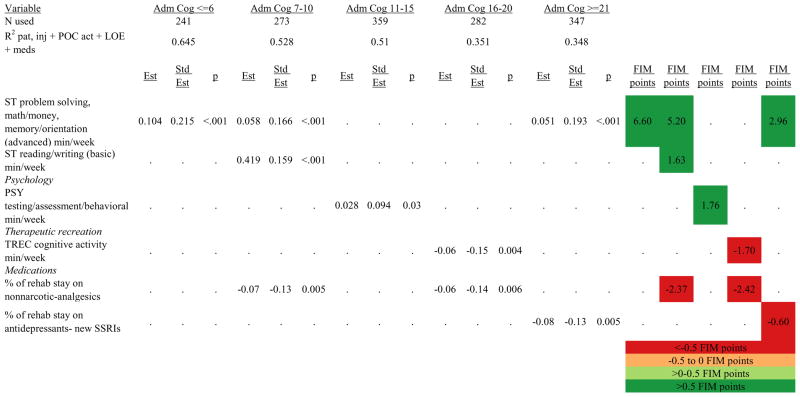
Figures 1 through 6 show regression model details for the 6 outcome variables for each of the 5 admission FIM Cognitive subgroups. Models include patient and injury characteristics, patient effort, minutes/week spent in discipline-specific activities, and percent of the rehabilitation stay on given classes of medications. Each subgroup model includes three columns: the least squares regression (OLS) coefficient (parameter), the standardized coefficient estimating the effect of the variable, and p-value. Additionally, in the right hand columns there are colored cells that represent the associated relative strength of each significant variable’s effect on the outcome being modeled. This effect is measured by multiplying the OLS regression coefficient estimate by the subgroup mean value of that covariate (or by the prevalence of binary factors). For example, in the admission FIM Cognitive ≤6 subgroup model predicting rehabilitation LOS, the parameter estimate for Rasch-transformed admission FIM Motor is −0.422 while the effect on LOS is −4.85 indicating a covariate mean value in this subgroup of −4.85/−0.422 = 11.5. The interpretation for this relationship is that a 1-point increase in Rasch-transformed admission FIM Motor score is associated with a 4.85 day decrease in the patient’s rehabilitation LOS for the average patient in the lowest functioning subgroup, controlling for other variables in the model. Darker or lighter green cells indicate a stronger or weaker positive effect, respectively, while darker or lighter red cells indicate a stronger or weaker negative effect on the outcome.
Figure 1.
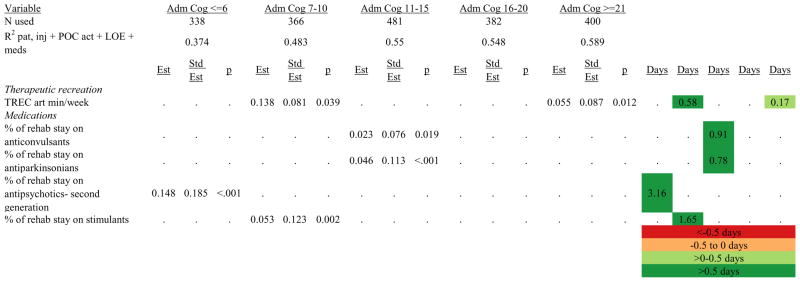
Ordinary Least Squares Regression Models Predicting Rehabilitation Length of Stay by Admission FIM Cognitive Score.
Footnote. Red values indicate a negative association (coefficient), while green indicates a positive one. Dark green and red values indicate >+0.5 days or <−0.5 days, respectively. Light green and red values indicate +0.5 to 0 days or −0.5 to 0 days, respectively. Abbreviations: FIM, Functional Independence Measure; LOE, level of effort; CSI, Comprehensive Severity Index; PTA, post traumatic amnesia; OT, occupational therapy; PSY, psychology; PT, physical therapy; ST, speech therapy; TREC, therapeutic recreation.
Figure 6.

Ordinary Least Squares Regression Models Predicting Rasch-Transformed 9-Month FIM Cognitive Score by Admission FIM Cognitive Score
Footnote. Red values indicate a negative association (coefficient), while green indicates a positive one. Dark green and red values indicate >+0.5 FIM points or <−0.5 FIM points, respectively. Light green and red values indicate +0.5 to 0 FIM points or −0.5 to 0 FIM points, respectively. Abbreviations: FIM, Functional Independence Measure; LOE, level of effort; CSI, Comprehensive Severity Index; PTA, post traumatic amnesia; OT, occupational therapy; PSY, psychology; PT, physical therapy; ST, speech therapy; TREC, therapeutic recreation.
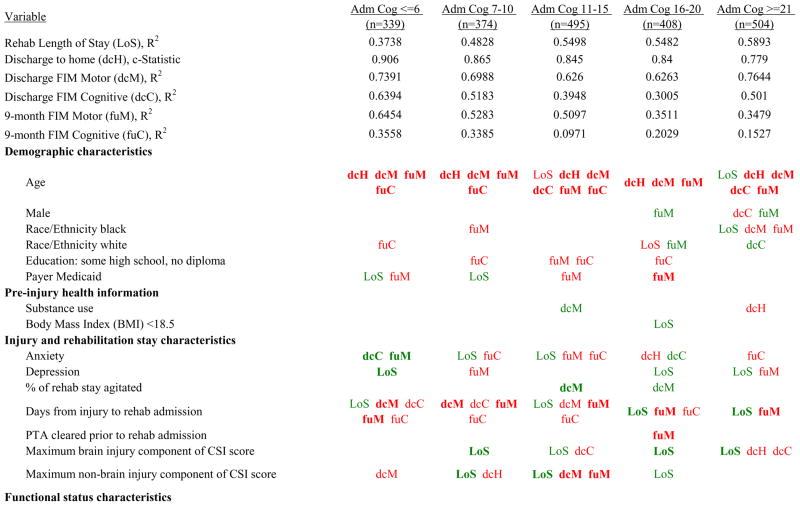
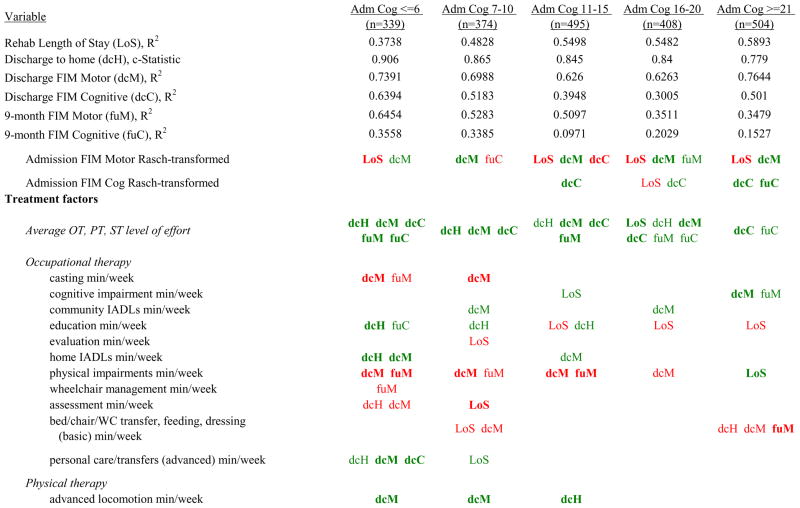
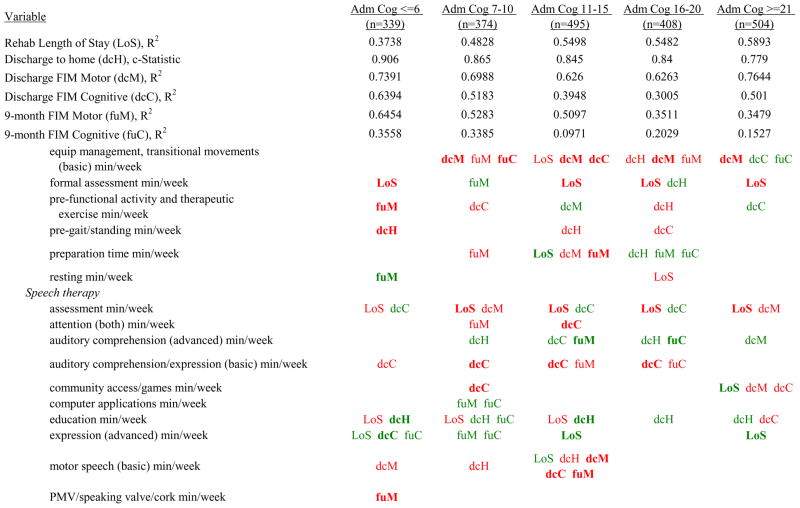
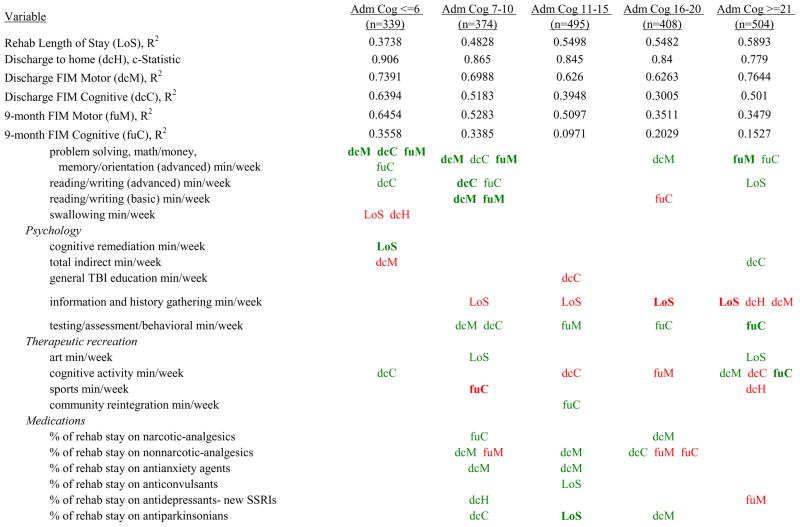
Figure 7 shows a high-level summary of the significant variables in figures 1 through 6 for each dependent variable by admission FIM Cognitive subgroup. Cells containing “LoS” (rehabilitation length of stay), “dcH” (discharge to home), “dcM” (discharge FIM Motor), “dcC” (discharge FIM Cognitive), “fuM” (9-month post-discharge FIM Motor), or “fuC” (9-month post-discharge FIM Cognitive) indicate that in the final model for the specified dependent variable the covariate in the row is a significant predictor (p<.001 if bolded, and p<.05 if not). Red values indicate a negative association (coefficient), while green values indicate a positive one.
Figure 7.

Summary of Significant Covariates by Admission FIM Cognitive Score
Footnote. Red values indicate a negative association (coefficient), while green indicates a positive one. Bold values indicate p<0.001. Not bold values indicate p between 0.001 and 0.05.
Examples of how to read figure 7 follow. In every case, the parameter estimate is with all other variables in the model held constant. Older patients in every subgroup had lower discharge and 9-month FIM Motor scores, were less likely to go home, and had lower 9-month FIM Cognitive scores in all but the two highest functioning subgroups. Patients who were able to give greater effort in therapy (as measured by higher clinician-rated effort score) have generally higher discharge and 9-month Motor and Cognitive FIM scores, and are more likely to be discharged to a private residence. Most patients who had more days from injury to rehabilitation admission had longer lengths of stay, were discharged with lower Motor and Cognitive FIM scores, and had lower 9-month FIM scores.
Therapeutic activities associated with outcomes differed between the subgroups. For example, more time spent in patient education during OT sessions was associated with a higher likelihood of going home in the three lowest functioning subgroups, and was associated with a shorter length of stay in the three highest functioning subgroups. There were additional positive associations with cognitive function and more OT patient education minutes/week in the lowest functioning subgroup (e.g., higher 9-month FIM Cognitive scores). More time spent in advanced activities (whether cognitive or physical) was often associated with better outcomes in all subgroups and across all dependent variables. For example, in the lowest functioning subgroup, more time spent in ST activities that involved problem solving, math or money, and memory was associated with higher discharge and 9-month FIM Motor and Cognitive scores. These same ST activities were associated with higher scores for one or more of those same outcomes in all other subgroups except admission FIM Cognitive 11–15. More minutes/week spent in activities such as PT equipment management, wheelchair mobility, casting, and transitional movements were associated with poorer outcomes across all admission FIM Cognitive subgroups, except the lowest and highest scoring cognitive groups.
Percent of a patient’s rehabilitation stay involving the use of certain pharmacological classes of medications had varying associations with outcomes among admission FIM Cognitive subgroups. A larger percentage of a patient’s stay involving the use of nonnarcotic-analgesics, for example, was associated with a higher discharge FIM Motor score, but lower 9-month follow-up scores in the 7–10 subgroup, while in the 16–20 FIM Cognitive subgroup, higher discharge FIM Cognitive but lower 9-month FIM Motor and Cognitive scores were found. Patients in the admission FIM Cognitive 11–15 subgroup on second-generation antipsychotics for a larger percentage of their stay had higher discharge FIM Cognitive scores; patients with admission FIM Cognitive ≤6 showed higher discharge FIM Motor scores in addition to Cognitive, but also had a longer associated rehabilitation LOS. A larger percentage of the rehabilitation stay on hypnotics was associated with either a higher likelihood of going home, or higher discharge FIM Motor and Cognitive scores in the three highest functioning subgroups.
DISCUSSION
The purpose of PBE designs is to identify associations between numerous patient, injury, treatment, and outcome variables. PBE designs increase the likelihood that associations will replicate in other cohorts, due largely to the inclusion of many covariates in the models adding strength to the robustness of the findings. The specific aim of this PBE study was to examine which patient and injury characteristics, therapy activities, and classes of medication are associated with better outcomes at discharge from acute inpatient rehabilitation and at 9-months post-discharge. We found consistencies in associations for most patient pre-injury and injury characteristics, as well as most therapy activities, across all five admission FIM Cognitive subgroups. That is, if a variable was associated with a positive outcome for one FIM Cognitive subgroup then it usually was positive in other FIM Cognitive subgroups. For those therapy activities associated with outcomes, a critical question is whether the activity is a marker of the directionality of the outcome (i.e., poorer or better), or a cause of it? If the latter, there may be opportunities to better deploy therapy time or optimize medication use.
At a macro level, several observations that were evident across dependent variables merit discussion. For all dependent variables, including effort in therapy and time in specific activities increased prediction beyond that attained using only total time in therapy. Furthermore, in some analyses the increases were quite marked. For instance, for discharge FIM Cognitive, the addition of effort in therapy and the specific activities employed by therapists more than doubled the percent of variance accounted for in four of the five admission FIM Cognitive subgroups.
A second macro observation of note was that rehabilitation LOS minimally affected prediction of outcomes when allowed to enter models as a treatment characteristic. This variable was not included in final models due to LOS adding little to explanatory power of the models and in some cases beneficial activity variables were subsumed by LOS. The insignificance of LOS as a variable is the second variable associated with time that did not provide predictive power (total therapy time is the other variable).
A third macro observation was the consistency with which the inclusion of specific therapy activities increased prediction over models that relied only on patient and injury characteristics. For continuous outcomes at discharge from inpatient rehabilitation, the smallest additional percent of variance accounted for was approximately 2%, and the largest was almost 45%. This phenomenon was more pronounced in lower functioning subgroups. All three of these macro observations underscore the importance of knowing what actually takes place in the therapeutic encounter to predict outcomes. Knowing only aggregates of time, whether it be total time in therapy or LOS, is not as strongly associated with outcome as time spent in specific therapy activities utilized.
Longer time from day of injury to rehabilitation admission is a patient injury characteristic that was consistently found to be strongly associated with poorer outcomes, specifically longer rehabilitation LOS and lower FIM Motor and Cognitive scores at discharge and 9-months post-discharge. This relationship was also observed in the PBE stroke study and has been reported by a variety of other authors.24–33 Acute LOS clearly is prolonged with more severe brain injury and greater secondary injuries; however, in our study acute LOS (i.e., day of injury to rehabilitation admission) added more to prediction than direct measures of injury severity. Wagner suggested that one way to decrease acute LOS is early consultation by a physical medicine and rehabilitation specialist.33 However, what determines timing of transfer to rehabilitation admission is complicated, and influenced by patient and medical status, payer policies, acute to post-acute facility relationships, and availability of post-acute facilities. Even though evidence suggests that earlier transfer to rehabilitation may lead to better patient outcomes, as this study suggests, if the rehabilitation facility is not reimbursed adequately for addressing acute medical issues, a strong disincentive exists to admit these patients sooner post-injury. Clinical experience from the past decade of change in rehabilitation practices has shown that a higher level of preparation is necessary to manage more medically acute patients who transfer from acute care soon after injury.
Rehabilitation practice traditionally has been based on the assumption that there is a sequence of recovery that must be followed to restore normal function, and that challenging patients too quickly or encouraging compensatory strategies too early will be counterproductive.28–31 However, findings from this study argue against this assumption. We found significantly better outcomes across all admission FIM Cognitive subgroups were associated with more minutes/week spent in advanced or more complex activities and less time spent in lower level or less complex activities. This finding was demonstrated across all three of the primary disciplines—OT, PT, and ST—and replicates findings from previous PBE studies for stroke and pediatric rehabilitation populations.24, 25 Practice-based evidence studies with stroke patients found that therapy that challenges patients with severe impairments, such as therapies targeting advanced gait (negotiating uneven surfaces), home management, and problem-solving, were associated with better outcomes than therapies targeting lower level functions such as bed mobility and basic speech.24,32,33 Moreover, those studies found that better outcomes were associated with using advanced therapies earlier in treatment. Challenging activities may be more meaningful and familiar to patients (e.g., ambulating in the community versus down the hospital hall), and potentially could increase motivation to participate in treatment.
As with other findings from the current study, causation cannot be assumed, and it is possible that those who received the more advanced therapies were already on a recovery trajectory leading to better outcomes before the onset of the treatment. However, given control of initial level of disability and other key variables, the alternative hypothesis that advanced therapies contributed to better outcomes should be seriously entertained. The current findings add additional support to the alternative notion that use of therapy activities targeting functions at a higher level than the patient’s current level of functioning may be associated with better outcomes.24
The total number of minutes spent in treatment contributed minimally to the prediction of outcomes. This finding calls into question a number of regulatory criteria for acute inpatient rehabilitation. For example, the Centers for Medicare and Medicaid Services requires that patients receive a minimum “dosage” of rehabilitation (e.g., 3-hours of treatment 5 days per week). Yet evidence that dosage of rehabilitation treatment has an impact on outcomes is sparse. A systematic review suggesting that the evidence is “strong” was based on four small sample studies (n=51 to 131) conducted in the 1990s in rehabilitation settings that significantly diverged from current practice in the United States.34 Today, patients arrive to rehabilitation sooner post-injury and with greater medical complexity. They also leave more quickly. The current study and prior discipline-specific studies of therapy intensity suggest: (a) the components of treatment have a stronger impact on outcomes than total time, and (b) patient tolerance and preference in regard to intensity need to be taken into account.25,35–38
Results from the current study indicate that the level of effort a patient is able to expend in therapy is a critical predictor of rehabilitation outcomes, a finding that is corroborated by other recent studies.39–41 Such findings may run contrary to practices that have become common since implementation of the 3-hour rule. For example, is a rigid practice of providing 3 hours of therapy each Monday through Friday a poor deployment of resources when a patient is experiencing agitation, pain, or other discomfort affecting effort? Would therapy time be better spent later in the stay when these conditions that detract from effort have resolved or are more easily tolerated? In contrast, attempts to assure compliance with the 3-hour rule necessitate therapists make up cancelled sessions at the end of the day, oftentimes when patients are more fatigued and unable to put forth their best effort. Is pushing an exhausted patient through the last 30 minutes needed to reach 3 hours that day the best use of therapeutic resources?
With limited evidence to inform the use of neuroactive medications during inpatient rehabilitation, rehabilitation professionals often wonder if such medications are hastening, hindering, or having no impact on short- and long-term outcomes.42–45 Numerous positive associations were identified for the use of a variety of medication classes in the discharge outcome models. In fact, all significant medication classes were associated with positive outcomes at discharge. Despite these numerous positive associations with discharge outcomes, the only medication class to be associated with positive outcomes at discharge and 9-months post-discharge was narcotic analgesics, suggesting that the benefits of medications may wane over time and have little or no substantial influence on longer-term recovery. Furthermore, the negative associations of medications with outcomes at 9-months post-discharge suggest that certain classes of medications may actually be deleterious to long-term outcome following discharge from acute rehabilitation. Specifically, second generation antipsychotics, psychotherapeutics, and non-narcotic analgesics were negatively associated with 9-month post-discharge Cognitive status; and new SSRI antidepressants and non-narcotic analgesics were negatively associated with Motor function. Further research is warranted to determine if these negative findings are causative of worse outcomes—in which case they should be avoided during inpatient rehabilitation—or if the associations are simply markers of higher patient severity and consequent worse outcomes.
Limitations
Some limitations to the study should be noted. Although we collected comprehensive data on a large sample of TBI patients treated in brain injury rehabilitation units in geographically diverse parts of the country, there were data elements that we could not be collected due to not being present in available documentation. These variables included measures of acute hospital findings, home environment, caregiver characteristics, and socioeconomic factors. The extent to which these variables may affect our findings is unknown. The analyses reported here also did not examine various combinations of therapy activities and thus cannot speak to interactive effects and their potential impact on outcomes.
CONCLUSIONS
This article presents promising insights into therapy activities and medications that are associated with better outcomes. Greater patient level of effort during therapy sessions, time spent in more complex therapy activities, and use of specific medications were associated with better outcomes at discharge for patients in all admission FIM Cognitive subgroups. Further research is warranted to examine more specific combinations of therapy activities and medications that are associated with better outcomes. At 9-months post-discharge, the associations with inpatient therapies were less pronounced and pervasive, but some relationships were still evident. In contrast, positive associations that were observed between classes of medications used during inpatient rehabilitation were negatively associated with outcomes 9 months post-discharge.
Figure 2.
Logistic Regression Models Predicting Discharge Destination Home by Admission FIM Cognitive Score.
Footnote. Effect equals the predictor’s effect on the logit (exponential function) of the regression coefficient. Red values indicate a negative association (coefficient), while green indicates a positive one. Dark green and red values indicate >+1 effect or <−1 effect, respectively. Light green and red values indicate +1 to 0 effect or −1 to 0 effect, respectively. Abbreviations: FIM, Functional Independence Measure; LOE, level of effort; CSI, Comprehensive Severity Index; PTA, post traumatic amnesia; OT, occupational therapy; PSY, psychology; PT, physical therapy; ST, speech therapy; TREC, therapeutic recreation.
Figure 3.
Ordinary Least Squares Regression Models Predicting Rasch-Transformed Discharge FIM Motor Score by Admission FIM Cognitive Score.
Footnote. Red values indicate a negative association (coefficient), while green indicates a positive one. Dark green and red values indicate >+0.5 FIM points or <−0.5 FIM points, respectively. Light green and red values indicate +0.5 to 0 FIM points or −0.5 to 0 FIM points, respectively. Abbreviations: FIM, Functional Independence Measure; LOE, level of effort; CSI, Comprehensive Severity Index; PTA, post traumatic amnesia; OT, occupational therapy; PSY, psychology; PT, physical therapy; ST, speech therapy; TREC, therapeutic recreation.
Figure 4.
Ordinary Least Squares Regression Models Predicting Rasch-Transformed Discharge FIM Cognitive Score by Admission FIM Cognitive Score
Footnote. Red values indicate a negative association (coefficient), while green indicates a positive one. Dark green and red values indicate >+0.5 FIM points or <−0.5 FIM points, respectively. Light green and red values indicate +0.5 to 0 FIM points or −0.5 to 0 FIM points, respectively. Abbreviations: FIM, Functional Independence Measure; LOE, level of effort; CSI, Comprehensive Severity Index; PTA, post traumatic amnesia; OT, occupational therapy; PSY, psychology; PT, physical therapy; ST, speech therapy; TREC, therapeutic recreation.
Figure 5.
Ordinary Least Squares Regression Models Predicting Rasch-Transformed 9-Month FIM Motor Score by Admission FIM Cognitive Score
Footnote. Red values indicate a negative association (coefficient), while green indicates a positive one. Dark green and red values indicate >+0.5 FIM points or <−0.5 FIM points, respectively. Light green and red values indicate +0.5 to 0 FIM points or −0.5 to 0 FIM points, respectively. Abbreviations: FIM, Functional Independence Measure; LOE, level of effort; CSI, Comprehensive Severity Index; PTA, post traumatic amnesia; OT, occupational therapy; PSY, psychology; PT, physical therapy; ST, speech therapy; PMV, Passy-Muir valve; TREC, therapeutic recreation.
Acknowledgments
Financial Support: Funding for this study came from the National Institutes of Health, National Center for Medical Rehabilitation Research (grant 1R01HD050439-01), the National Institute on Disability and Rehabilitation Research (grant H133A080023), and the Ontario Neurotrauma Foundation (grant 2007-ABI-ISIS-525).
We gratefully acknowledge the contributions of clinical and research staff at each of the 10 inpatient rehabilitation facilities represented in the study. The study center directors included: John D. Corrigan, PhD and Jennifer Bogner, PhD (Department of Physical Medicine and Rehabilitation, Ohio State University, Columbus, OH); Nora Cullen, MD (Toronto Rehabilitation Institute, Toronto, ON Canada); Cynthia L. Beaulieu, PhD (Brooks Rehabilitation Hospital, Jacksonville, FL); Flora M. Hammond, MD (Carolinas Rehabilitation, Charlotte, NC [now at Indiana University]); David K. Ryser, MD (Neuro Specialty Rehabilitation Unit, Intermountain Medical Center, Salt Lake City, UT); Murray E. Brandstater, MD (Loma Linda University Medical Center, Loma Linda, CA); Marcel P. Dijkers, PhD (Mount Sinai Medical Center, New York, NY); William Garmoe, PhD (Medstar National Rehabilitation Hospital, Washington, DC); James A. Young, MD (Physical Medicine and Rehabilitation, Rush University Medical Center, Chicago, IL); Ronald T. Seel, PhD (Crawford Research Institute, Shepherd Center, Atlanta, GA). We also acknowledge the contributions of Michael Watkiss in data collector training and support during data collection.
Abbreviations
- FIM
Functional Independence Measure
- LOS
Length of stay
- TBI
Traumatic brain injury
- OT
Occupational therapy
- PBE
Practice-Based Evidence
- PT
Physical therapy
- ST
Speech therapy
- PSY
Psychology
- TREC
Recreational therapy
Appendix. Short and Long Definitions of All Included Covariates and Dependent Variables
| Variable | Short definition | Long definition |
|---|---|---|
| Demographic characteristics | ||
| AgeAtAdmission | Age | Age |
| GenderMale | Male | Male |
| RaceBlack | Race black | Race black |
| RaceWhite | Race white | Race white |
| RaceWhiteHispanic | Race white Hispanic | Race white Hispanic |
| RaceAsianOtherUnknown | Race Asian/other/unknown | Race Asian/other/unknown |
| EduTowardsHighSchool | Education: some high school, no diploma | Education: some high school, no diploma |
| PayerMedicaid | Payer Medicaid | Payer Medicaid |
| Pre-injury health information | ||
| SubstanceUse | Substance use | Substance use |
| AvgBMIle18p5 | Body Mass Index (BMI) <18.5 | Body Mass Index (BMI) <18.5 |
| Injury and rehabilitation stay characteristics | ||
| ComposAnxietyYN | Anxiety | Anxiety |
| ComposDepressionYN | Depression | Depression |
| PcntAgitationOverStay | % of rehab stay agitated | % of rehab stay agitated |
| DaysInjuryToRehabAdm | Days from injury to rehab admission | Days from injury to rehab admission |
| PTAClearedPriorToAdmYN | PTA cleared prior to rehab admission | PTA cleared prior to rehab admission |
| Max2pBICSIc | Maximum brain injury component of CSI score | Maximum brain injury component of CSI score |
| Max2pRemainCSIc | Maximum non-brain injury component of CSI score | Maximum non-brain injury component of CSI score |
| Functional status characteristics | ||
| AdmFIMRASCHMotor | Admission FIM Motor Rasch-transformed | Admission FIM Motor Rasch-transformed |
| AdmFIMRASCHCog | Admission FIM Cog Rasch-transformed | Admission FIM Cog Rasch-transformed |
| Treatment factors | ||
| Total time | ||
| OTTotalMinPWk0i | OT total min/week | OT total min/week |
| PTTotalMinPWk0i | PT total min/week | PT total min/week |
| SLPTotalMinPWk0i | ST total min/week | ST total min/week |
| PSYTotalMinPWk0i | PSY total min/week | PSY total min/week |
| TRECTotalMinPWk0i | TREC total min/week | TREC total min/week |
| Level of effort | ||
| AverageOTPTSLPLOEOverStay | Average OT, PT, ST level of effort | Average OT, PT, ST level of effort |
| Occupational therapy | ||
| OTActCastingMinPWkCol | OT casting min/week | OT casting min/week |
| OTActCogImpairmentMinPWkCol | OT cognitive impairment min/week | OT cognitive activity, perceptual activity, visual activity |
| OTActCommIADLsMinPWkCol | OT community IADLs min/week | OT pre-driving activity, community transport, pre-vocational/vocational, community mobility, community reintegration, lesiure performance |
| OTActEducationMinPWkCol | OT education min/week | OT education, sexuality |
| OTActEnvironAdapMinPWkCol | OT environmental adaption min/week | OT environmental adaption |
| OTActEvaluationMinPWkCol | OT evaluation min/week | OT initial evaluation, interview |
| OTActHomeIADLsMinPWkCol | OT home IADLs min/week | OT functional mobility, home/money/meal management |
| OTActPhysImpairmentMinPWkCol | OT physical impairments min/week | OT pre-functional activity, upper extremity activity |
| OTActWCManagementMinPWkCol | OT wheelchair management min/week | OT wheelchair management |
| OTAssessTotalMinMinPWkCol | OT assessment min/week | OT assessment |
| OTBedMobTransfPerCareBasCol | OT bed/chair/WC transfer, feeding, dressing (basic) min/week | OT bed mobility, transfers- basic (bed/chair/WC transfer), personal care- basic (feeding, upper/lower-body dressing, grooming) |
| OTPersonalCareTransfCol | OT personal care/transfers (advanced) min/week | OT personal care- advanced (bathing, toileting), transfers- advanced (toilet transfer, tub/shower transfer, car transfer) |
| Physical therapy | ||
| PTAdvGaitGaitCommMobStrsCol | PT advanced locomotion min/week | PT advanced gait, gait, community mobility, stairs |
| PTEquipMngWCMobCastTranMovCol | PT equip management, transitional movements (basic) min/week | PT equipment management, wheelchair mobility, casting, transitional movements (developmental sequencing, bed mobility, sitting, transfers) |
| PTEvaluationAtPtHomeMinPWkCol | PT evaluation at patient home min/week | PT evaluation at patient home |
| PTFormalAssessMinPWkCol | PT formal assessment min/week | PT formal assessment |
| PTPreFunctActTheraExMinPWkCol | PT pre-functional activity and therapeutic exercise min/week | PT pre-functional activity and therapeutic exercise |
| PTPreGaitStandingMinPWkCol | PT pre-gait/standing min/week | PT pre-gait/standing minutes/week |
| PTPreparationTimeMinPWkCol | PT preparation time min/week | PT preparation time minutes/week |
| PTRestingMinPWkCol | PT resting min/week | PT resting minutes/week |
| Speech therapy | ||
| SLPAssessmentsMinPWkCol | ST assessment min/week | ST cognition/language/speech assessment, hearing screening, JFK coma recovery scale, O-Log/GOAT, sensory stimulation, swallowing assessment: bed, FEES, and MBS |
| SLPAttentionBothMinPWkCol | ST attention (both) min/week | ST Auditory/verbal attention, cancellation tasks, left attention/visual scanning |
| SLPAuditoryComprAdvMinPWkCol | ST auditory comprehension (advanced) min/week | ST conversational level- auditory, following multi-step commands, sentence/paragraph comprehension |
| SLPAuditoryExprCol | ST auditory comprehension/expression (basic) min/week | ST auditory comprehension- basic (following 1-step commands, word matching, yes/no questions), expression- basic (automatic speech, defining words, describing objects, gesture use, naming, phrase production, sentence production) |
| SLPAugmentDevMinPWkCol | ST augmentation devices min/week | ST high/low-tech communication devices |
| SLPCommAccGamesCol | ST community access/games min/week | ST community access (community outings, simple/complex functional tasks, develop daily schedule, return to work/school, route finding), games |
| SLPComputerAppMinPWkCol | ST computer applications min/week | ST computer applications, specialized software |
| SLPEduMinPWkCol | ST education min/week | ST education |
| SLPExpressionAdvMinPWkCol | ST expression (advanced) min/week | ST circumlocution, conversational level- expression, multi- modal communication, multi-sentence production |
| SLPLipReadMinPWkCol | ST lip reading min/week | ST lip reading |
| SLPMotorSpeechBasicMinPWkCol | ST motor speech (basic) min/week | ST diaphragmatic breathing, oral/motor exercises, repetition abilities, speech intelligibility, vocal function exercises (phonation) |
| SLPPMVSpeakValveCorkMinPWkCol | ST PMV/speaking valve/cork min/week | ST PMV/speaking valve/cork |
| SLPProbSolvMathMoneyMemoryCol | ST problem solving, math/money, memory/orientation (advanced) min/week | ST problem solving/reasoning- advanced/basic (advanced: paper/pencil; basic: environmental, sequencing, verbal reasoning, functional hypotheses), math/money- advanced/basic (advanced: budgeting, counting, functional math/word problems, grade-specific math, time span calculations; basic: basic arithmetic), memory/orientation- advanced/basic (advanced: compensation strategies- internal, delayed recall; basic: compensation strategies- external, immediate recall, O-group, spaced retrieval, verbal orientation review, work/memory) |
| SLPReadWriteAdvMinPWkCol | ST reading/writing (advanced) min/week | ST analysis, functional reading (menu, med list, etc.), functional writing (cheques, forms, etc.), multi-paragraph, oral reading, paragraphs |
| SLPReadWriteBasicMinPWkCol | ST reading/writing (basic) min/week | ST copying, phrases, sentences, single words tracing |
| SLPSwallowMinPWkCol | ST swallowing min/week | ST meal observation/analysis, oral stimulation, P.O. trials, pre- swallowing, swallow strengthening exercises, swallowing strategies |
| Psychology | ||
| PSYCogRemMinPWkCol | PSY cognitive remediation min/week | PSY cognitive remediation patient, family, and patient & family |
| PSYCrtBehavStffCnsltCrisIntCol | PSY total indirect min/week | PSY create a behavior plan, staff consultation, crisis intervention |
| PSYGenTBIEduMinPWkCol | PSY general TBI education min/week | PSY general TBI education patient, family, and patient & family |
| PSYInfoHxMinPWkCol | PSY information and history gathering min/week | PSY information and history gathering patient, family, and patient & family |
| PSYNeuroBehavTestPatTBIEduCol | PSY testing/assessment/behavioral min/week | PSY neuropsych testing, neurobehavioral assessment, patient- specific TBI education, psychotherapeutic and behavioral |
| Therapeutic recreation | ||
| TRECActivityArtsBatchMinPWk0i | TREC art min/week | TREC self expression, cooking/baking, creative writing, crafts, dance/drama |
| TRECActivityCogActBatchMinPWk0i | TREC cognitive activity min/week | TREC puzzles, reading, observation, relaxation, computer: email/games, movie/performances, card games, board/table games, wii |
| TRECActivityMusicBatchMinPWk0i | TREC music min/week | TREC musical instruments, operating cd/mp3, music games |
| TRECActivitySportBatchMinPWk0i | TREC sports min/week | TREC billiards, basketball, soccer, volleyball, swimming, disc frisbee, weight room/gym, softball/baseball/football, bowling, active tabletop games, bowling, active tabletop games, biking/hand cycling, golf/putting/croquet, bocce ball |
| TRECCommunityReintMinPWk0i | TREC community reintegration min/week | TREC community reintegration |
| Medications | ||
| PctSANALGESICSNARCOTIC | % of rehab stay on narcotic-analgesics | % of rehab stay on narcotic-analgesics |
| PctSANALGESICSNONNARCOTIC | % of rehab stay on nonnarcotic-analgesics | % of rehab stay on nonnarcotic-analgesics |
| PctSANTIANXIETYAGENTS | % of rehab stay on antianxiety agents | % of rehab stay on antianxiety agents |
| PctSANTICONVULSANT | % of rehab stay on anticonvulsants | % of rehab stay on anticonvulsants |
| PctSANTIDEPRESSANTSSSRInew | % of rehab stay on antidepressants- new SSRIs | % of rehab stay on antidepressants- new SSRIs |
| PctSANTIDEPRESSANTSother | % of rehab stay on antidepressants- other | % of rehab stay on antidepressants- other |
| PctSANTIPARKINSONIAN | % of rehab stay on antiparkinsonians | % of rehab stay on antiparkinsonians |
| PctSANTIPSYCHOTICSSecondgenat | % of rehab stay on antipsychotics- second generation | % of rehab stay on antipsychotics- second generation |
| PctSHYPNOTICS | % of rehab stay on hypnotics | % of rehab stay on hypnotics |
| PctSMISCPSYCHOTHERAPEUTIC | % of rehab stay on psychotherapeutics | % of rehab stay on psychotherapeutics |
| PctSSTIMULANTS | % of rehab stay on stimulants | % of rehab stay on stimulants |
| Site (removed) | ||
| Site 1 | Site 1 | |
| Site 2 | Site 2 | |
| Site 3 | Site 3 | |
| Site 4 | Site 4 | |
| Site 5 | Site 5 | |
| Site 6 | Site 6 | |
| Site 7 | Site 7 | |
| Site 8 | Site 8 | |
| Site 9 | Site 9 | |
| Site 10 | Site 10 | |
| Outcomes | ||
| CorrectedRehabLOS | Rehab length of stay excluding interruptions | Rehab length of stay excluding interruptions |
| DCLocationHome | Discharge destination- home | Discharge destination- home |
| DCFIMRASCHMotor | Discharge FIM Motor Rasch-transformed | Discharge FIM Motor Rasch-transformed |
| DCFIMRASCHCog | Discharge FIM Cog Rasch-transformed | Discharge FIM Cog Rasch-transformed |
| FIMRASCHMotor_9Mon | 9-Month FIM Motor Rasch-transformed | 9-Month FIM Motor Rasch-transformed |
| FIMRASCHCog_9Mon | 9-Month FIM Cog Rasch-transformed | 9-Month FIM Cog Rasch-transformed |
Footnotes
The opinions contained in this article are those of the authors and should not be construed as an official statement from the National Institutes of Health, National Center for Medical Rehabilitation Research, the National Institute on Disability and Rehabilitation Research, or the Ontario Neurotrauma Foundation.
Reprints will not be available.
- Annual meetings of the American Congress of Rehabilitation Medicine (ACRM) in October 2009 in Denver, CO; October 2011 in Atlanta, GA; October 2012 in Vancouver, BC, Canada, October 2014 in Toronto, ON, Canada.
- International Brain Injury Association (IBIA) Eighth World Congress in March 2010 in Washington, DC; March 2014 in San Francisco, CA.
- Annual Canadian Association of Physical Medicine and Rehabilitation meetings in May 2010 in Winnipeg, Manitoba.
- Federal TBI Interagency Conference in June 2011 in Washington, DC.
- Annual American Academy of Physical Medicine and Rehabilitation meetings in November 2012 in Atlanta, GA.
No commercial party having a direct financial interest in the results of the research supporting this article has or will confer a benefit upon the author(s) or upon any organization with which the author(s) is/are associated.
Publisher's Disclaimer: This is a PDF file of an unedited manuscript that has been accepted for publication. As a service to our customers we are providing this early version of the manuscript. The manuscript will undergo copyediting, typesetting, and review of the resulting proof before it is published in its final citable form. Please note that during the production process errors may be discovered which could affect the content, and all legal disclaimers that apply to the journal pertain.
References
- 1.Katz DI, Alexander MP. Traumatic brain injury: Predicting course of recovery and outcome for patients admitted to rehabilitation. Arch Neurology. 1994;51:661–70. doi: 10.1001/archneur.1994.00540190041013. [DOI] [PubMed] [Google Scholar]
- 2.Malec JF, Basford JS. Postacute brain injury rehabilitation. Arch Phys Med Rehabil. 1996;77:198–207. doi: 10.1016/s0003-9993(96)90168-9. [DOI] [PubMed] [Google Scholar]
- 3.Novack TA, Bush BA, Meythaler JM, Canupp K. Outcome after traumatic brain injury: Pathway analysis contributions from premorbid, injury severity and recovery variables. Arch Phys Med Rehabil. 2001;82:300–5. doi: 10.1053/apmr.2001.18222. [DOI] [PubMed] [Google Scholar]
- 4.Corrigan JD, Bogner JA, Mysiw WJ, Clinchot D, Fugate L. Systemic bias in outcome studies of persons with traumatic brain injury. Arch Phys Med Rehabil. 1997;78:132–7. doi: 10.1016/s0003-9993(97)90253-7. [DOI] [PubMed] [Google Scholar]
- 5.Millis SR, Rosenthal M, Novack TA, Sherer M, Nick TG, Kreutzer JS, High WM, Jr, Ricker JH. Long-term neuropsychological outcomes after traumatic brain injury. J Head Trauma Rehabil. 2001;16:343–55. doi: 10.1097/00001199-200108000-00005. [DOI] [PubMed] [Google Scholar]
- 6.Whitlock JA, Hamilton BB. Functional outcome after rehabilitation for severe traumatic brain injury. Arch Phys Med Rehabil. 1995;76:1103–12. doi: 10.1016/s0003-9993(95)80117-0. [DOI] [PubMed] [Google Scholar]
- 7.Cowen TD, Meythaler JM, DeVivo MJ, Ivie CS, III, Lebow J, Novack TA. Influence of early variables in traumatic brain injury on functional independence measure scores and rehabilitation length of stay and charges. Arch Phys Med Rehabil. 1995;76:797–803. doi: 10.1016/s0003-9993(95)80542-7. [DOI] [PubMed] [Google Scholar]
- 8.Carney N, Chesnut R, Maynard H, Mann NC, Patterson P, Helfand M. Effect of cognitive rehabilitation on outcomes for persons with traumatic brain injury: A systematic review. J Head Trauma Rehabil. 1999;14:277–307. doi: 10.1097/00001199-199906000-00008. [DOI] [PubMed] [Google Scholar]
- 9.Salazar AM, Warden DL, Schwab K, Spector J, Braverman S, Walter J, Cole R, Rosner MM, Martin EM, Ecklund J, Ellenbogen RG. Cognitive rehabilitation for traumatic brain injury: A randomized trial. JAMA. 2000;283:3075–81. doi: 10.1001/jama.283.23.3075. [DOI] [PubMed] [Google Scholar]
- 10.Cicerone KD, Dahlberg C, Malec JF, Langenbahn HDM, Felicetti T, Kneipp ST, Ellmo W, Kalmar K, Giacino JT, Harley JP, Laatsch L, Morse PA, Catanese J. Evidence-based cognitive rehabilitation: Updated review of the literature from 1998 through 2002. Arch Phys Med Rehabil. 2005;86:1681–92. doi: 10.1016/j.apmr.2005.03.024. [DOI] [PubMed] [Google Scholar]
- 11.Cicerone KD, Langenbahn DM, Braden C, Malec JF, Kalmar K, Fraas M, Felicetti T, Laatsch L, Harley JP, Bergquist T, Azulay J, Cantor J, Ashman T. Evidence-based cognitive rehabilitation: Updated review of the literature from 2003 through 2008. Arch Phys Med Rehabil. 2011;92:519–30. doi: 10.1016/j.apmr.2010.11.015. [DOI] [PubMed] [Google Scholar]
- 12.Heinemann A, Hamilton B, Linacre J, et al. Functional status and therapeutic intensity during inpatient rehabilitation. Am J Phys Med Rehabil. 1995;74(4):315–26. doi: 10.1097/00002060-199507000-00011. [DOI] [PubMed] [Google Scholar]
- 13.Bode R, Heinemann A, Semik P, Mallison T. Patterns of therapy activities across length of stay and impairment levels: Peering inside the “black box” of inpatient stroke rehabilitation. Arch Phys Med Rehabil. 2004;85:1901–8. doi: 10.1016/j.apmr.2004.02.023. [DOI] [PubMed] [Google Scholar]
- 14.Koehler R, Wilhelm E, Shoulson I, editors. Committee on Cognitive Rehabilitation Therapy for Traumatic Brain Injury; Institute of Medicine IOM (Institute of Medicine) Cognitive Rehabilitation Therapy for Traumatic Brain Injury. 2011. [Google Scholar]
- 15.Horn SD, Corrigan JD, Bogner J, Hammond FM, Seel RT, Smout RJ, Barrett RS, Dijkers MP, Whiteneck G. Traumatic brain injury practice-based evidence study: Design and patients, centers, treatments, and outcomes. Arch Phys Med Rehabil. 2015 Apr; doi: 10.1016/j.apmr.2014.09.042. supplement. [DOI] [PMC free article] [PubMed] [Google Scholar]
- 16.Beaulieu C, Dijkers MP, Barrett RS, Horn SD, Guiffrida C, Timpson M, Carroll D, Smout RJ, Hammond FM. Occupational, Physical, and speech therapy treatment activities during inpatient rehabilitation for traumatic brain injury. Arch Phys Med Rehabil. 2015 Apr; doi: 10.1016/j.apmr.2014.10.028. supplement. [DOI] [PMC free article] [PubMed] [Google Scholar]
- 17.Seel RT, Beaulieu C, Ryser DK, Hammond FM, Cullen N, Garmoe W, Horn SD, Smout RJ, Barrett RS, Sommerfeld T. Traumatic Brain Injury Practice-Based Evidence Rehabilitation Facility Characteristics. Arch Phys Med Rehabil. 2015 Apr; doi: 10.1016/j.apmr.2015.02.034. supplement. [DOI] [PubMed] [Google Scholar]
- 18.Hammond FM, Barrett RS, Shea T, Seel RT, McAllister T, Kaelin D, Ryser DK, Corrigan JD, Cullen N, Horn SD. Psychoactive medications use during inpatient rehabilitation for traumatic brain injury. Arch Phys Med Rehabil. 2015 Apr; doi: 10.1016/j.apmr.2015.01.025. supplement. [DOI] [PMC free article] [PubMed] [Google Scholar]
- 19.Cifu D, Kreutzer J, Kolakowsky-Hayner S, Marwitz J, Englander J. The relationship between therapy intensity and rehabilitative outcomes after traumatic brain injury: A multicenter analysis. Arch Phys Med Rehabil. 2003;84:1441–8. doi: 10.1016/s0003-9993(03)00272-7. [DOI] [PubMed] [Google Scholar]
- 20.Horn SD, DeJong G, Deutscher D. Practice-based evidence research in rehabilitation: An alternative to randomized clinical trials and traditional observational studies. Arch Phys Med Rehabil. 2012;93 (8 Supp 2):S127–37. doi: 10.1016/j.apmr.2011.10.031. [DOI] [PubMed] [Google Scholar]
- 21.Heinemann AW, Linacre JM, Wright BD, Hamilton BB, Granger C. Relationships between impairment and physical disability as measured by the functional independence measure. Arch Phys Med Rehabil. 1993;74:566–73. doi: 10.1016/0003-9993(93)90153-2. [DOI] [PubMed] [Google Scholar]
- 22.Seel RT, Corrigan JD, Dijkers MP, Barrett RS, Bogner J, Smout RJ, Garmoe W, Horn SD. Patient effort in traumatic brain injury inpatient rehabilitation: Course and associations with age, brain injury severity, and time post-injury. Arch Phys Med Rehabil. doi: 10.1016/j.apmr.2014.10.027. submitted. [DOI] [PMC free article] [PubMed] [Google Scholar]
- 23.Corrigan JD, Horn SD, Barrett RS, Smout RJ, Bogner J, Hammond FM, Brandstater M, Garmoe W, Majercik S. Effects of patient pre-injury and injury characteristics on acute rehabilitation outcomes for traumatic brain injury. Arch Phys Med Rehabil. doi: 10.1016/j.apmr.2015.03.026. submitted. [DOI] [PMC free article] [PubMed] [Google Scholar]
- 24.Horn SD, DeJong G, Smout R, Gassaway J, James R, Conroy B. Stroke rehabilitation patients, practice, and outcomes: Is earlier and more aggressive therapy better? Arch Phys Med Rehabil. 2005;86(12 Supplement 2):S101–14. doi: 10.1016/j.apmr.2005.09.016. [DOI] [PubMed] [Google Scholar]
- 25.Dumas H, Haley S, Carey T, Ni PS. The relationship between functional mobility and the intensity of physical therapy intervention in children with traumatic brain injury. Pediatr Phys Ther. 2004 Fall;16(3):157–64. doi: 10.1097/01.PEP.0000136004.69289.01. [DOI] [PubMed] [Google Scholar]
- 26.Rappaport M, Herrero-Backe C, Rappaport ML, Winterfield KM. Head injury outcome up to ten years later. Arch Phys Med Rehabil. 1989;70(13):885–92. [PubMed] [Google Scholar]
- 27.Kunik CL, Flowers L, Kazanjian T. Time to rehabilitation admission and associated outcomes for patients with traumatic brain injury. Arch Phys Med Rehabil. 2006;87(12):1590–6. doi: 10.1016/j.apmr.2006.09.001. [DOI] [PubMed] [Google Scholar]
- 28.Blicher JU, Nielsen JF. Does long-term outcome after intensive inpatient rehabilitation of acquired brain injury depend on etiology? NeuroRehabil. 2008;23(2):175–83. [PubMed] [Google Scholar]
- 29.Whyte J, Gosseries O, Chervoneva I, DiPasquale MC, Giacino J, Kalmar K, Katz DI, Novak P, Long D, Childs N, Mercer W, Maurer P, Eifert B. Predictors of short-term outcome in brain-injured patients with disorders of consciousness. Prog Brain Res. 2009;177:63–72. doi: 10.1016/S0079-6123(09)17706-3. [DOI] [PubMed] [Google Scholar]
- 30.León-Carrión J1, Machuca-Murga F, Solís-Marcos I, León-Domínguez U, del Domínguez-Morales MR. The sooner patients begin neurorehabilitation, the better their functional outcome. Brain Inj. 2013;27(10):1119–23. doi: 10.3109/02699052.2013.804204. [DOI] [PubMed] [Google Scholar]
- 31.Rice SA, Blackman JA, Braun S, Linn RT, Granger CV, Wagner DP. Rehabilitation of children with traumatic brain injury: Descriptive analysis of a nationwide sample using the WeeFIM. Arch Phys Med Rehabil. 2005;86(4):834–6. doi: 10.1016/j.apmr.2004.11.006. [DOI] [PubMed] [Google Scholar]
- 32.Tepas JJ, 3rd1, Leaphart CL, Pieper P, Beaulieu CL, Spierre LR, Tuten JD, Celso BG. The effect of delay in rehabilitation on outcome of severe traumatic brain injury. J Pediatr Surg. 2009;44(2):368–72. doi: 10.1016/j.jpedsurg.2008.10.089. [DOI] [PubMed] [Google Scholar]
- 33.Wagner AK, Fabio T, Zafonte RD, Goldberg G, Marion DW, Peitzman AB. Physical medicine and rehabilitation consultation: Relationships with acute functional outcome, length of stay, and discharge planning after traumatic brain injury. Am J Phys Med Rehabil. 2003;82(7):526–36. doi: 10.1097/01.PHM.0000073825.09942.8F. [DOI] [PubMed] [Google Scholar]
- 34.Turner-Stokes L, Disler PB, Nair A, Wade DT. Multi-disciplinary rehabilitation for acquired brain injury in adults of working age. Cochrane Database Syst Rev. 2005;3(3):CD004170. doi: 10.1002/14651858.CD004170.pub2. [DOI] [PubMed] [Google Scholar]
- 35.Breceda EY, Dromerick AW. Motor rehabilitation in stroke and traumatic brain injury: Stimulating and intense. Curr Opin Neurol. 2013;26(6):595–601. doi: 10.1097/WCO.0000000000000024. [DOI] [PubMed] [Google Scholar]
- 36.Baker E. Optimal intervention intensity in speech-language pathology: Discoveries, challenges, and unchartered territories. Int J Speech Lang Pathol. 2012;14(5):478–485. doi: 10.3109/17549507.2012.717967. [DOI] [PubMed] [Google Scholar]
- 37.Togher L. Challenges inherent in optimizing speech-language pathology outcomes: It’s not just about counting the hours. Int J Speech Lang Pathol. 2012;14(5):438–442. doi: 10.3109/17549507.2012.689334. [DOI] [PubMed] [Google Scholar]
- 38.Cifu DX, Kreutzer JS, Kolakowsky-Hayner SA, Marwitz JH, Englander J. The relationship between therapy intensity and rehabilitative outcomes after traumatic brain injury: A multicenter analysis. Arch Phys Med Rehabil. 2003;84(10):1441–1448. doi: 10.1016/s0003-9993(03)00272-7. [DOI] [PubMed] [Google Scholar]
- 39.Lequerica AH, Rapport LJ, Loeher K, Axelrod BN, Vangel SJ, Jr, Hanks RA. Agitation in acquired brain injury: Impact on acute rehabilitation therapies. J Head Trauma Rehabil. 2007;22(3):177–183. doi: 10.1097/01.HTR.0000271118.96780.bc. [DOI] [PubMed] [Google Scholar]
- 40.Lequerica AH, Kortte K. Therapeutic engagement: A proposed model of engagement in medical rehabilitation. Am J Phys Med Rehabil. 2010;89(5):415–422. doi: 10.1097/PHM.0b013e3181d8ceb2. [DOI] [PubMed] [Google Scholar]
- 41.Kortte KB, Falk LD, Castillo RC, Johnson-Greene D, Wegener ST. The hopkins rehabilitation engagement rating scale: Development and psychometric properties. Arch Phys Med Rehabil. 2007;88(7):877–884. doi: 10.1016/j.apmr.2007.03.030. [DOI] [PubMed] [Google Scholar]
- 42.Madeira G, Montmirail C, Decat M, Gersdorff M. TRT: Results after one year treatment. Laryngol Otol Rhinol. 2007;128(3):145–148. [PubMed] [Google Scholar]
- 43.Feeney DM, Gonzalez A, Law WA. Amphetamine, haloperidol, and experience interact to affect rate of recovery after motor cortex injury. Science. 1982;(217):855–857. doi: 10.1126/science.7100929. [DOI] [PubMed] [Google Scholar]
- 44.Hoffman AN, Cheng JP, Zafonte RD, Kline AE. Administration of haloperidol and risperdone after neurobehavioral testing hinders the recovery of traumatic brain injury-induced deficits. Life Sciences. 2008;83:602–607. doi: 10.1016/j.lfs.2008.08.007. [DOI] [PMC free article] [PubMed] [Google Scholar]
- 45.Massagli TL. Neurobehavioral effects of phenytoin, carbamazepine, and valproic acid: implications for use in traumatic brain injury. Arch Phys Med Rehabil. 1991;72:219–226. [PubMed] [Google Scholar]


