

Abstract
We conducted a review to study antibiotic and injections use at primary care centers (PHCs) within the World Health Organization African region. This was part of a larger study on prescribing indicators at PHCs within the region. We analyzed antibiotic and injection use reported in studies published between 1993 and June 2013, which were identified through searches conducted in PubMed, Scopus, Web of science, Africa-Wide NiPAD, Africa Journals Online, Google Scholar, and International Network for Rational Use of Drugs bibliography databases. Sub-group analysis was carried out for private and public centers. Data were retrieved from 18 studies in 6 countries involving 21,283 patient encounters across 338 PHCs. The percentage of patient encounters with antibiotics prescribed was 51.5% (IQR 41.1–63.3%). The percentage of patient encounters which resulted in the prescription of an injection was 36.8% (IQR 20.7–57.6%). Injection use rate at private facilities was 38% (IQR 19.1–42.7) while that of the public was 32.3% (IQR 20.6–57.6). Rate of antibiotic prescribing at public centers was 49.7% (IQR 51.1–75.7) and that of private facilities 57.6 (IQR 39.0–69.5). The percentage use of injections and antibiotics is high in Africa. The excessive use of antibiotics and injections are particularly more problematic in private than public facilities. Further research is needed to understand fully the underlying factors for the observed patterns and ways of improving medicines use.
KEY WORDS: Antibiotic, drug use patterns, injection, pharmacoepidemiology, prescribing indicators
Medicines remain a vital component of health care delivery because they can cure diseases, relieve symptoms, and alleviate suffering thereby reinforcing the credibility of the health care system.[1,2] However, the World Health Organization (WHO), has indicated that inappropriate use of medicines is a worldwide challenge as over 50% of all medicines are inappropriately prescribed, dispensed or sold.[3] Such practices are deemed to be most prevalent in healthcare settings of the developing world.[4] Yet, for many of these countries, healthcare budgets are already constrained with medicines accounting for around 25–70% of healthcare expenditure.[5] Against this background, improving medicines use practices remains a top priority in such settings so as to afford the optimal utilization of scarce resources and to enhance the quality of healthcare delivered. Nevertheless, improving medicines use requires evidence on existing utilization patterns. This is necessary so that appropriate measures can be instituted to tackle medicines use problem areas.[6]
To facilitate such evidence generation and compilation, the WHO in collaboration with the International Network for Rational Use of Drugs (INRUD) have outlined a number of “core drug use indicators” which measure performance in three related areas of prescribing practices, patient care and facility specific factors.[7] Although, these core indicators do not measure all aspects of drug use, they provide a simple tool for quick and reliable assessment of pharmaceutical use and were field tested in twelve developing countries prior to the introduction.[8,9] The drug use indicators have come to be regarded as “objective measures that can describe the drug use situation in a country, region or individual health facility.”[7] Moreover, they are standardized and do not require country adaptation.[8] Although, the core drug use indicators are central to investigating medicines use at primary healthcare center (PHCs), they are less beneficial for inpatient settings and specialist outpatient facilities as medicines use patterns at these facilities may be more complex.[7]
The five core prescribing indicators which are “average number of medicines per encounter,” “percentage of medicines prescribed by generic name,” “percentage of encounters with antibiotic prescribed,” “percentage of encounters with injection prescribed” and “percentage of medicines prescribed from an essential medicines list” are meant to elucidate particular prescribing characteristics related to poly-pharmacy, antibiotic use, injection use, generic prescribing, and guideline adherence (EML).[7,8] Although, not empirically determined, the WHO has proposed optimal values for each of the prescribing indicators.[9,10,11] For a percentage of patient encounters resulting in the use of antibiotic, this has been set at <30% while the rate of injection prescribing has been set at <20%.[10] Furthermore, using survey-derived morbidity mix incorporating patient records in Nigeria, Isah et al.,[12] estimated that antibiotic and injection use rate at PHCs should be ideally within the ranges of 20–26.8% and 13.4-24.1%, respectively. For the purpose of applicability, we adopted the WHO proposed values.
The WHO also published the guideline, “How to investigate drug use at health facilities: Selected Drug use indicators” to aid in the collection and presentation of information on medicine use indicators at PHCs.[7] Moreover, over the last two decades, the WHO has also been actively reviewing information on medicines use indicators from different countries and publishing in its World Medicines Situation Reports.[3,13,14] Furthermore, in 2009, the WHO published its most extensive review on medicines use at PHCs in its fact book dubbed “Medicines use in Primary Care in Developing and Transitional Countries.”[15] While the WHO fact book provides useful information on patterns of prescribing (antibiotics and injection use) at PHCs in the African region, the information or dataset used does not extend beyond 2006.[15] No other comprehensive review on prescribing indicators for the African region was identified perhaps highlighting the lack of extensive evidence compilation on medicine use indicators for the region. To overcome this perceived gap in evidence compilation, we conducted a review towards contributing to evidence generation, compilation, and understanding of medicines use patterns at PHCs in Africa. In this paper, our focus was on antibiotic and injection use.
Methods
This study was part of a larger review on prescribing indicators at PHCs within the WHO African region. To identify relevant studies, we conducted a structured review of the literature followed by an analysis of the WHO/INRUD prescribing indicators. The review was conducted in accordance with the preferred reporting items for systematic reviews and meta-analyses statement.[16]
Search strategy
A comprehensive search was conducted in PubMed, Scopus, Web of science, Africa-Wide Nipad, Africa Journals Online, Google scholar, and INRUD Bibliography databases between 20/06/2013 and 30/06/2013. The main key words used were “primary health care/primary health services/community health centers/community-based health care/health facilities/primary health care settings” AND “prescribing indicators/prescribing patterns/drug use indicators/drug utilization patterns/prescribing evaluation/prescribing statistics/rational prescribing/rational use of medicines/health facility indicators” AND “Africa/Sub-Saharan Africa/WHO African Region”. The main limits used were “humans” and “English.”
Inclusion and exclusion of studies
We included only observational studies published between January 1, 1993 and June 30, 2013, which reported at least one WHO/INRUD core prescribing indicator. The year 1993 was considered as a reasonable starting point as it coincided with the year of publication of the guideline “How to investigate drug use in health Facilities: Selected drug use indicators” recommended by the WHO for the conduct of indicator-based drug use studies at PHCs.[7] Only studies that adopted the WHO/INRUD methods and followed the guideline were included in the review. Moreover, a study must specify the total number of patient encounters involved for it to be accepted into the review. Furthermore, to eliminate potential biases, the review included only studies in which the sample of patient encounters were attained through a random sampling technique.[11,17] For studies with duplicate publications, the version published first or one with complete dataset was selected. Moreover, we excluded studies that reported prescribing indicators purposely as part of testing the impact of an intervention (with pre and post values). Furthermore, studies conducted at hospital (secondary facility) outpatient centers were excluded, even though; such settings may be regarded by some researchers as constituting primary care.[18]
Quality assessment of studies/papers
The methodological quality of each study included in the review was assessed based on the WHO/INRUD methods outlined in the guidelines “How to investigate drug use at health facilities: Selected drug use indicators”.[7] As adopted in other reviews,[11] we synthesized from the WHO guidelines, Eleven (11) key criteria for the quality assessment of paper and study methodology (criteria available as supplementary information).
Data extraction
Each study was issued with a unique number for identification purposes. We collected the following descriptive information; author details, year of publication, country of study, data collection method and duration, type (s) of facility involved, mean age of patients, number of facilities involved, setting (e.g., rural), number of patient encounters used in the analysis. The percentage of encounters which resulted in the use of an antibiotic or injection were extracted and analyzed.
Statistical analysis
We determined the median as well as the 25th and 75th percentiles across the 19 studies for the number of medicines prescribed per patient. We did not determine the mean values across studies as this would be influenced by outliers.[19] For each prescribing indicator, study results were not weighted by sample size to avoid the undue influence of larger sample-sized studies.[15] In this case, the approach we adopted was to treat each study as a single data point with equal weight, without regard to sample size and variance. Statistical estimates of the difference between the results of prescribing indicators obtained for private and public PHCs was not conducted since variance would have been greatly underestimated in such circumstances. All computations were done electronically using Microsoft Excel 2010® and results of prescribing indicators were compared to the WHO's proposed optimal values.[9,10]
Results
Figure 1 outlines the schematic flow of the studies identification and inclusion process. A total of 3,609 articles were identified by the literature search. After the exclusion of duplicates and irrelevant studies based on titles and abstracts, we included 18 studies in our analysis on antibiotic and injection use. The 18 studies collectively reported antibiotic and injection use based on an analysis of 21,283 patient encounters at 338 PHCs. The PHCs included 193 (57.1%) public and 145 (42.9%) private (mission-based and profit-run) centers. It was difficult to determine individually, the number of “mission-based” and “business/profit-run” facilities as in a number of studies, the use of the term private was accompanied by limited description of whether the facilities involved were the former or the latter or a mix of the two.
Figure 1.
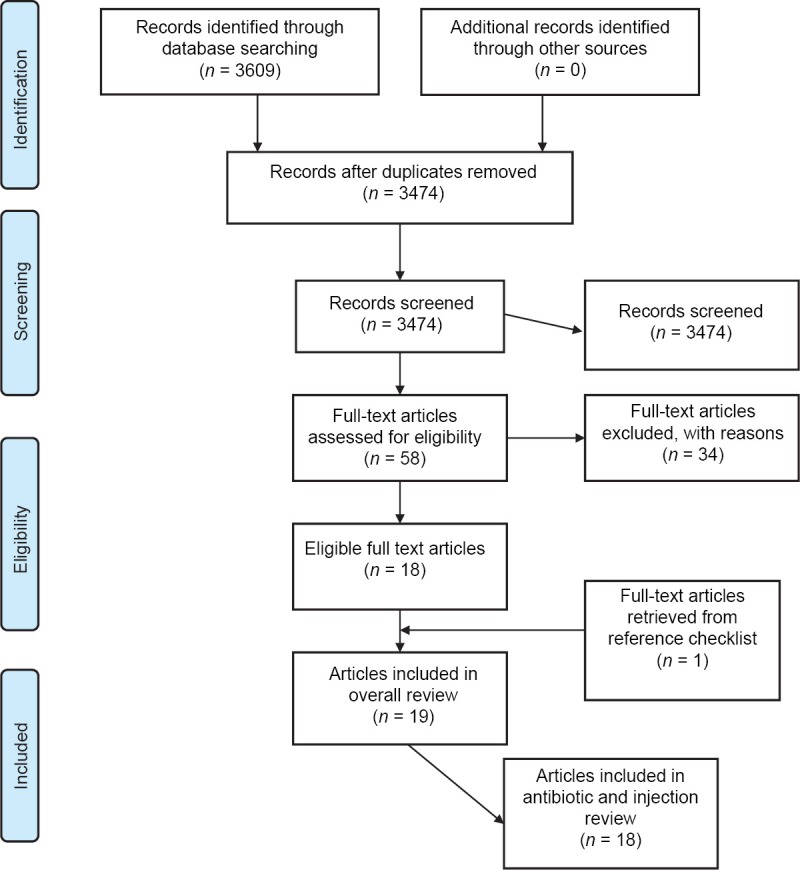
Preferred Reporting Items for systematic reviews and meta-analyses flow diagram of review process
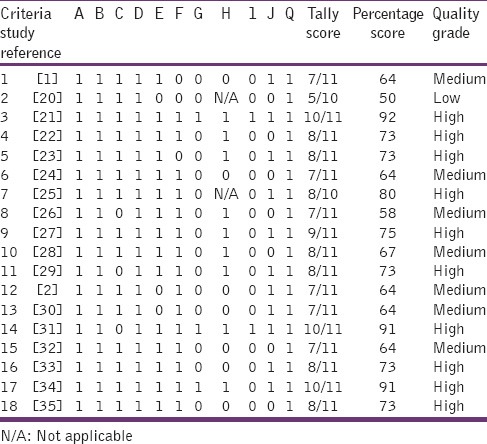
The publication years of the studies were fairly distributed with 44% of studies published in the years 1993–2003 and the remaining 56% in the period 2004–2013. The studies were performed in 6 African countries; Ghana [1], Nigeria [6], Tanzania [5], Zimbabwe [2], Gambia [1], and Ethiopia [3]. The studies collected data either prospectively (i.e., using current patients as they present for consultation) or retrospectively (i.e., using past medical records). In 13 studies, data on prescribing were collected retrospectively, in 3 studies this was done prospectively while 2 studies used a mix approach of collecting information both prospectively and retrospectively. The total patient-provider encounter data from the 18 studies collected retrospectively was 18,800 (86.1%) whereas that attained by prospective approach was 3,023 (16.1%). In majority of the studies (78%, 14 out of 18) the number of encounters used in the analysis was equal to or exceeded 600 which is the minimum recommended in the WHO guideline.[7] The period over which patient-provider encounter information was collected was between the ranges of 1-day-14month. Information about prescribing was collected generally from case notes (full medical records) or prescription sheets (containing only medicines). The descriptive characteristics of the studies have been summarized in Table 1. Overall, using the quality assessment criteria outlined, 56% of studies were graded as of high quality whereas 39% and 5% were graded as of medium and low quality respectively [Table 2: Supplementary information].
Table 1.
Descriptive characteristics of studies
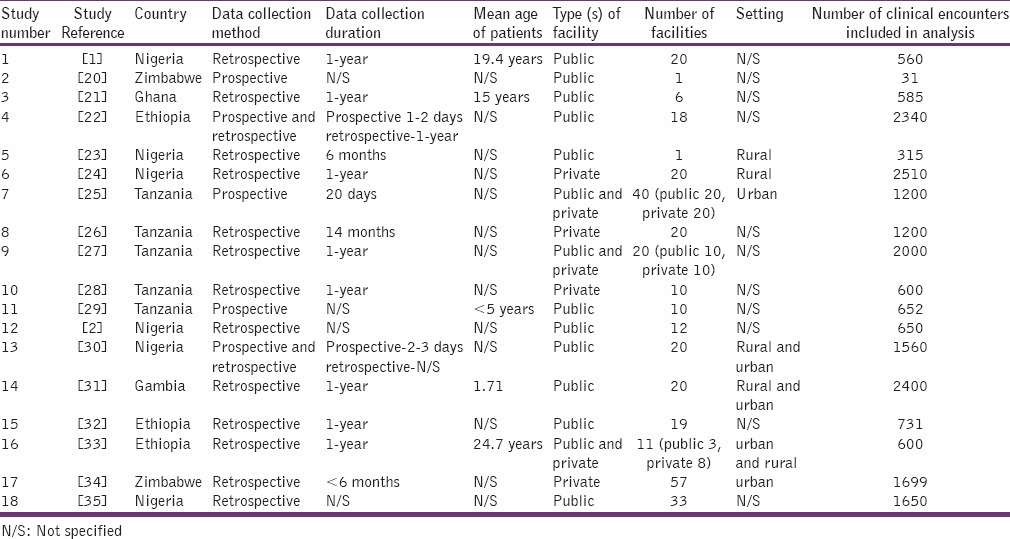
Table 2.
Critical appraisal of studies
Injection prescribing rate
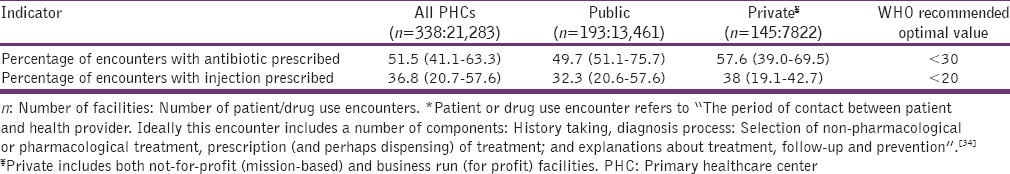
Of the 18 studies reviewed, injection use reported for public and private centers combined varied from 1.15% to 82.9% [Figure 2]. About 82% of the studies also reported injection rate higher than the WHO proposed optimal value of < 20%.[10] Moreover, 39% (7 out of 18) and 27% (5 out of 18) of studies reported values that exceeded the WHO's utmost value by at least 100% and 200% respectively. The median injection prescribing rate for all facilities combined was 36.8% (IQR 20.7–57.7%) [Table 3]. For public facilities, the median injection use rate was 32.3% (IQR: 20.6–57.6%) while that of private centers was 38.0% (IQR 19.1–42.7%).
Figure 2.
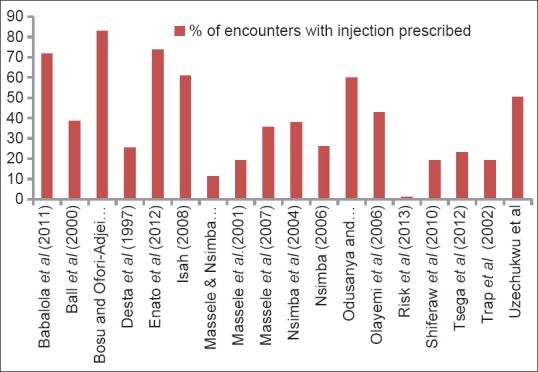
Summary of Injection prescribing rates
Table 3.
Summary table
Antibiotic prescribing rate
In 17 of the studies, the antibiotic prescribing rate [Figure 3] reported was above 30%, the upmost value recommended by the WHO.[10] Moreover, for all facilities combined, 67% (12 out of 18) and 44% (8 out of 18) of studies reported antibiotic prescription rate exceeding the WHO recommended upmost value by at least 50% and 100% respectively. The antibiotic prescribing rate for all facilities combined was determined as 51.5% (IQR 41.1–63.3%) [Table 3]. The median antibiotic prescribing rate for public facilities was 49.7% (IQR 51.1–75.7%) while that of private PHCs was 57.6% (IQR; 39.0–69.5%).
Figure 3.

Summary of antibiotic prescribing rate
Discussion
Prescribing indicators are useful for identifying drug use problem areas.[6,7] The percentage of encounters with antibiotics prescribed in this review was 51.45% which exceeds the optimal value of <30% recommended by the WHO.[10] The antibiotic use rate in this study is higher than that reported by the WHO (47%).[15] However, it is lower when compared to estimates provided for the Eastern Mediterranean region (53.2%) but higher than that of the Americas (39.3%) and European (33.5%) regions15. A higher value of antibiotic use was reported for the private facilities (57.6%) than public facilities (46.95%) which do suppose that antibiotic use may be more of a problem in the private than public sector. This observance of higher antibiotic use in the private sector is consistent with patterns reported in many WHO reports.[3,15] Indiscriminate use of antibiotics can contribute to the development of drug resistance. For instance, in a study by Bosu and Ofori-Adjei[21] on antibiotic use at health facilities in Ghana. Their findings indicated that, vaginal and endocervical isolates were always resistant to the commonly used antibiotics such as ampicillin and tetracycline but almost always sensitive to antibiotics like cefuroxime and gentamicin which were less frequently prescribed at the facilities.[21] The development of antibiotic drug resistance can cause significant morbidity and mortality as infectious disease rates remain high in the African region. Moreover, high use of antibiotics is costly, and the development of resistance can further aggravate treatment cost by requiring the use of more powerful and yet expensive antibiotics.
The overall injection use rate determined in this study was 36.8% which exceeds the optimal value (<20%) recommended by the WHO.[10] The WHO 2009 fact book reported an injection use rate of 27.5% which is lower than that attained in this study.[15] The result also indicates a higher use of injectable medications when compared to results reported for Eastern Mediterranean (20.1%), European (17.2%) and West Pacific (23.2%) regions. In comparison, the study found the higher use of injections at private facilities (38%) than at public centers (32.3%). This observance of higher injection use in private facilities is consistent with global trends reported by the WHO.[15] Indiscriminate use of injections can increase the risk of spreading blood-borne diseases such as hepatitis B and even HIV/AIDS especially in a region where infections rates remain high. Moreover, overuse of injections sets up a cycle of repeated visits putting pressure on healthcare staff and driving costs.
Conclusion
Overall, injection and antibiotic use at PHCs in the African region deviate significantly from the WHO proposed optimal values. This has implications on health resource utilization and quality of health delivery. Drug use is often influenced by a myriad of factors related to patients, prescribers, disease burden, and the health care system. Further research is therefore needed to tease out the underlying factors driving this trend of antibiotic and injection use in the African region.
Financial support and sponsorship
Nil.
Conflicts of interest
There are no conflicts of interest.
References
- 1.Babalola C, Awoleye S, Akinyemi J, Kotila O. Evaluation of prescription pattern in Osun State (Southwest) Nigeria. J Public Health Epidemiol. 2011;3:94–8. [Google Scholar]
- 2.Odusanya O, Oyediran M. Rational drug use at primary health care centres in Lagos, Nigeria. Niger Q J Hosp Med. 2000;10:4–7. [Google Scholar]
- 3.WHO. The World Medicines Situation: World Health Organisation. 2004. [Last accessed on 2013 Jul 20]. Available from: http://www.apps.who.int/medicinedocs/en/d/Js6160e .
- 4.Liang R. Rational Drug Use; an unsolved problem. Trop Doct. 1990;20:101–3. doi: 10.1177/004947559002000303. [DOI] [PubMed] [Google Scholar]
- 5.WHO. Measuring Medicine Prices, Availability, Affordability and Price Components. 2008. [Last accessed 2013 Jul 21]. Available from: http://www.who.int/medicines/areas/access/OMS_Medicine_prices.pdf .
- 6.Gupta N, Sharma D, Garg S, Barghava V. Auditing of prescriptions to study utilization of antimicrobials in a tertiary hospital. Indian J Pharmacol. 1997;29:411–5. [Google Scholar]
- 7.WHO. How to Investigate Drug Use in Health Facilities: Selected Drug Use Indicators – EDM Research Series No. 007 1993. [Last accessed on 2013 Jun 15]. Available from: http://www.apps.who.int/medicinedocs/en/d/Js2289e .
- 8.Hogerzeil HV, Bimo, Ross-Degnan D, Laing RO, Ofori-Adjei D, Santoso B, et al. Field tests for rational drug use in twelve developing countries. Lancet. 1993;342:1408–10. doi: 10.1016/0140-6736(93)92760-q. [DOI] [PubMed] [Google Scholar]
- 9.WHO. Using indicators to measure country pharmaceutical situations 2006 [20th July 2013] Available from: http://www.who.int/medicines/publications/WHOTCM2006.2A.pdf .
- 10.WHO. Guide to Drug Financing Mechanisms. 1998. [Last accessed on 2013 Jun 15]. Available from: http://www.apps.who.int/medicinedocs/en/d/Jh2928e/7.1.2.html .
- 11.Yin X, Song F, Gong Y, Tu X, Wang Y, Cao S, et al. A systematic review of antibiotic utilization in China. J Antimicrob Chemother. 2013;68:2445–52. doi: 10.1093/jac/dkt223. [DOI] [PubMed] [Google Scholar]
- 12.Isah A, Ross-Degnan D, Quick J, Laing R, Mabadeje A. The Development of Standard Indicator Values for the WHO Drug Use Prescribing Indicators. 2001. [Last accessed on 2013 Dec 23]. Available from: http://www.archives.who.int/icium/icium1997/posters/1a2_txt.html .
- 13.WHO. The World Medicines Situation Report. 2011. [Last accessed on 2013 Jul 15]. Available from: http://www.who.int/medicines/areas/policy/world_medicines_situation/en .
- 14.WHO. The World Drug Situation: World Health Organisation. 1988. [Last accessed on 2013 Jul 15]. Available from: http://www.apps.who.int/medicinedocs/documents/s16222e/s16222e.pdf .
- 15.WHO. Medicines Use in Primary Care in Developing and Transitional Countries. 2009. [Last accessed on 2013 Jul 15]. Available from: http://www.who.int/medicines/publications/primary_care_8April09.pdf .
- 16.Moher D, Liberati A, Tetzlaff J, Altman DG. Preferred reporting items for systematic reviews and meta-analyses: The PRISMA statement. Ann Intern Med. 2009;151:264–9. doi: 10.7326/0003-4819-151-4-200908180-00135. w64. [DOI] [PubMed] [Google Scholar]
- 17.Mills S, Um S, McWilliams S, Hodgson R. The importance of random sampling when conducting visiot surveys. J Park Recreat Admi. 1987:5. [Google Scholar]
- 18.Erah P, Olumide G, Okhamafe A. Prescribing practices in two health care facilities in Warri, Southern Nigeria: A comparative study. Trop J Pharm Res. 2003;2:175–82. [Google Scholar]
- 19.Cousineau D, Chartier S. Outliers detection and treatment: A review. Int J Psychol Res. 2010;3:58–67. [Google Scholar]
- 20.Ball DE, Maidza J, Rusike T, Sharief K, Taderera T, Tangawarima T. Drug use indicators at St Mary's Clinic. Cent Afr J Med. 2000;46:54–5. [PubMed] [Google Scholar]
- 21.Bosu WK, Ofori-Adjei D. An audit of prescribing practices in health care facilities of the Wassa West district of Ghana. West Afr J Med. 2000;19:298–303. [PubMed] [Google Scholar]
- 22.Desta Z, Abula T, Beyene L, Fantahun M, Yohannes AG, Ayalew S. Assessment of rational drug use and prescribing in primary health care facilities in north west Ethiopia. East Afr Med J. 1997;74:758–63. [PubMed] [Google Scholar]
- 23.Enato E, Sounyo A, Madadi P. Assessment of disease profiles and drug prescribing patterns of health care facilities in Edo state, Nigeria. J Public Health Afr. 2012;3:101–6. [Google Scholar]
- 24.Isah H. Prescription pattern among care providers in Catholic-church-owned primary health care facilities in the Northern Ecclesiastical provinces of Abuja, Jos and Kaduna, Nigeria: Preliminary findings. J Pharm Allied Sci. 2008;5:564–71. [Google Scholar]
- 25.Massele AY, Nsimba SE. Comparison of drug utilisation in public and private primary health care clinics in Tanzania. East Afr Med J. 1997;74:420–2. [PubMed] [Google Scholar]
- 26.Massele AY, Nsimba SE, Rimoy G. Prescribing habits in church-owned primary health care facilities in Dar Es Salaam and other Tanzanian coast regions. East Afr Med J. 2001;78:510–4. doi: 10.4314/eamj.v78i10.8958. [DOI] [PubMed] [Google Scholar]
- 27.Massele A, Nsimba S, Fulgence J. A survey of Prescribing practices of Health care workers in Kibaha District in Tanzania. Tanzanian Med J. 2007;22:31–3. [Google Scholar]
- 28.Nsimba SE, Massele AY, Makonomalonja J. Assessing prescribing practice in church-owned primary healthcare (PHC) institutions in Tanzania: A pilot study. Trop Doct. 2004;34:236–8. doi: 10.1177/004947550403400420. [DOI] [PubMed] [Google Scholar]
- 29.Nsimba SE. Assessing prescribing and patient care indicators for children under five years old with malaria and other disease conditions in public primary health care facilities. Southeast Asian J Trop Med Public Health. 2006;37:206–14. [PubMed] [Google Scholar]
- 30.Olayemi SO, Akinyede AA, Oreagba AI. Prescription pattern at primary health care centres in Lagos State. Niger Postgrad Med J. 2006;13:220–4. [PubMed] [Google Scholar]
- 31.Risk R, Naismith H, Burnett A, Moore SE, Cham M, Unger S. Rational prescribing in paediatrics in a resource-limited setting. Arch Dis Child. 2013;98:503–9. doi: 10.1136/archdischild-2012-302987. [DOI] [PubMed] [Google Scholar]
- 32.Shiferaw G, Gedif T, Gebre-Mariam T. Drug utilization Pattern in selected Health Facilities in Bahir Dar and West Gojam Zones, Northwest Ethiopia. Ethiop Pharm J. 2010;28:55–62. [Google Scholar]
- 33.Tsega B, Hailu W, Ergetie Z. Measuring quality of drug use in primary health care facilities: A year long assessment of WHO prescribing indicators, Wolkite Town South West Ethiopia. Int J Pharm Ind Res. 2012;2:485–91. [Google Scholar]
- 34.Trap B, Hansen EH, Hogerzeil HV. Prescription habits of dispensing and non-dispensing doctors in Zimbabwe. Health Policy Plan. 2002;17:288–95. doi: 10.1093/heapol/17.3.288. [DOI] [PubMed] [Google Scholar]
- 35.Uzochukwu BS, Onwujekwe OE, Akpala CO. Effect of the Bamako-Initiative drug revolving fund on availability and rational use of essential drugs in primary health care facilities in south-east Nigeria. Health Policy Plan. 2002;17:378–83. doi: 10.1093/heapol/17.4.378. [DOI] [PubMed] [Google Scholar]