

Abstract
Introduction:
Now-a-day age determination has gained importance for various forensic and legal reasons. Skeletal age (SA) of a test population can be estimated by comparing with established standards of Greulich and Pyle (G-P). As this atlas has been prepared using data from upper-class children born between 1917 and 1942 in the USA and the applicability of these standards to contemporary populations has yet to be tested on Andhra children living in India. Hence, this study was aimed to assess the reliability of bone age calculated by G-P atlas in estimation of age in selected population.
Materials and Methods:
A total of 660 children (330 girls, 330 boys) between ages 9 and 20 years were randomly selected from outpatient Department of Oral Medicine in GITAM Dental College, Andhra Pradesh. Digital hand-wrist radiographs were obtained and assessed for SA using G-P atlas and the difference between estimated SA and chronological age (CA) were compared with paired t-test and Wilcoxon signed rank test.
Results:
G-P method underestimated the SA by 0.23 ± 1.53 years for boys and overestimated SA by 0.02 ± 2 years in girls and mild underestimation was noted in the total sample of about 0.1 ± 1.78 years. Spearman rank test showed significant correlation between SA and CA (r = 0.86; P < 0.001).
Conclusion:
This study concluded that G-P standards were reliable in assessing age in South Indian Andhra children of age 9–20 years with unknown CA.
KEY WORDS: Age estimation, digital radiography, forensic radiology, Greulich and Pyle atlas, skeletal age
Age estimation is one of the most important factors to establish individual's identity. The identification of victims of terror or terrorist has become a critical concern worldwide today due to the rise in illegal border immigration in developing countries. The application of forensic radiology is expanding as the science develops. Unfortunately, births are not documented or regularly maintained in India, even in urban areas.
However, determination of skeletal age (SA) is very important in identifying criminal and legal responsibility, and for many social events, such as marriage, beginning a job, joining the army and retirement. According to Indian Law, a child below the age of 7 years cannot be considered, a child in conflict with the law (Indian Penal code 1860). No child under the age of 14 years shall be employed to work in any factory/mine or engaged in any other hazardous employment (Labor act 1951) and imprisonment under 12 years age is strictly prohibited and described that child means a person with age below 16 years, minor means with age above 16 years and below 18 years and also limits the ages of marriage as 18 years for women and 21 years for men and implies that every citizen older than 18 years of age (major) have social and legal responsibilities.
Skeletal maturity is the only developmental indicator that remains at hand from birth to adulthood. The degree of skeletal development reflects the degree of physiological maturation, which is indulged on the basis of degree of bone ossification. SA is an excellent measure for diagnosing the growth status, health monitoring, metabolic and genetic disorders, precocious puberty, endocrinology diseases, nutritional disorders and orthopedic problems in children and also to monitor response to medical therapy.[1]
Various methods have been used to assess skeletal maturation, including evaluation of physiologic parameters such as peak growth velocity, puberty, dental development. The ossification of hand is putatively considered to represent the maturation of entire skeletal system.[2] Clear demonstrations of different stages of development of various bones in a small area have made SA determination from hand-wrist radiographs a popular method.[3]
Many approaches for assessing SA from hand-wrist radiographs have been described.[3,4,5,6,7,8] First, it involves comparing the SA of a test population against established standards. Second, maturity can be assessed by measuring the size of the shadows of various bones on the radiograph and thirdly by radiographing all the joints on one side of the body and counting the number of centers which have ossified and the number of epiphyses which have fused.[9]
Among these, the widely used standards are those published in the radiographic atlas of skeletal development of the hand and wrist by Greulich and Pyle (G–P). In this method, the ossification status of the subject's hand and wrist bones is compared with the standard of the same sex, nearest chronological age (CA), and corresponding bones depicted in the atlas. Standard hand-wrist radiographs are presented in the G-P atlas, ranging from those at birth in both boys and girls to those at age 19 years in men and 18 years in women. This method assumes that the skeletal development of the hand and wrist is representative of the individual's overall skeletal maturation.[3]
Even though the assessment of age according to skeletal development is the most commonly used method, there are well-known factors which affect skeletal maturity such as ethnic origin, gender, race, environmental factors, urbanization, socioeconomic status, systemic diseases, nutritional disorders, constitutional growth retardation, congenital and endocrinological disorders (hypothyroidism, congenital adrenal hypoplasia, precocious puberty) and secular trends.[10,11,12,13,14,15]
The applicability of the G-P standards to populations, which differ from their reference population is often questioned. This lack of assurance is because, by its nature, a standard is based on the results of a specific study performed on a specific population at a specified point in time. Moreover, no two individuals grow and develop at the same rate. Skeletal development has variations among populations, and these differences exist between several ethnic groups worldwide. As this method has not been tested in South Indian Andhra children, the aim of the study was to evaluate the applicability of the G-P standards to contemporary South Indian children of 9–20 years age and also to assess the possible relation between estimated SA and CA.
Materials and Methods
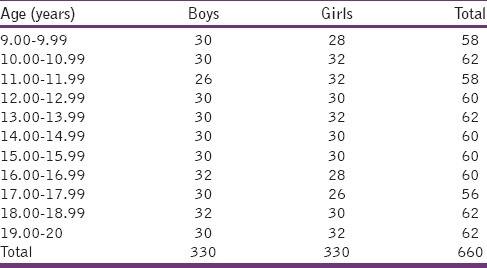
Digital hand-wrist radiographs of the left hand were obtained for 660 randomly selected children (330 girls, 330 boys) with ages ranging from 9 to 20 years divided into 11 groups according to sex and age [Table 1]. Informed consent forms were signed by the subjects/or from their parents, and this cross-sectional study was approved by GITAM Dental College, Andhra Pradesh. All the subjects included had both the parents and belonged to middle socioeconomic status with their parent monthly income ranging from Rs. 8000 to 15,000. Personal details were limited to sex, date of birth and date of the image. All the radiographs were taken with PROMAX digital Planmeca machine. Subjects included in this study fulfilled the following criteria: (a) Local resident of Andhra Pradesh. (b) Normal findings on the radiograph of the left hand with neither bone (including fracture) or soft tissue abnormalities (c) with no congenital and growth or nutritional disturbances (d) with no history of chronic illness.
Table 1.
Distribution of sample according to age and sex
Age determination using Greulich and Pyle atlas
Chronological age of an individual was calculated by the difference between date of birth and the date that the image was taken. An estimation of age was undertaken for each of the radiographs using the G-P atlas.[3] The age estimation was undertaken without prior knowledge of the CA of each of the child examined. Owing to the well-recorded differences in the development of girls and boys, age estimation was undertaken separately for each sex by two observers separately. Each radiographic image was compared with images on G-P atlas according to sex and most matching images gave the SA. Both the CA and estimated SA were translated to years for the purposes of statistical analyses. To test intra-examiner reliability, each observer reevaluated 50 images after 2 months of same subjects.
Results
The data so collected from 660 (330 girls, 330 boys) subjects was arranged according to age and sex [Table 1] and then analyzed using Statistical Package for the Social Sciences computer software (SPSS, version 20.0, SPSS Inc., Chicago, IL, USA). The mean differences and their standard deviations between different readings were calculated for each age group. The differences between the estimated SA and the CA were compared based on age and gender with paired t-test and Wilcoxon signed rank test.
Intra- and inter-observer accuracy was tested using a subset of 50 randomly selected radiographs from the female and male left-hand radiographs respectively and was observed 2 months after the first age estimation was undertaken. The inter- and intra-observer agreements were determined using the intra-class correlation coefficient (ICC). Spearman rank correlation test was performed to assess the relation between estimated SA and CA. The differences were considered significant when the P < 0.05.
The relationship between CA and estimated SA using G-P method was evaluated according to gender and age groups in the total population by analyses of means and standard deviation and presented in Table 2. Mean CA for boys was 14.47 ± 3.16 years. Mean SA was 14.24 ± 3.25 years. For boys except in 16–16.99 year and 19–20 year age groups, in all other age groups no statistically significant differences were observed (P > 0.05) and mean SA was underestimated in all age groups except for 10–10.99, 11–11.99 and 17–17.99 year age groups. However, underestimation of 0.23 years was noted in the whole sample when compared to CA in boys.
Table 2.
Comparison between skeletal age using G-P method and chronological age (in years)
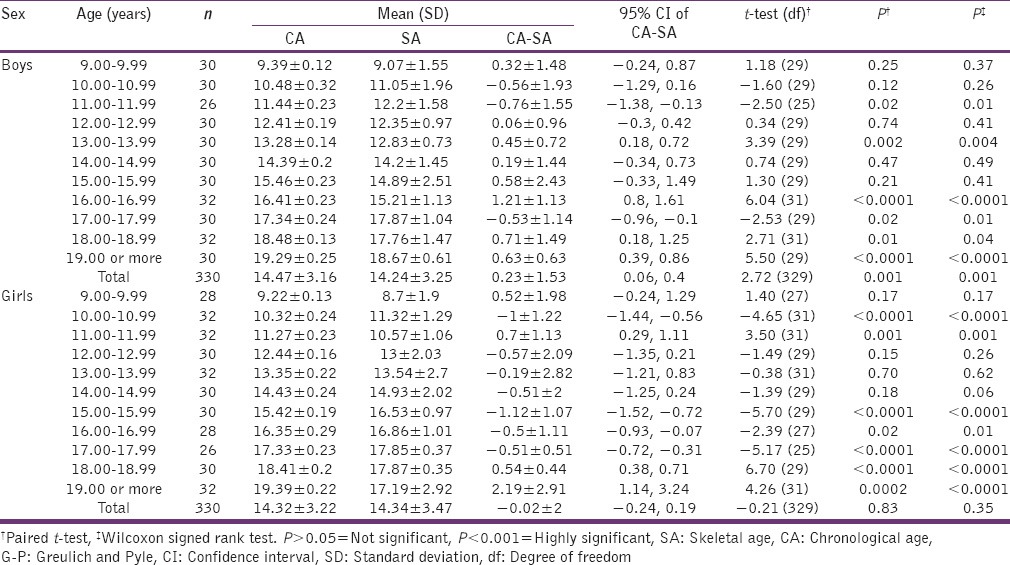
For girls, mean CA was 14.32 ± 3.22 years. Mean SA was 14.34 ± 3.47 years. Except for 10–10.99, 15–15.99, 17–20 year age groups, in all other age groups no statistically significant (P > 0.05) differences were noted and SA was overestimated in all age groups except in 9–9.99, 11–11.99 and 18–20 year age groups. SA was slightly overestimated by 0.02 years in the total sample compared to CA in girls.
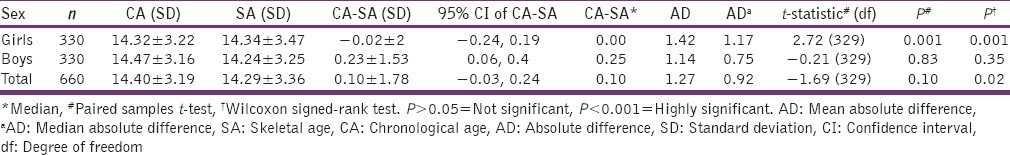
The independent samples t-test results indicated that the mean CA was 14.40 ± 3.19 years, and the mean SA was 14.29 ± 3.36 years. This mean indicated a mild under aging of the entire sample as by about 0.1 ± 1.78 years. The mean age difference between SA determined using G-P method (from American upper class population) and the CA of this South Indian population was 0.02 years for girls, which was not significant (P > 0.05) and 0.23 years for males and was found highly significant (P < 0.001). The mean difference between SA and CA was 0.1 years and was statistically not significant (P > 0.05). The mean absolute differences were 1.42 years for girls and 1.14 years for boys and showed that absolute accuracy was better for boys compared to girls [Table 3].
Table 3.
Summary of mean differences in years (CA-SA) between the SA and the CA and AD for each radiographic method for girls and boys
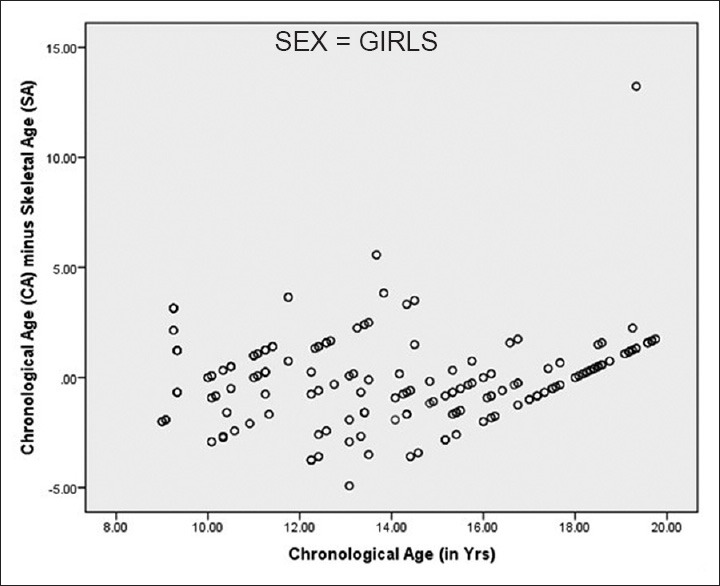
Spearman rank test showed very high significant correlation between SA and CA (r = 0.86; P < 0.001) [Table 4]. ICC values for both inter- and intra-observer agreements were found to be 0.96. There was no statistically significant difference, and the values were thought to be considerably high and reliable representing an excellent agreement among the observers [Tables 5 and 6]. Figures 1-3 demonstrate the distribution of estimated SA in comparison with CA in boys and girls respectively. They show that underestimation was more common in boys and overestimation was more common in girls.
Table 4.
Spearman correlation between CA and SA for G-P method among boys and girls
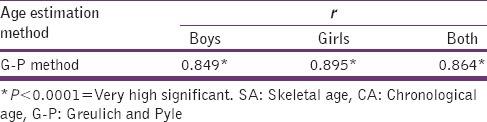
Table 5.
ICC between two examiners for G-P method among boys and girls
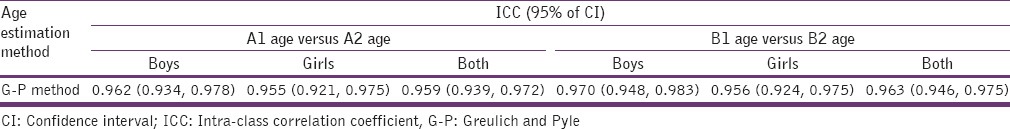
Table 6.
ICC between two examiners for G-P method among boys and girls
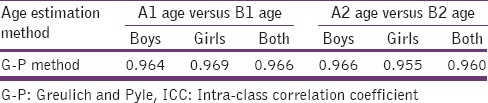
Figure 1.
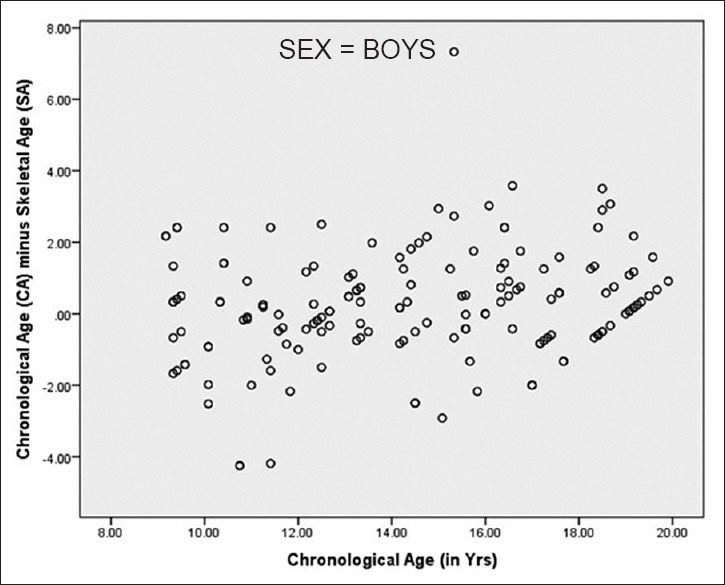
Accuracy of Greulich and Pyle method (95% confidence limits of mean accuracy in years) for boys with ages 9.00–20.00 years)
Figure 3.
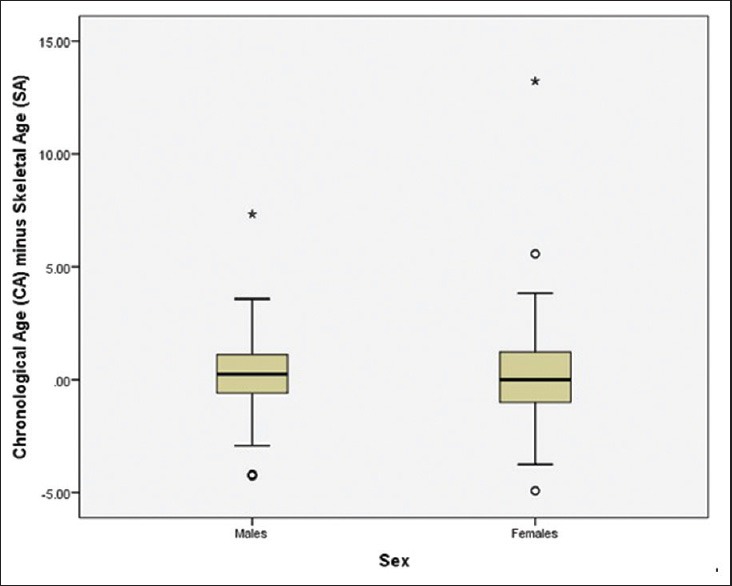
Box plot of the difference between the skeletal age and the chronological age for girls and boys according to the Greulich and Pyle method. Box plots shows median and interquartile range, whiskers indicate the range
Figure 2.
Accuracy of Greulich and Pyle method (95% confidence limits of mean accuracy in years) for girls with ages 9.00–20.00 years)
The 1959 edition of the G-P atlas has separate standards for males and females: “Male standard 31” radiographic image represents complete skeletal maturity in males with an assigned CA of 19 years and “Female standard 27” represents complete skeletal maturity in females with an assigned CA of 18 years. Although G-P atlas assesses age up to 18 and 19 years in girls and boys respectively, the present study involves the individuals up to 20 years to ensure that all images were included in the analyses for true representation of the sample.
Figure 4 shows a digital hand-wrist radiograph of a female subject with chronological age of 11 years matched with the “Female standard 18” image in Greulich and Pyle atlas and skeletal age estimated was 10 years. Figure 5 shows a digital hand-wrist radiograph of a male subject with chronological age of 12.67 years matched with the “Male standard 23” image in Greulich and Pyle atlas and skeletal age estimated was 13 years
Figure 4.
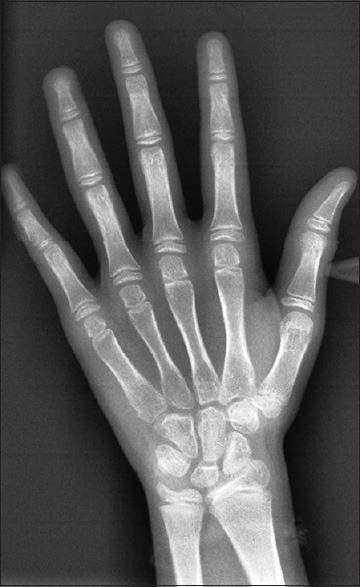
Digital hand-wrist radiograph of a female subject with chronological age of 11 years matched with the “Female standard 18” image in Greulich and Pyle atlas and skeletal age estimated was 10 years
Figure 5.
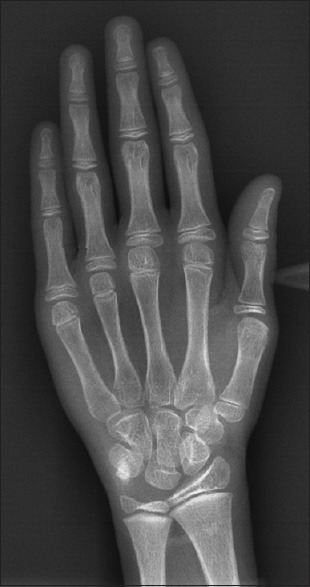
Digital hand-wrist radiograph of a male subject with chronological age of 12.67 years matched with the “Male standard 23” image in Greulich and Pyle atlas and skeletal age estimated was 13 years
Within the 18–20 year age group of females, there were 9 individuals who had not reached the stage of maturity seen in “Female standard 27” and in 19–20 year age group of males, there were 8 individuals who had not reached “Male standard 31” even though the individual had passed the identified CA for these standards. However, finding these individuals, who were still undergoing fusion, can be predicted as in any population there will be individuals who, for a variety of reasons, reach maturational milestones at a different CA to others. In the present study, the majority of the female children showed complete maturity of the hand bones at the age of 17 years while most of the male children showed complete maturity of the hand bones at the age of 19 years.
It can be seen that in females with ages 18–18.99 and 19–19.99 years, the mean SA was 17.87 and 17.19 years respectively and in males with age 19–20 years had a mean SA of 18.67 years. This can be attributed due to the fact that G-P method identifies the attainment of maturity as 18 years in females and 19 years in males. Hence, individuals chronologically older than 18 years in females and 19 years in males will have an estimated SA of 18 and 19 years respectively.
Discussion
For numerous forensic investigations of both living and dead individuals, the knowledge of actual age or date of birth of the subject is of utmost importance. Skeletal maturation assessment in children and adolescents is of great importance in orthodontics, pediatric endocrinology, forensic and anthropology.
Development of the skeleton follows a sequence, regulated by genetic mediation through hormones. Skeletal maturity is a measure of development basing on the size, shape and degree of ossification of bone to define its proximity to full maturity and can be seen radiologically. SA affords an excellent estimate of the pattern of facial growth, development, health and nutrition of a child and provides a good representation and estimate of biologic age. However, all children do not mature exactly at the same time, and a child's degree of skeletal maturation can be advanced or delayed in comparison with CA. CA, as a result, might not closely relate to the amount of progress the child has made toward attaining adulthood and clinicians and researchers recognize the need to assess biologic maturity.
The study of the epiphyseal union of bones is considered a reasonable scientific and accepted method to measure skeletal maturity. The atlas method according to G-P is the most commonly used method for skeletal maturity owing to the convenience, ease, time effectiveness and less prone to errors.[10,16,17,18,19,20,21,22] The first edition of the G-P atlas was published in 1950 and involved the hand skeletal of the Caucasian population of upper socioeconomic status in the 1930s during the Brush study. The second edition was published in 1959 and the most recent edition in 1988.[3] Owing to the ethical considerations of undertaking longitudinal radiographic studies in children at various stages of age, it is not possible to develop latest equivalents of the radiographic atlases and so it has become necessary to test existing methods to understand inherent errors of the method, when applied to a targeted population.
The present study was an attempt to determine whether the standards of the G-P atlas are adequate for South Indian Andhra children for forensic purpose. In this study, skeletal maturation level for each subject was assessed using digital hand-wrist radiograph according to G-P method.
The population studied here showed a pattern of underestimating the age of males in all the age groups with the exception of three groups (10–10.00, 11–11.99, 17–17.99 year age groups), showing over aging in contrast to previous studies[19,21,23,24,25,26,27,28] where males show underestimation before puberty and overestimation after puberty. In females the age was overestimated in agreement with previous studies,[11,21,23,24,27,29,30] in all age groups, with the exception of four groups (9–9.99, 11–11.99, 18–18.99, 19–20 year age groups) showing under aging.
In the present study, the mean of the difference between estimated age and CA ranges from 0.06 years to 1.21 years in boys (in 12–12.99 and 16–16.99 year age groups) and from 0.19 years to 2.19 years in girls (in 13–13.99 and 19–20 year age groups) respectively. The maximum differences between CA and SA showed a maximum under age of 0.71 years (18–18.99 year age group) and maximum overage by 0.76 years (11–11.99 year age group) in boys. However, girls showed maximum underage of 2.19 years (19–20 year age group) and maximum overage by 1.12 years (15–15.99 year age group). With most maturational events, the tempo of maturation is faster in girls, in agreement with previous studies.[11,31]
Even though, patterns of maturation change over time, mean difference between CA and SA noted in this study was very less and indicates that specific bony maturation patterns have not changed in selected population, observed in G-P atlas. In the present study, we found a significant correlation between CA and estimated SA in both males and females. that is, r = 0.85 for boys and r = 0.9 for girls [Table 4], similar to previous studies.[10,16,24,29,31,32,33,34,35,36,37] However, there were also a number of studies,[11,20,21,22,24,26,27,38,39,40,41,42,43,44] which found that the G-P atlas was inappropriate for use on the population that they studied. The present study showed delayed SA in boys and advanced SA in girls in contrast to previous studies,[30,34,39,40,42] in which both the sex were either delayed or advanced.
The levels of agreement between inter- and intra-observer assessments in this study were high in agreement with previous studies,[10,19,23,26,32,45] where the reproducibility of the G-P atlas has been shown to be high. In the present study, the age at which complete fusion of lower end of radius and ulna was found to be 17 years for females and 19 years for males, in agreement with previous studies in various parts of India.[46,47,48,49,50]
Several reports showed that skeletal maturation may vary owing to different ethnic and socioeconomic groups of children or among children living in various geographic locations. Koc et al.[25] study in Turkish boys of age 7–17 years showed delayed mean SA in 7–13 years and advanced mean SA in 14–17-year individuals, in contrast to the present study. Loder et al.[20] tested the applicability of G-P standards to black and white of today and concluded that the standards were applicable to white girls at all ages, white boys in early childhood and black boys until late childhood and standards were not applicable to other age groups or to black girls of any age.
Ontell et al.[19] studied bone age in children of white, black, Asian and Hispanic boys and girls and concluded that usage of G-P standards must be done with reservations particularly in black and Hispanic girls and in Asian and Hispanic boys in adolescence. Patil et al.[38] studied bone age among North Indian people from 1 to 19 years of age and found that boys were retarded in SA by 0.7 years and females by 0.33 years respectively. Levine[44] studied skeletal maturity in four different ethnic groups and stated that Indians do not reach the G-P standards.
Mora et al.[22] assessed the applicability of G-P atlas in 534 children of European and African descent and stated that prepubertal American children of European descent have significantly delayed skeletal maturation when compared to those of African descent. Büken et al.[11] investigated the reliability of G-P atlas in northwest Turkish population and concluded that girls were advanced in SA compared to boys, in agreement with the present study.
Many advantages have been encountered in this study compared with previous reports with uniformly distributed large sample divided into definite age groups with adequate number of males and females. Some authors consider that the socioeconomic characteristics of each population are the most important factors in bone age maturity rate variation[51] and identified that socioeconomic factors, nutrition and poverty as producing significant delays in bone maturation[14,52] but the current sample was homogenous with respect to biological ancestry, nutrition and socioeconomic status. In addition in the present study, the CA and SA assessed using G-P atlas were made into years, to reduce the discrepancies. Cole and Cole[53] suggested that deprivation in early life leads to skeletal retardation and highlights single parent families as being particularly at risk. This factor does not contribute to this study as all the subjects included had both the parents. Digital radiographs were used in the study, which offered better resolution and high-quality images and greatest flexibility with minimal radiation exposure (64 kVp, 5 mA).
Greatest limit of the method seems to be the observer experience in determining the various standards of skeletal maturity and also we didn’t investigate skeletal maturity in children under 9 years of age.
Conclusion
When G-P method of age estimation has been applied to South Indians, mild underestimation of SA was noted leading to delayed skeletal maturity in boys and mild overestimation of SA was noted leading to advanced skeletal maturity, when compared to Americans. In this study, a significant relation was found between estimated SA and CA and concluded that G-P atlas still remains applicable in South Indian Andhra children for age estimation during forensic purposes. As no published data are available regarding the application of G-P method in South Indian Andhra population, this study provides an insight in using G-P method for estimating average age of a child with unknown CA.
Financial support and sponsorship
Nil.
Conflicts of interest
There are no conflicts of interest.
References
- 1.Tanner JM, Whitehouse RH. A note on the bone age at which patients with true isolated growth hormone deficiency enter puberty. J Clin Endocrinol Metab. 1975;41:788–90. doi: 10.1210/jcem-41-4-788. [DOI] [PubMed] [Google Scholar]
- 2.Schmidt S, Koch B, Schulz R, Reisinger W, Schmeling A. Studies in use of the Greulich-Pyle skeletal age method to assess criminal liability. Leg Med (Tokyo) 2008;10:190–5. doi: 10.1016/j.legalmed.2008.01.003. [DOI] [PubMed] [Google Scholar]
- 3.Greulich WW, Pyle SI. Stanford, CA: Stanford University Press; 1959. Radiographic Atlas of Skeletal Development of the Hand and Wrist. [Google Scholar]
- 4.Thiemann HH, Nitz I. Stuttgart, New York: Thieme; 1991. X-ray Atlas of the normal hand in childhood Leipzig. [Google Scholar]
- 5.Fishman LS. Radiographic evaluation of skeletal maturation. A clinically oriented method based on hand-wrist films. Angle Orthod. 1982;52:88–112. doi: 10.1043/0003-3219(1982)052<0088:REOSM>2.0.CO;2. [DOI] [PubMed] [Google Scholar]
- 6.Tanner JM, Whitehouse RH, Marshal WA, Healy MJ, Goldstein H. London: London Academic Press; 1975. Assessment of Skeletal Maturity and Prediction of Adult's Height (TW2 Method) [Google Scholar]
- 7.Todd TW. Atlas of Skeletal Maturation. 1st ed. St. Louis: CV Mosby; 1937. [Google Scholar]
- 8.Roche AF, Chumlea C, Thissen D. Springfield, lllinois: Charles C. Thomas Publisher; 1988. Assessing the Skeletal Maturity of the Hand-Wrist: Fels Method. [Google Scholar]
- 9.Acheson RM. A method of assessing skeletal maturity from radiographs; a report from the Oxford child health survey. J Anat. 1954;88:498–508. [PMC free article] [PubMed] [Google Scholar]
- 10.van Rijn RR, Lequin MH, Robben SG, Hop WC, van Kuijk C. Is the Greulich and Pyle atlas still valid for Dutch Caucasian children today? Pediatr Radiol. 2001;31:748–52. doi: 10.1007/s002470100531. [DOI] [PubMed] [Google Scholar]
- 11.Büken B, Safak AA, Yazici B, Büken E, Mayda AS. Is the assessment of bone age by the Greulich-Pyle method reliable at forensic age estimation for Turkish children? Forensic Sci Int. 2007;173:146–53. doi: 10.1016/j.forsciint.2007.02.023. [DOI] [PubMed] [Google Scholar]
- 12.Castriota-Scanderbeg A, Sacco MC, Emberti-Gialloreti L, Fraracci L. Skeletal age assessment in children and young adults: Comparison between a newly developed sonographic method and conventional methods. Skeletal Radiol. 1998;27:271–7. doi: 10.1007/s002560050380. [DOI] [PubMed] [Google Scholar]
- 13.Gok S, Erolcer N, Ozen C. Age determination in forensic medicine. 2nd ed. Istanbul: Turkish Republic Ministry of Justice, Council of Forensic Medicine Press; 1985. pp. 1–26. [Google Scholar]
- 14.Fleshman K. Bone age determination in a paediatric population as an indicator of nutritional status. Trop Doct. 2000;30:16–8. doi: 10.1177/004947550003000109. [DOI] [PubMed] [Google Scholar]
- 15.Mackay DH. Skeletal maturation in the hand: A study of development in East African children. Trans R Soc Trop Med Hyg. 1952;46:135–50. doi: 10.1016/0035-9203(52)90086-2. [DOI] [PubMed] [Google Scholar]
- 16.Aydin AM, Poyraz AK, Akarsu S, Ozdemir H, Yildirim H, Ogur E. Observer variability of pediatric bone age assessment by using the Greulich and Pyle method. Firat Tip Derg Firat Med J. 2014;19:17–21. [Google Scholar]
- 17.Malina RM. A consideration of factors underlying the selection of methods in the assessment of skeletal maturity. Am J Phys Anthropol. 1971;35:341–6. doi: 10.1002/ajpa.1330350308. [DOI] [PubMed] [Google Scholar]
- 18.Roche AF, Rohmann CG, French NY, Dávila GH. Effect of training on replicability of assessments of skeletal maturity (Greulich-Pyle) Am J Roentgenol Radium Ther Nucl Med. 1970;108:511–5. doi: 10.2214/ajr.108.3.511. [DOI] [PubMed] [Google Scholar]
- 19.Ontell FK, Ivanovic M, Ablin DS, Barlow TW. Bone age in children of diverse ethnicity. AJR Am J Roentgenol. 1996;167:1395–8. doi: 10.2214/ajr.167.6.8956565. [DOI] [PubMed] [Google Scholar]
- 20.Loder RT, Estle DT, Morrison K, Eggleston D, Fish DN, Greenfield ML, et al. Applicability of the Greulich and Pyle skeletal age standards to black and white children of today. Am J Dis Child. 1993;147:1329–33. doi: 10.1001/archpedi.1993.02160360071022. [DOI] [PubMed] [Google Scholar]
- 21.Rikhasor RM, Qureshi AM, Rathi SL, Channa NA. Skeletal maturity in Pakistani children. J Anat. 1999;195(Pt 2):305–8. doi: 10.1046/j.1469-7580.1999.19520305.x. [DOI] [PMC free article] [PubMed] [Google Scholar]
- 22.Mora S, Boechat MI, Pietka E, Huang HK, Gilsanz V. Skeletal age determinations in children of European and African descent: Applicability of the Greulich and Pyle standards. Pediatr Res. 2001;50:624–8. doi: 10.1203/00006450-200111000-00015. [DOI] [PubMed] [Google Scholar]
- 23.Hackman L, Black S. The reliability of the Greulich and Pyle atlas when applied to a modern Scottish population. J Forensic Sci. 2013;58:114–9. doi: 10.1111/j.1556-4029.2012.02294.x. [DOI] [PMC free article] [PubMed] [Google Scholar]
- 24.Chiang KH, Chou AS, Yen PS, Ling CM, Lin CC, Lee CC, et al. The reliability of using Greulich – Pyle method to determine children's bone age in Taiwan. Tzu Chi Med J. 2005;17:417–20. [Google Scholar]
- 25.Koc A, Karaoglanoglu M, Erdogan M, Kosecik M, Cesur Y. Assessment of bone ages: Is the Greulich-Pyle method sufficient for Turkish boys? Pediatr Int. 2001;43:662–5. doi: 10.1046/j.1442-200x.2001.01470.x. [DOI] [PubMed] [Google Scholar]
- 26.Zafar AM, Nadeem N, Husen Y, Ahmad MN. An appraisal of Greulich-Pyle Atlas for skeletal age assessment in Pakistan. J Pak Med Assoc. 2010;60:552–5. [PubMed] [Google Scholar]
- 27.Nahid G, Abdorrahim A, Gharib SM, Anvar E. Assessment of bone age in Kurdish children in India. Pak J Med Sci. 2010;26:36–9. [Google Scholar]
- 28.Büken B, Erzengin OU, Büken E, Safak AA, Yazici B, Erkol Z. Comparison of the three age estimation methods: Which is more reliable for Turkish children? Forensic Sci Int. 2009;183:103.e1–7. doi: 10.1016/j.forsciint.2008.10.012. [DOI] [PubMed] [Google Scholar]
- 29.Calfee RP, Sutter M, Steffen JA, Goldfarb CA. Skeletal and chronological ages in American adolescents: Current findings in skeletal maturation. J Child Orthop. 2010;4:467–70. doi: 10.1007/s11832-010-0289-z. [DOI] [PMC free article] [PubMed] [Google Scholar]
- 30.Schmidt S, Koch B, Schulz R, Reisinger W, Schmeling A. Comparative analysis of the applicability of the skeletal age determination methods of Greulich-Pyle and Thiemann-Nitz for forensic age estimation in living subjects. Int J Legal Med. 2007;121:293–6. doi: 10.1007/s00414-007-0165-7. [DOI] [PubMed] [Google Scholar]
- 31.Cantekin K, Celikoglu M, Miloglu O, Dane A, Erdem A. Bone age assessment: The applicability of the Greulich-Pyle method in Eastern Turkish children. J Forensic Sci. 2012;57:679–82. doi: 10.1111/j.1556-4029.2011.02035.x. [DOI] [PubMed] [Google Scholar]
- 32.Garamendi PM, Landa MI, Ballesteros J, Solano MA. Reliability of the methods applied to assess age minority in living subjects around 18 years old. A survey on a Moroccan origin population. Forensic Sci Int. 2005;154:3–12. doi: 10.1016/j.forsciint.2004.08.018. [DOI] [PubMed] [Google Scholar]
- 33.Cole AJ, Webb L, Cole TJ. Bone age estimation: A comparison of methods. Br J Radiol. 1988;61:683–6. doi: 10.1259/0007-1285-61-728-683. [DOI] [PubMed] [Google Scholar]
- 34.Groell R, Lindbichler F, Riepl T, Gherra L, Roposch A, Fotter R. The reliability of bone age determination in central European children using the Greulich and Pyle method. Br J Radiol. 1999;72:461–4. doi: 10.1259/bjr.72.857.10505010. [DOI] [PubMed] [Google Scholar]
- 35.Schmeling A, Schulz R, Danner B, Rösing FW. The impact of economic progress and modernization in medicine on the ossification of hand and wrist. Int J Legal Med. 2006;120:121–6. doi: 10.1007/s00414-005-0007-4. [DOI] [PubMed] [Google Scholar]
- 36.Zhang A, Sayre JW, Vachon L, Liu BJ, Huang HK. Racial differences in growth patterns of children assessed on the basis of bone age. Radiology. 2009;250:228–35. doi: 10.1148/radiol.2493080468. [DOI] [PMC free article] [PubMed] [Google Scholar]
- 37.Berst MJ, Dolan L, Bogdanowicz MM, Stevens MA, Chow S, Brandser EA. Effect of knowledge of chronologic age on the variability of pediatric bone age determined using the Greulich and Pyle standards. AJR Am J Roentgenol. 2001;176:507–10. doi: 10.2214/ajr.176.2.1760507. [DOI] [PubMed] [Google Scholar]
- 38.Patil ST, Parchand MP, Meshram MM, Kamdi NY. Applicability of Greulich and Pyle skeletal age standards to Indian children. Forensic Sci Int. 2012;216:200.e1–4. doi: 10.1016/j.forsciint.2011.09.022. [DOI] [PubMed] [Google Scholar]
- 39.Lewis CP, Lavy CB, Harrison WJ. Delay in skeletal maturity in Malawian children. J Bone Joint Surg Br. 2002;84:732–4. doi: 10.1302/0301-620x.84b5.12642. [DOI] [PubMed] [Google Scholar]
- 40.Dembetembe KA, Morrris AG. Is Greulich Pyle age estimation applicable for determining maturation in male Africans? S Afr J Sci. 2012;108:1–6. [Google Scholar]
- 41.Shaikh AH, Rikhasor RM, Qureshi AM. Determination of skeletal age in children aged 8-18 years. J Pak Med Assoc. 1998;48:104–6. [PubMed] [Google Scholar]
- 42.Manzoor Mughal A, Hassan N, Ahmed A. The applicability of the Greulich and Pyle Atlas for bone age assessment in primary school-going children of Karachi, Pakistan. Pak J Med Sci. 2014;30:409–11. [PMC free article] [PubMed] [Google Scholar]
- 43.Wenzel A, Droschl H, Melsen B. Skeletal maturity in Austrian children assessed by the GP and the TW-2 methods. Ann Hum Biol. 1984;11:173–7. doi: 10.1080/03014468400007041. [DOI] [PubMed] [Google Scholar]
- 44.Levine E. The contributions of the carpal bones and the epiphyseal centres of the hand to the assessment of skeletal maturity. Hum Biol. 1972;44:317–27. [PubMed] [Google Scholar]
- 45.Lynnerup N, Belard E, Buch-Olsen K, Sejrsen B, Damgaard-Pedersen K. Intra- and interobserver error of the Greulich-Pyle method as used on a Danish forensic sample. Forensic Sci Int. 2008;179:242.e1–6. doi: 10.1016/j.forsciint.2008.05.005. [DOI] [PubMed] [Google Scholar]
- 46.Loomba SD. Age of epiphyseal union at the wrist joint in Uttar Pradesh. J Indian Med Assoc. 1958;30:389–95. [PubMed] [Google Scholar]
- 47.Das Gupta SM, Prasad V, Singh S. A roentgenologic study of epiphyseal union around elbow, wrist and knee joints and the pelvis in boys and girls of Uttar Pradesh. J Indian Med Assoc. 1974;62:10–2. [PubMed] [Google Scholar]
- 48.Nemade KS, Kandi NY, Parchand MP. Ages of epiphyseal union around wrist joint – A radiological study. J Anat Soc India. 2010;59:205–10. [Google Scholar]
- 49.Banerjee KK, Agarwal BB. Estimation of age from epiphyseal union at the wrist and ankle joints in the capital city of India. Forensic Sci Int. 1998;98:31–9. doi: 10.1016/s0379-0738(98)00134-0. [DOI] [PubMed] [Google Scholar]
- 50.Pillai MJ. The study of epiphyseal union for determining the age of South Indians. Indian J Med Res. 1936;23:1015–7. [Google Scholar]
- 51.Schmeling A, Reisinger W, Loreck D, Vendura K, Markus W, Geserick G. Effects of ethnicity on skeletal maturation: Consequences for forensic age estimations. Int J Legal Med. 2000;113:253–8. doi: 10.1007/s004149900102. [DOI] [PubMed] [Google Scholar]
- 52.Jahari AB, Haas J, Husaini MA, Pollitt E. Effects of an energy and micronutrient supplement on skeletal maturation in undernourished children in Indonesia. Eur J Clin Nutr. 2000;54(Suppl 2):S74–9. doi: 10.1038/sj.ejcn.1601008. [DOI] [PubMed] [Google Scholar]
- 53.Cole TJ, Cole AJ. Bone age, social deprivation, and single parent families. Arch Dis Child. 1992;67:1281–5. doi: 10.1136/adc.67.10.1281. [DOI] [PMC free article] [PubMed] [Google Scholar]