Abstract
Successful surgical treatment of ocular astigmatism requires accurate characterization of both magnitude and axis of the astigmatism. Keratometry and topography are clinically widely used for this measurement; however their analysis is limited to the anterior corneal surface. Unlike these techniques, OCT offers the advantage of measuring both the anterior and posterior corneal surface contributions. We present a technique to combine the local curvatures of both surfaces into a single pseudo-surface suitable for clinical application. Building on prior work in distributed scanning OCT (DSOCT) to remove corrupting patient motion artifacts, we present the results of a pilot patient study where extracted values of clinical corneal astigmatic power magnitude and direction from DSOCT corneal volumes were comparable to standard clinical measures of corneal astigmatism.
Surgical treatment of astigmatism – whether via toric intraocular lenses, astigmatic keratotomy incisions, or other commonly performed refractive procedures – requires accurate characterization of the magnitude and axis of the refractive astigmatic power of the cornea. Inaccurate measurements can result in insufficient correction or even increased astigmatism for the patient. Keratometry is currently used to clinically quantify corneal astigmatic power along two orthogonal principal axes. Placido ring-based topography is also used to visualize the two dimensional distribution of astigmatic refractive power in the cornea. Unlike keratometry and topography which consider only the anterior surface contribution of the cornea, tomographic techniques can image both the anterior and posterior surfaces to better characterize the optical properties of the cornea as a whole. Rotating Scheimpflug photography based instruments (e.g. Oculus Pentacam®, Ziemer Galilei®) estimate corneal refractive power from full-diameter, radial photographs of the cornea. Recent studies involving commercial Scheimpflug systems (utilizing proprietary image analysis) have investigated corneal astigmatisms [1, 2]. One study found, in a normal population, a mean posterior surface astigmatic power of −0.30 Diopters (D) with a range of −0.01 to −1.10 D [2]. Optical coherence tomography (OCT) provides micron-scale measurements of the anterior and posterior corneal surfaces. Unavoidable patient motion during the time required for conventional OCT imaging may, however, overwhelm the elevation accuracy required for clinical measurements.
Quantitative corneal curvature and refractive power measurements using OCT has become an active field of research [3-9]. Several groups using a variety of OCT systems have published quantitative results with varying success. Successful implementations for accurate, quantitative curvature measurements require 3D refraction correction, formulae to better unify measurements from ophthalmology and the optical sciences, and scan patterns and reconstruction techniques to mitigate the effects of bulk patient motion [4-8]. These works have demonstrated that surface elevations and lower order spherical refractive power can be recovered from clinical OCT images of the cornea.
Previous works have reported corneal “topography” measurements which were actually elevation maps [6, 9]. While this implementation agrees with a conventional, geographical definition of topology, this does not correspond to the formulae described in the ANSI standard ‘Corneal Topography Systems’ [10] which instead equates to geometric curvatures. In this work, we describe the first demonstration to our knowledge of higher order clinical corneal astigmatic refractive power extraction from OCT and clinical corneal topography maps as described by ANSI standards for reporting clinical corneal curvature over a 5mm zone [10]. In addition, we introduce a technique to combine multiple surface curvatures into a single pseudo-surface for ease of clinical interpretation.
All OCT volumes were acquired along subjects’ visual axis using a commercial spectral domain OCT (SDOCT) system with λ=840nm, Δλ=50nm, 10 kHz A-scan rate and a telecentric scanner for the sample arm (Bioptigen, Inc.; Durham, NC). Distributed scanning OCT (DSOCT) acquires A-scans linear in time but not in space, generating temporally separated, sub-sampled profiles of a critically sampled radial meridian. In post-processing each profile was moved to its correct spatial location by automatically estimating the differences in position of the vertex of the cornea within all profiles for a given meridian. This was done for all meridians. The epithelial and endothelial surfaces from the resulting reconstructed volume were automatically segmented using our previously published algorithm [11]. Following corrections for distortion due to sample arm optics and 3D refraction, these segmentations were then used to calculate the corneal refractive power using methods described previously [4]. These methods and the scan pattern are described in more detail in McNabb, et al. [8]. We have herein extended our methods to include: thickness (pachymetry) maps, meridional curvature (MC) maps, and axial curvature (AC) maps of both corneal surfaces.
For single surfaces, we based our methods for calculating MC and AC maps on formulas outlined in the ANSI Z80.23-2007 standard for corneal topography [10]. The corneal topographer axis (CT axis) is an axis parallel to the optical axis of the topographer and is used as the reference axis for curvature measurements. By correcting for optical distortions in the sample arm, all rays incident on the cornea are parallel to the optical axis allowing us to reference the CT axis to the vertex of the cornea. By adopting this reference, the cornea may translate without changing the AC map. However, rotations of the cornea relative to the CT axis result in a change of the AC map.
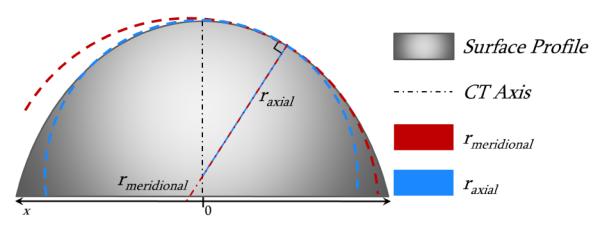
Meridional curvature is a function of the corneal profile elevation with respect to the distance to the CT axis as defined in Eq. 1. Axial curvature has been described mathematically in multiple equivalent forms. We utilize the form in Eq. 2 where xn is the radial position at which Ka is calculated. Figure 1 illustrates the functional differences between Km, Ka and their respective radii of curvature. We analytically calculated a 2D MC map by first modeling the surface profile as a 5th order Zernike polynomial, Z(r,θ), and then substituted Z(r,θ) for M(x) and r for x in Eq. 1. We numerically calculated axial curvature values at each location xn along 0.5° increments based upon the values found from the MC.
| (1) |
| (2) |
Fig. 1.

Illustration of model surface profile with meridional and axial radii of curvatures at a single point
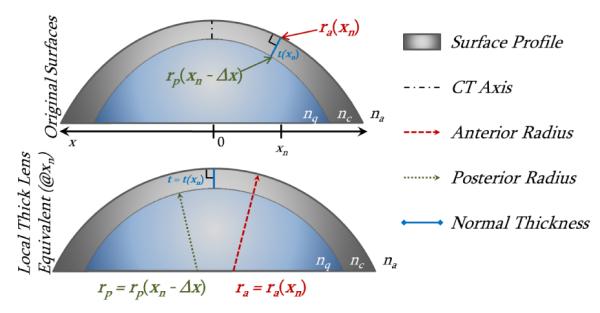
Equations 1 and 2 describe the local curvature for a single surface; however OCT offers the capability to image multiple surfaces and the thickness between them. To provide a single local optical power map that incorporates the contributions from multiple surfaces, we adapted the paraxial thick lens equation (Eq. 3) to use local curvatures and thicknesses from the acquired surfaces. These values included: 1) the local anterior radius of curvature at point xn, ra(xn) 2) the thickness from the anterior surface to the posterior surface, taken along the normal vector to the anterior surface, t(xn) [4] 3) the posterior radius of curvature at the point xn - Δx, rp(xn - Δx), where t(xn) intersects the posterior surface and Δx is the length of t(xn) projected onto the x-axis. We calculated local radii of curvature of a surface by the defined value of rm = 1/Km [10]. Figure 2 illustrates the concept of taking local curvature values and creating a thick lens equivalent.
Fig. 2.

Adaptation of corneal surfaces to a local thick lens equivalent at single point xn; xn is rotated in the bottom image.
Phase refractive indices used for cornea, aqueous, and air were the Gullstrand values found within the literature where: nc=1.376, nq=1.336, and na=1.000 respectively [12]. Clinical topography systems provide optical power maps referenced to the back focal length (BFL) instead of the effective focal length (EFL) [13]. Equation 3 is referenced to the rear principal plane. Equation 4 is adapted from the back vertex power formula to match the reference plane used by clinical topography systems [13].
| (3) |
| (4) |
Corneal OCT image volumes of eyes with a manifest refraction with greater than 2 D of cylinder, which we considered to be clinically apparent, were selected from a previously acquired dataset of patients undergoing preoperative evaluation for laser refractive surgery (7 subjects/10 eyes). Subject eyes were imaged in triplicate by placido-ring topography (Atlas 995®; Carl Zeiss Meditec Inc.; Dublin, CA), Scheimpflug photography (Pentacam® V2.73r19; Oculus Optikgeräte GmbH; Wetzlar, Germany), and DSOCT. For topography, ra was equal to 337.5/K where K was the reported spherical equivalent SimK value over a nominal 3mm zone and 337.5 is equal to the keratometric constant, 1000*(nk - na) as defined by [10]. For Scheimpflug photography, ra and rp were the mean reported radii of the anterior and posterior corneal surfaces, and CCT was the reported thickness at the apex. Refractive power, K, was the reported EKR value for the 3mm zone. For DSOCT we calculated major and minor axis optical powers and directions K1 and K2 from the meridional curvature, Km, at the corneal vertex.
Table 1 shows clinical values for all three devices, including single and multi-surface (SS and MS respectively) DSOCT. For single surface DSOCT measurements, we applied the keratometric constant to only the anterior surface. The first value, , corresponds to the mean value across the patient population. The second value, , corresponds to the mean standard deviation of repeated measurements on each eye. Astigmatism magnitude, ∣Asti∣, is equivalent to the subtraction of axis optical powers, ∣K1 – K2∣. Angle values were unwrapped manually for device comparison calculations.
Table 1.
Mean Clinical Values with Repeatability
| ∣Asti∣ (D) | K (D) | ra (mm) | rp (mm) | CCT (μm) | ||
|---|---|---|---|---|---|---|
| Topography | 42.3±0.1 × 44.5±0.1 @ 88.9±3.3 | 2.2 | 43.4∣±0.1 | 7.79∣±0.02 | -- | -- |
| Scheimpflug | 42.3±0.1 × 44.4±0.3 @ 84.8±4.9 | 2.0 | 43.2∣±0.2 | 7.80∣±0.04 | 6.45∣±0.08 | 568∣±4.4 |
| DSOCT (MS) | 42.2±0.1 × 44.6±0.2 @ 86.1±3.6 | 2.4 | 43.6∣±0.2 | 7.75∣±0.02 | 6.53∣±0.01 | 575∣±2.3 |
| DSOCT (SS) | 42.6±0.1 × 44.9±0.2 @ 85.3±3.5 | 2.4 | -- | -- | -- | -- |
DSOCT (MS) = DSOCT Multi-Surface ∣ DSOCT (SS) = DSOCT Single Surface
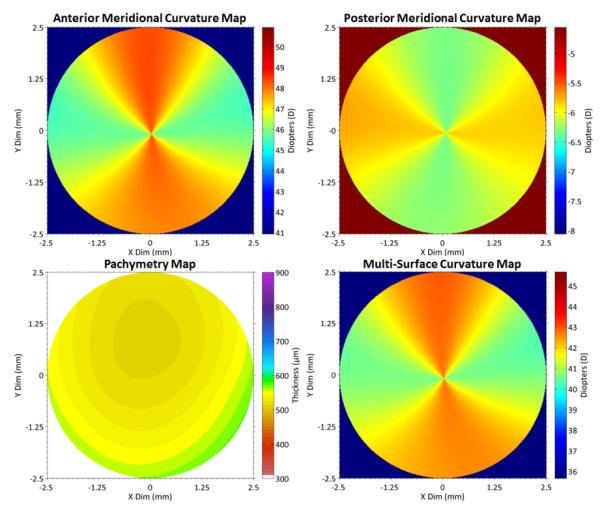
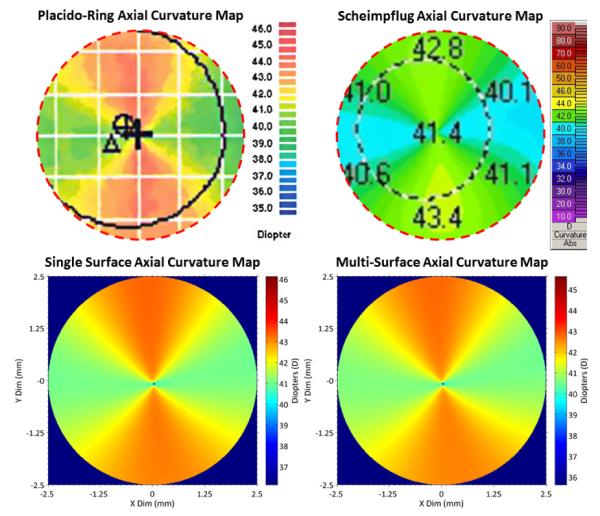
Figures 3 and 4 are from the right eye of a single representative subject with astigmatism of ~3 Diopters (D): Topography = 39.9D × 43.0D @ 96°; Scheimpflug Photography = 39.9D × 43.1 @ 98°; Multi-Surface DSOCT = 39.9D × 42.6D @ 96°. Results for topography and Scheimpflug photography show a centered 5mm region of interest and obtained directly from the respective devices.
Fig. 3.

Top: DSOCT meridional curvature maps of anterior (L) and posterior (R) corneal surfaces Bottom: Pachymetry map taken normal to anterior surface [3] (L) and multi-surface curvature map (R) combining all three as described by Eq. 4.
Fig. 4.

Axial curvature maps Top: Topography (L) and Scheimpflug photography (R) anterior surface; Outer dashed circles: 5mm region of interest Bottom: Single surface (L) and multi surface (R) DSOCT maps over 5mm zones
We propose a method to extend the ANSI Corneal Topography [10] standard to multiple corneal surfaces and provide, to our knowledge, the first experimental comparison of single- and multi-surface OCT corneal curvature topography. For the purposes of clinical comparison and utility we reduced the Zernike surfaces to spherical and astigmatic power but this technique offers the potential to evaluate higher order aberrations in the future. While the difference is not marked in this population of normal preoperative subjects, by including corneal thickness and posterior surface information, multi-surface curvature calculations could, in principle, provide more accurate astigmatic characterization for subjects who have undergone laser refractive surgery and differentially altered their anterior surface relative to the posterior surface [1-3]. Distributed scanning OCT may potentially allow for higher-order keratometric measurements while using currently available commercial SDOCT systems.
Acknowledgments
The authors acknowledge financial support from NIH grant R21-EY020001 and the Coulter Foundation.
Footnotes
OCIS Codes: 110.4500, 170.4460
References
- 1.Visser N, Berendschot TTJM, Verbakel F, de Brabander J, Nuijts RMMA. Comparability and repeatability of corneal astigmatism measurements using different measurement technologies. Journal of Cataract & Refractive Surgery. 2012;38:1764–1770. doi: 10.1016/j.jcrs.2012.05.036. [DOI] [PubMed] [Google Scholar]
- 2.Koch DD, Ali SF, Weikert MP, Shirayama M, Jenkins R, Wang L. Contribution of posterior corneal astigmatism to total corneal astigmatism. Journal of Cataract & Refractive Surgery. 2012;38:2080–2087. doi: 10.1016/j.jcrs.2012.08.036. [DOI] [PubMed] [Google Scholar]
- 3.Tang M, Li Y, Avila M, Huang D. Measuring total corneal power before and after laser in situ keratomileusis with high-speed optical coherence tomography. J. Cataract Refract. Surg. 2006;32:1843–1850. doi: 10.1016/j.jcrs.2006.04.046. [DOI] [PMC free article] [PubMed] [Google Scholar]
- 4.Zhao M, Kuo AN, Izatt JA. 3D refraction correction and extraction of clinical parameters from spectral domain optical coherence tomography of the cornea. Opt. Express. 2010;18:8923–8936. doi: 10.1364/OE.18.008923. [DOI] [PubMed] [Google Scholar]
- 5.Tang M, Chen A, Li Y, Huang D. Corneal power measurement with Fourier-domain optical coherence tomography. J. Cataract Refract. Surg. 2010;36:2115–2122. doi: 10.1016/j.jcrs.2010.07.018. [DOI] [PMC free article] [PubMed] [Google Scholar]
- 6.Ortiz S, Siedlecki D, Pérez-Merino P, Chia N, de Castro A, Szkulmowski M, Wojtkowski M, Marcos S. Corneal topography from spectral optical coherence tomography (sOCT) Biomed. Opt. Express. 2011;2:3232–3247. doi: 10.1364/BOE.2.003232. [DOI] [PMC free article] [PubMed] [Google Scholar]
- 7.Kuo AN, McNabb RP, Zhao M, LaRocca F, Stinnett SS, Farsiu S, Izatt JA. Corneal biometry from volumetric SDOCT and comparison with existing clinical modalities. Biomed. Opt. Express. 2012;3:1279–1290. doi: 10.1364/BOE.3.001279. [DOI] [PMC free article] [PubMed] [Google Scholar]
- 8.McNabb RP, LaRocca F, Farsiu S, Kuo AN, Izatt JA. Distributed scanning volumetric SDOCT for motion corrected corneal biometry. Biomed. Opt. Express. 2012;3:2050–2065. doi: 10.1364/BOE.3.002050. [DOI] [PMC free article] [PubMed] [Google Scholar]
- 9.Ortiz S, Pérez-Merino P, Alejandre N, Gambra E, Jimenez-Alfaro I, Marcos S. Quantitative OCT-based corneal topography in keratoconus with intracorneal ring segments. Biomed. Opt. Express. 2012;3:814–824. doi: 10.1364/BOE.3.000814. [DOI] [PMC free article] [PubMed] [Google Scholar]
- 10.Corneal Topography Systems ANSI Z80.23-2007. 2007.
- 11.LaRocca F, Chiu SJ, McNabb RP, Kuo AN, Izatt JA, Farsiu S. Robust automatic segmentation of corneal layer boundaries in SDOCT images using graph theory and dynamic programming. Biomed. Opt. Express. 2011;2:1524–1538. doi: 10.1364/BOE.2.001524. [DOI] [PMC free article] [PubMed] [Google Scholar]
- 12.Atchison DA, Smith G. Optics of the human eye (Butterworth-Heinemann. 2000.
- 13.Norrby NE. Unfortunate discrepancies. J. Cataract Refract. Surg. 1998;24:433–434. doi: 10.1016/s0886-3350(98)80275-7. [DOI] [PubMed] [Google Scholar]


