Abstract
Photon-counting CT (PCCT) potentially offers both improved dose efficiency and material decomposition capabilities relative to CT systems using energy integrating detectors. With respect to material decomposition, both projection-based and image-based methods have been proposed, most of which require accurate a priori information regarding the shape of the x-ray spectra and the response of the detectors. Additionally, projection-based methods require access to projection data. These data can be difficult to obtain, since spectra, detector response, and projection data formats are proprietary information. Further, some published image-based, 3-material decomposition methods require a volume conservation assumption, which is often violated in solutions. We have developed an image-based material decomposition method that can overcome those limitations. We introduced a general condition on volume constraint that does not require the volume to be conserved in a mixture. An empirical calibration can be performed with various concentrations of basis materials. The material decomposition method was applied to images acquired from a prototype whole-body PCCT scanner. The results showed good agreement between the estimation and known mass concentration values. Factors affecting the performance of material decomposition, such as energy threshold configuration and volume conservation constraint, were also investigated. Changes in accuracy of the mass concentration estimates were demonstrated for four different energy configurations and when volume conservation was assumed.
Keywords: CT, Photon counting, Multi-Energy, Material decomposition, Energy threshold configuration
1. INTRODUCTION
Photon-counting CT (PCCT) with its improved energy resolution and noise properties, may provide improved material differentiation and decomposition capabilities in X-ray CT[1], [2] relative to Energy Integrating Detector (EID) Whereas existing dual-energy CT techniques are limited to 2 measurements using overlapping energy spectra, PCCT may acquire multi-energy (n≥3) measurements simultaneously with decreased spectral overlap. Additionally, photon-counting detectors provide energy-resolved transmission information with better dose efficiency[1]. The improvement in material differentiation and decomposition can yield basis-material images containing estimates of mass concentration. This has potential value for a number of clinical applications.
A number of material decomposition methods have been published in the literature. Projection-based methods are limited by lack of availability of projection data in routine clinical practice. Image-based methods are more convenient in that regard, but frequently assume volume conservation so that three basis materials can be quantified by dual-energy or multi-energy CT measurements[3], [4]. While mass conservation is always true, volume conservation is often violated in solutions or mixtures. Furthermore, both projection- and image-based methods frequently require accurate knowledge of X-ray spectra and detector response, which are proprietary information and difficult to obtain. Although, there is published method to estimate the spectrum from transmission measurements[5], the accuracy of the estimated spectrum is unclear[6]. For example, both spectra and detector response might drift over time due to the aging of components, such as sputtering of anode material on the tube window. Moreover, such measurements require specialized instruments and techniques and can be very time-consuming. Hence, it can be impractical to accurately measure these information in a clinical setting.
In our previous work, we reported an image-based material-decomposition algorithm that includes a general condition on volume constraint that does not require the volume to be conserved in a mixture. This method determines the parameters for material decomposition through calibration using mixtures with known concentrations, and thus does not require accurate knowledge of the x-ray spectra and detector response[7].
The purpose of the current work was to validate our previously proposed image-based material decomposition method on a prototype whole-body PCCT scanner (Siemens Healthcare). Additionally, the effect of assuming volume conservation for a solution mixture (where volume is not conserved) on mass concentration estimation accuracy was experimentally determined. Finally, using the developed technique, we investigated the effect of energy threshold configuration choice on mass concentration accuracy.
2. METHODS
2.1 Image-based material decomposition algorithm
The image-based material decomposition algorithm is based upon mass conservation and the following relationships:
- The mass attenuation of compounds or homogenous mixtures can be expressed as:
where is the mass attenuation coefficient of the mixture, and wi are the mass attenuation coefficient and mass fraction of basis material i.(1) - Conversion between CT number and linear attenuation coefficient: The proposed method directly works on CT number, assuming the relationship between CT number and line attenuation coefficient is
(2)
Combining Eqs. (1) and (2), one can derive the system equation for multi-energy CT measurement:
| (3) |
and a general condition on volume constraint in the mixture:
| (4) |
where ρ̂i (V̂) is the concentration (Volume) of basis material i in the mixture and ρi (Vi) is its concentration (Volume) in its pure form. CT(E)i represents the CT number of basis material i in its pure form at energy E. Here δ is a variable which depends on the composition of basis materials. It can be smaller or bigger than 1. When it is equal to 1, the proposed method is identical to methods with volume conservation. An example where δ>1 is a mixture of iron chloride (FeCl3) and water, which will have a decreased volume relative to the sum of the individual component volumes. Examples where δ<1 include some biopolymer-water solution, which can have a total volume that is greater than the sum of the individual component volumes.
One can further rearrange (3) and (4) into a matrix form
| (5) |
The proposed method determines basis material concentration by solving the following inversion equation:
| (6) |
where ρ̂ is the unknown basis material and mixture densities, M is a material matrix associated with the attenuation properties of the basis materials, and [CT] is the matrix of multi-energy CT measurement in Hounsfield unit.
In this work, we chose calcium chloride, iron chloride, and water as the three basis materials because calcium and iron might server as important biomarkers for a variety of important clinical diagnostic tasks, such as vascular plaque quantification and liver iron overload[8], [9]. However, the similar effective atomic number of calcium chloride (CaCl2, Zeff≅18.2) and iron chloride (FeCl3, Zeff≅21) makes it very challenging to separate and quantify them. To test the capability of PCCT for material differentiation and quantification, we prepared a series of water solution of CaCl2 (n=4) and FeCl3 (n=4) and their mixtures (n=4) with the following concentration range: CaCl2 [29.4 ~ 280.5 mg/ml] (equivalently Ca [10.6 ~ 101.3 mg/ml]) and FeCl3 [23.4 ~ 139.9 mg/ml] (equivalently Fe ([8.1 ~ 48.2 mg/ml]). The lower concentration range of iron matched the values found in literatures about liver iron concentration in hepatic iron-overloaded patients (3~9 mg/g) [10]. The concentration range of calcium was chosen to match the ones previously being used for CT measurement of trabecular bone mineral density [11].
Noise magnification during material decomposition is a common problem and becomes more severe for the differentiation of calcium and iron due to their similar effective atomic numbers. Rather than direct matrix inversion, we use constrained least-squares fitting based on prior information about basis materials to estimate basis material concentration since each sample is composed of basis material mixtures.
2.2 Determination of material matrix M
A calibration procedure is performed using known concentrations of the basis materials of interest, from which the basis material matrix is determined. Most acquisition parameters for calibration should match those in the test scan, including kV, thresholds configuration, and reconstruction kernel. The material matrix is determined by applying least square fitting between the CT measurements and known basis material concentrations. To limit the influence of image noise on the accuracy of the material matrix, the calibration procedure can be performed at high tube current or by repetitive scans. The empirically determined material matrix is then used to estimate each basis material concentration within a mixture of materials.
2.3 Factors affecting material decomposition accuracy
2.3.1
Previously-published image-based methods for dual-energy CT frequently assumed volume conservation so that two energy measurements can be used to quantify three basis materials. As the volume conservation is often violated in solutions, we compared the changes in the accuracy of material decomposition when volume conservation is erroneously assumed for the evaluated solutions. The material decomposition with a volume conservation assumption was obtained by using the same method with the parameter δ (in Eq. 5) being set to unity.
2.3.2
PCCT offers a limited number of energy discriminators and associated counters for each detector channel. For the same incident X-ray spectra or radiation dose, it is important to design the energy threshold configuration to improve the material decomposition results. Previous studies[12], [13] demonstrated that Cramer-Rao Lower Bound (CRLB) analysis can be used to calculate the lowest bound of basis image noise that any unbiased estimator can achieve for multi-energy x-ray transmission measurements. The formula for the calculation of the lowest variance of basis material image noise, , has been derived in 13 and been included for reference.
| (7) |
where Aα represents the line integral of the αth basis material density or basis material thickness along the x-ray path and Fαβ is the Fischer information matrix which can be expressed as
| (8) |
NC is the number of independent measurements results obtained from one single PCCT measurement and νi represents the mean value of detected photon counts in the ith counting measurement. In this work, we use Siemens DRASIM (Siemens Healthcare) simulation tool to simulate PCCT acquisition using a digital phantom to get νi while assume ideal detector response and Poisson statistics.
Theoretically the noise in the reconstructed material specific images can be analytically derived by performing error propagation along the reconstruction framework, similar to our previous work in [14]. For simplification, we did the noise calculation by summing the overall CRLB calculations (oCRLB) of all detector channels at all projection angles. We calculated oCRLB values for 4 empirically selected energy threshold configurations (Table 2) and compared the accuracy of material decomposition results.
Table 2.
oCRLB calculation for 4 energy threshold configuration
| Configuration | CaCl2 | FeCl3 | Water | Mixture |
|---|---|---|---|---|
| A | 4.7E4 | 1.9E4 | 4.9E3 | 7.1E4 |
| B | 1.1E5 | 4.4E4 | 1.1E4 | 1.6E5 |
| C | 1.3E5 | 5.5E4 | 1.4E4 | 2.0E5 |
| D | 5.2E5 | 2.2E5 | 6.6E4 | 8.0E5 |
2.4 PCCT experiments details (system, phantom, acquisition parameters)
We performed a validation of our algorithm using scans of FeCl3 and CaCl2 water solutions and their mixtures acquired with a prototype whole-body PCCT scanner (Siemens Healthcare). Detailed information regarding the prototype PCCT scanner can be found in a previous publication[15] The acquisition parameters used in this experiment were as follows: 140 kV, 1 s rotation time, 400mAs. A chess pattern read-out mode was used so that 4 measurements can be acquired from a single scan, each one associated with a different energy threshold. Four different energy threshold configurations were used:
Configuration A: 20 keV, 50 keV, 63 keV, 83 keV;
Configuration B: 20 keV, 50 keV, 80 keV, 90 keV;
Configuration C: 20 keV, 40 keV, 66 keV, 72 keV;
Configuration D: 20 keV, 35 keV, 50 keV, 80 keV;
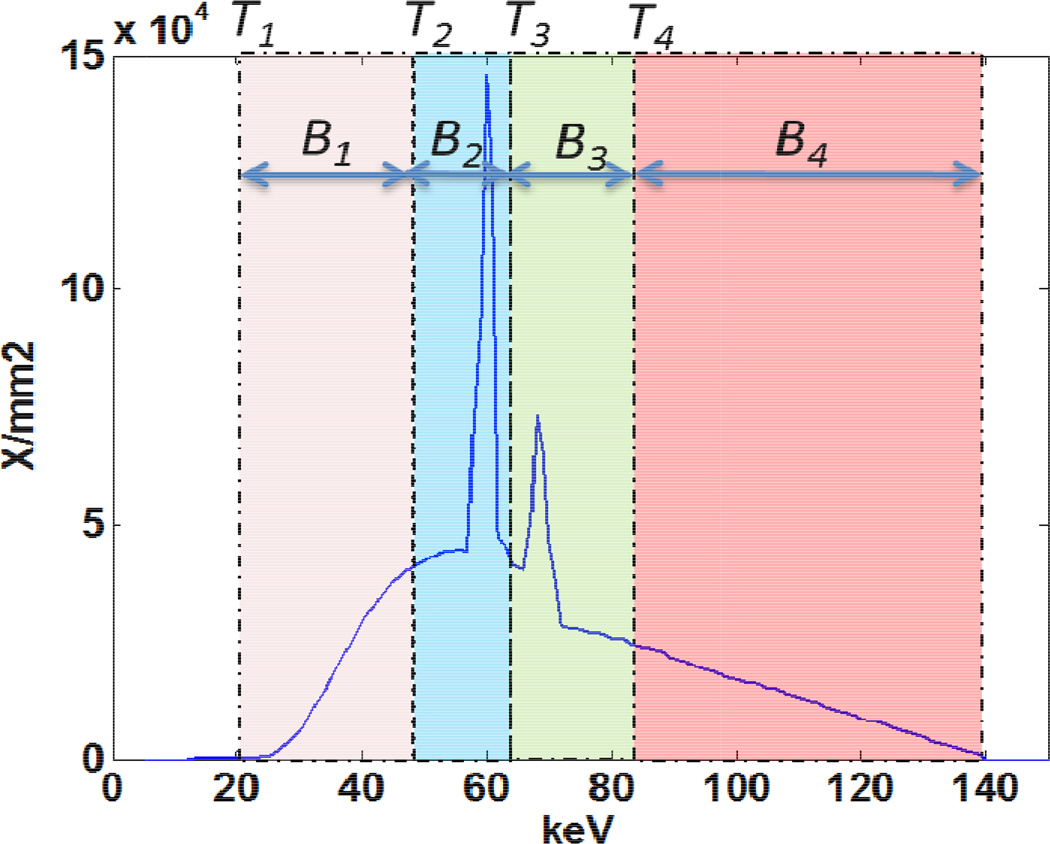
Prior to the logarithm step in the data pre-processing, the threshold data sets were subtracted from one another to create bin images (Figure 1), where, for example, bin 1 (B1) data = threshold 1 (T1) data - threshold 2 (T2) data. By extension, B2=T3-T2, B3=T4-T3, and B4=T4. The energy bin projection data were reconstructed to create the energy bin images, which were used to validate the developed material decomposition method. All images were reconstructed using a quantitative medium smooth body kernel (D30) and an image thickness of 2 mm.
Figure 1.
Four energy bins (B1–B4) are achieved with 4 energy thresholds (T1–T4)
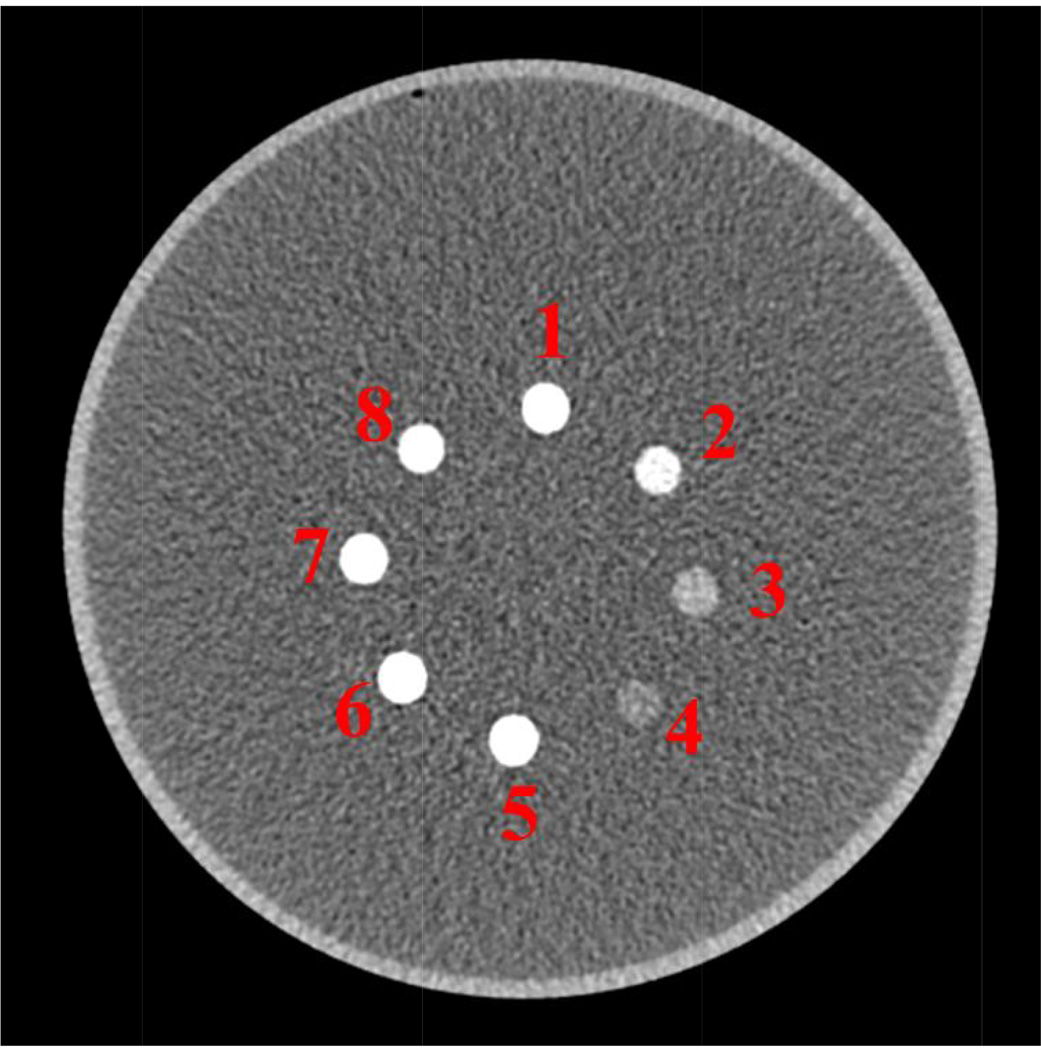
The calibration measurements were acquired using a set of FeCl3 and CaCl2 water solutions (samples 1–4 and 9–12), different as the test set which includes both CaCl2 water solution and the water solution of FeCl3/CaCl2 mixtures (samples 1–8). Both calibration and testing samples were measured in a 20-cm diameter water cylinder having a PMMA shell. Figure 2 shows one bin image of the test samples used in this work.
Figure 2.
The test samples used in the work contains both pure CaCl2 water solution (1–4) and CaCl2/FeCl3 water solution (5–8).
The performance of material decomposition was evaluated in terms of noise and artifacts of the basis material images, as well as the accuracy of the mean concentration of each sample relative to the known concentration.
3. Results
Table 2 shows the oCRLB calculation for 4 energy threshold configurations. For the same scanner output or radiation dose, 4 threshold configurations yielded 4 different oCRLB values. Almost all values in configuration D are about 10 times higher than configuration A, which implies higher uncertainty in the basis material density estimation. Configuration B is slightly better than C and both of them are better than D, but worse than A. The predicted ranking of all four threshold configurations on decomposition accuracy is: A>B>C>D.
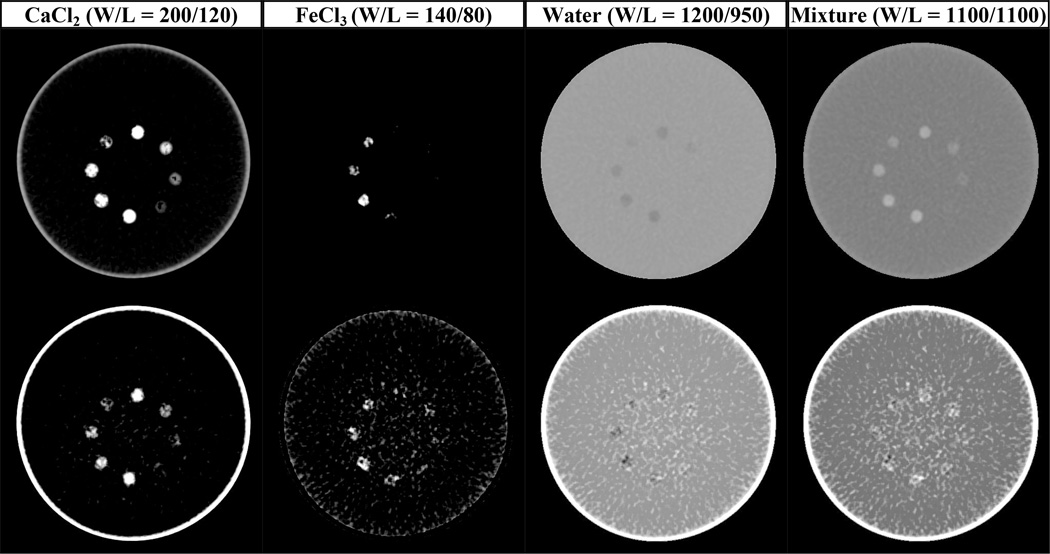
Figure 3 shows the basis material images in which the pixel value represents mass concentration values. The iron image shows signal only in samples 5–8 (the only samples that contained iron), while the calcium image shows signal in all 8 samples (all of which did contain calcium). The influence of energy threshold configuration is quite obvious. Material specific images from threshold configuration D contain higher noise than A and the objects in the phantom are less defined.
Figure 3.
Material specific images from the material decomposition of PCCT with energy threshold configuration A (top) and D (bottom). The unit of pixel value in each image is in mg/ml.
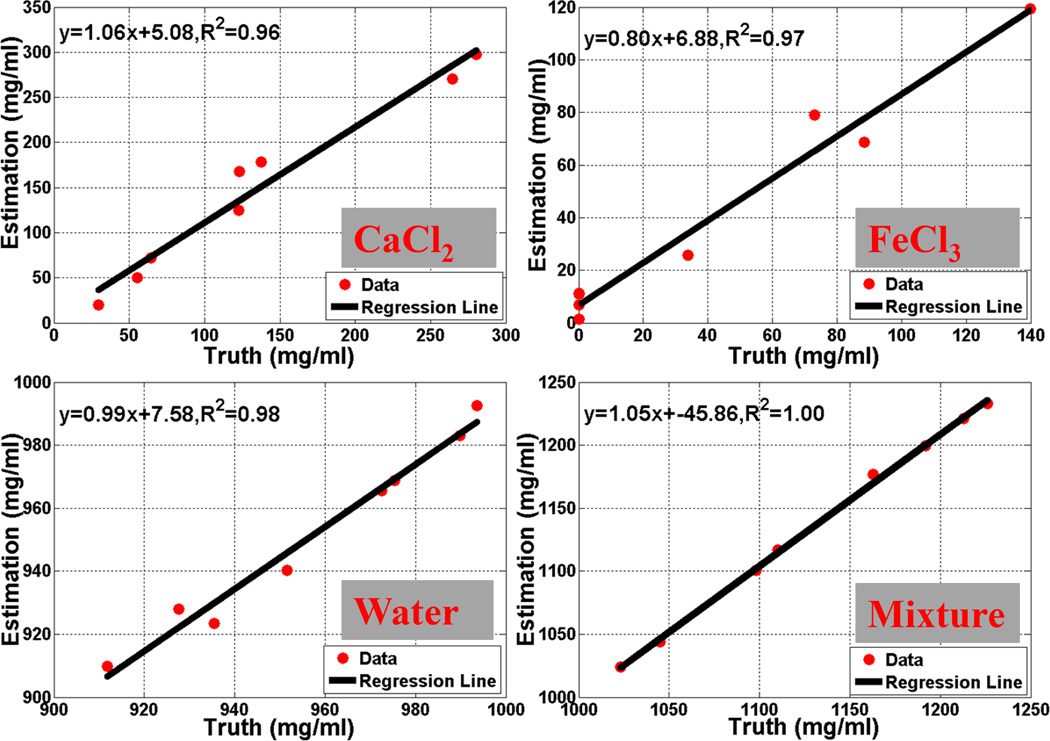
Regression analysis of the known concentration values vs. estimated concentration values demonstrated excellent agreement with R2 values of 0.96, 0.97, 0.98, and 1.00 for CaCl2, FeCl3, water and mixture densities, respectively, for configuration A (Figure 4).
Figure 4.
Regression analysis of the known density value vs. estimated values (configuration A).
The decomposition accuracy of the estimated basis material concentrations was evaluated by Root Mean Squared Error (RMSE). The result with a general volume constraint was superior to that achieved with use of an incorrect volume conservation assumption (Table 3, Row 2 and 3). These data demonstrated that the developed image-based material decomposition method can accurately quantify material concentration for three basis materials, as well as the overall mixture density, without any prior information about spectra or detector response, or the assumption of volume concentration.
Table 3.
RMSE of the estimated mass concentration values vs. the known mass concentration values (unit: mg/ml).
| Threshold Configuration | CaCl2 | FeCl3 | Water | Mixture |
|---|---|---|---|---|
| A with Erroneous Assumption of Volume Conservation | 34 | 24 | 39 | 46 |
| A | 32 | 20 | 11 | 13 |
| B | 33 | 22 | 18 | 22 |
| C | 32 | 22 | 25 | 29 |
| D | 33 | 28 | 83 | 94 |
The energy threshold configuration choice has a large impact on the material decomposition performance. With the same radiation dose, configuration A (Figure 3, top) performed much better than configuration D, as shown in the material specific images (Figure 3, bottom), as well as RSME calculation (Table 3). Configuration B yielded similar material decomposition results as configuration A, while configuration C performed better than configuration D but worse than configurations A and B. Hence the ranking of these threshold configurations on decomposition accuracy is: A>B>C>D.
The oCRLB calculation presented here may predict the trend of the influence of energy threshold configurations but does not precisely represent the noise or RMSE in material specific images. Our ongoing work is to include important factors relative to the physical system and reconstruction algorithm in the calculation to improve the accuracy of the material image noise estimation.
4. Conclusions/ New and Breakthrough Work
We have developed an image-based material decomposition method to practically and efficiently estimate basis material concentration from PCCT images. A general condition on volume constraint in a mixture was introduced that does not require an assumption on volume conservation. This work validated the proposed method in a phantom experiment on a prototype PCCT system, which demonstrated good agreement with the known mass concentration values. The effect of erroneously assuming volume conservation for solutions, and of energy threshold configuration choice, on accuracy of mass concentration estimates were demonstrated.
Table 1.
Basis material and mixture density for the solution samples used in this study
| Sample # | Ca | Fe | CaCl2 | FeCl3 | Water | Mixture |
|---|---|---|---|---|---|---|
| 1 | 95.48 | 0.00 | 264.39 | 0.00 | 927.60 | 1.19 |
| 2 | 44.30 | 0.00 | 122.68 | 0.00 | 975.32 | 1.10 |
| 3 | 19.91 | 0.00 | 55.13 | 0.00 | 989.87 | 1.05 |
| 4 | 10.62 | 0.00 | 29.40 | 0.00 | 993.59 | 1.02 |
| 5 | 101.29 | 11.63 | 280.47 | 33.77 | 911.75 | 1.23 |
| 6 | 49.70 | 48.16 | 137.63 | 139.89 | 935.47 | 1.21 |
| 7 | 44.41 | 30.47 | 122.98 | 88.49 | 951.53 | 1.16 |
| 8 | 23.24 | 25.18 | 64.34 | 73.13 | 972.52 | 1.11 |
| 9 | 0.00 | 42.31 | 0.00 | 122.89 | 982.11 | 1.11 |
| 10 | 0.00 | 23.38 | 0.00 | 67.91 | 992.09 | 1.06 |
| 11 | 0.00 | 12.59 | 0.00 | 36.57 | 1000.43 | 1.04 |
| 12 | 0.00 | 8.07 | 0.00 | 23.43 | 1003.56 | 1.03 |
ACKNOWLEDGMENTS
Research reported in this publication was supported by The National Institute of Biomedical Imaging and Bioengineering of the National Institutes of Health under award number R01EB016966, and in collaboration with Siemens Healthcare. The content is solely the responsibility of the authors and does not necessarily represent the official views of the National Institutes of Health. The scanner and algorithm discussed here are prototypes and not commercially available. The authors sincerely thank to Drs. Steffen Kappler, Friederike Schoeck, Ahmed Halaweish, and Katharine Grant for their assistance in data acquisition.
REFERENCES
- 1.Taguchi K, Iwanczyk JS. Vision 20/20: Single photon counting x-ray detectors in medical imaging. Medical physics. 2013;40(10):100901. doi: 10.1118/1.4820371. [DOI] [PMC free article] [PubMed] [Google Scholar]
- 2.Wang X, Meier D, Taguchi K, et al. Material separation in x-ray CT with energy resolved photon-counting detectors. Medical physics. 2011;38(3):1534–1546. doi: 10.1118/1.3553401. [DOI] [PMC free article] [PubMed] [Google Scholar]
- 3.Ronaldson JP, Zainon R, Scott NJ, et al. Toward quantifying the composition of soft tissues by spectral CT with Medipix3. Medical physics. 2012;39(11):6847–6857. doi: 10.1118/1.4760773. [DOI] [PubMed] [Google Scholar]
- 4.Malusek A, Karlsson M, Magnusson M, et al. The potential of dual-energy computed tomography for quantitative decomposition of soft tissues to water, protein and lipid in brachytherapy. Physics in medicine and biology. 2013;58(4):771–785. doi: 10.1088/0031-9155/58/4/771. [DOI] [PubMed] [Google Scholar]
- 5.Hassler U, Garnero L, Rizo P. X-ray dual-energy calibration based on estimated spectral properties of the experimental system. Ieee Transactions on Nuclear Science. 1998;45(3):1699–1712. [Google Scholar]
- 6.Alvarez RE. Estimator for photon counting energy selective x-ray imaging with multibin pulse height analysis. Medical physics. 2011;38(5):2324–2334. doi: 10.1118/1.3570658. [DOI] [PMC free article] [PubMed] [Google Scholar]
- 7.Li Z, Leng S, Yu L, et al. TU-F-18A-04: Use of An Image-Based Material-Decomposition Algorithm for Multi-Energy CT to Determine Basis Material Densities. Medical physics. 2014;41(6):476–476. [Google Scholar]
- 8.Liu X, Primak AN, Yu L, et al. Quantitative imaging of chemical composition using dual-energy, dual-source CT. 6913 69134Z-69134Z-8. [Google Scholar]
- 9.Wang J, Garg N, Duan X, et al. Quantification of iron in the presence of calcium with dual-energy computed tomography (DECT) in an ex vivo porcine plaque model. Physics in medicine and biology. 2011;56(22):7305–7316. doi: 10.1088/0031-9155/56/22/019. [DOI] [PubMed] [Google Scholar]
- 10.Gomori JM, Horev G, Tamary H, et al. Hepatic iron overload: quantitative MR imaging. Radiology. 1991;179(2):367–369. doi: 10.1148/radiology.179.2.2014276. [DOI] [PubMed] [Google Scholar]
- 11.Carr JJ. Detection and Quantification of Calcified Coronary Plaque With Multidetector-Row CT. Humana Press; 2005. [Google Scholar]
- 12.Alvarez RE, Macovski A. Energy-Selective Reconstructions in X-Ray Computerized Tomography. Physics in medicine and biology. 1976;21(5):733–744. doi: 10.1088/0031-9155/21/5/002. [DOI] [PubMed] [Google Scholar]
- 13.Roessl E, Herrmann C. Cramer-Rao lower bound of basis image noise in multiple-energy x-ray imaging. Physics in medicine and biology. 2009;54(5):1307–1318. doi: 10.1088/0031-9155/54/5/014. [DOI] [PubMed] [Google Scholar]
- 14.Li Z, Yu L, Trzasko JD, et al. Adaptive nonlocal means filtering based on local noise level for CT denoising. Medical Physics. 2014;41(1):011908. doi: 10.1118/1.4851635. [DOI] [PubMed] [Google Scholar]
- 15.Kappler S, Hannemann T, Kraft E, et al. First results from a hybrid prototype CT scanner for exploring benefits of quantum-counting in clinical CT. 8313 83130X-83130X-11. [Google Scholar]


