Abstract
Adult bone diseases, especially osteoporosis, lead to increased risk of fracture which in turn is associated with substantial morbidity, mortality, and financial costs. Clinically, osteoporosis is defined by low bone mineral density; however, increasing evidence suggests that the microarchitectural quality of trabecular bone (TB) is an important determinant of bone strength and fracture risk. Accurate measures of TB thickness and marrow spacing is of significant interest for early diagnosis of osteoporosis or treatment effects. Here, we present a new robust algorithm for computing TB thickness and marrow spacing at a low resolution achievable in vivo. The method uses a star-line tracing technique that effectively deals with partial voluming effects of in vivo imaging with voxel size comparable to TB thickness. Also, the method avoids the problem of digitization associated with conventional algorithms based on sampling distance transform along skeletons. Accuracy of the method was examined using computer-generated phantom images, while the robustness of the method was evaluated on human ankle specimens in terms of stability across a wide range of voxel sizes, repeat scan reproducibility under in vivo conditions, and correlation between thickness values computed at ex vivo and in vivo imaging resolutions. Also, the sensitivity of the method was examined by evaluating its ability to predict the bone strength of cadaveric specimens. Finally, the method was evaluated in a human study involving 40 healthy young-adult volunteers (age: 19–21 years; 20 males and 20 females) and ten athletes (age: 19–21 years; six males and four females). Across a wide range of voxel sizes, the new method is significantly more accurate and robust as compared to conventional methods. Both TB thickness and marrow spacing measures computed using the new method demonstrated strong associations (R2 ∈ [0.83, 0.87]) with bone strength. Also, the TB thickness and marrow spacing measures allowed discrimination between male and female volunteers (p ∈ [0.01, 0.04]) as well as between athletes and nonathletes (p ∈ [0.005, 0.03]).
Index Terms: Bone biomechanics, marrow spacing, multirow detector computed tomography (CT), star-line tracing, trabecular bone (TB) thickness
I. Introduction
Adult bone diseases, especially osteoporosis, lead to increased risk of fracture associated with substantial morbidity, mortality, and financial costs [1]. Approximately, 30% of postmenopausal white women in the U.S. suffer from osteoporosis [2] and the prevalence in Europe and Asia is similar. Clinically, osteoporosis is defined by low bone mineral density (BMD) [1]. However, increasing evidence suggests that microarchitectural quality of trabecular bone (TB) is an important determinant of bone strength and fracture risk [3]–[11]. Trabecular (or spongy) bone forms a dense network of bone plates and rods and it dominates in the vertebrae and at locations near the joints of long bones (metaphysis and epiphysis). Bone atrophy as it occurs in osteoporosis leads to either homogeneous or heterogeneous thinning of the trabecular elements. Besides changes in TB network connectivity and topology, TB thickness and marrow spacing between trabeculae play critical roles in determining the mechanical competence of bone and thus resistance to osteoporotic fractures [10]. Chung et al. [12] performed an experiment on 22 cadaveric specimens of lumbar vertebrae. They found that, with similar trabecular plate density, the specimens with lower mean trabecular thickness showed low bone strength, indicating the relationship between TB thickness and strength. Kleerekoper et al. [5] observed a correlation between TB strength and plate thickness. In a histologic study involving 78 normal subjects, 100 patients with vertebral fracture, and 50 patients with hip fracture, Parfitt et al. [11] observed reduced TB thickness in the fracture group as compared to the normal subjects. Several studies have revealed the relationship between aging and TB thickness. In a histologic study of lumbar vertebral specimens from 23 normal individuals, Mosekilde [13] observed that aging is associated with a steady decrease in mean thickness in horizontal trabeculae and a threefold increase in horizontal marrow spacing. In a cadaveric forearm study (N = 21), Spadaro et al. [14] observed that both cortical and TB thickness are correlated with mechanical bone strength.
The classical approach of measuring trabecular thickness is based on histomorphometry of transiliac bone biopsies [15]. The emergence of imaging technologies such as micro-computed tomography (μ-CT) [16] enables reconstruction of high-resolution 3-D images calling for more elaborate techniques for computing TB thickness. Recently, in vivo imaging techniques including magnetic resonance imaging (MRI) [17], [18], high-resolution peripheral quantitative CT (HR-pQCT) [19]–[21], and multirow detector CT (MD-CT) [22]–[24] have emerged as promising modalities for high-quality TB imaging at peripheral sites that avoid the problems of invasive bone biopsies. Therefore, an accurate and robust algorithm for computing TB thickness and marrow spacing that is applicable to in vivo imaging would be useful as an effective indicator of quantitative bone quality for clinical trials designed to evaluate fracture risks under different clinical conditions. Here, we present such an algorithm and evaluate its accuracy, robustness, and sensitivity to bone strength. Although, in this paper, the method is applied and evaluated on MD-CT imaging, it may be adapted for other in vivo 3-D imaging modalities including MRI and HR-pQCT. Also, the method may be applicable to other in vivo medical imaging applications such as pulmonary airway wall [25] and vascular thickness [26], [27].
Several methods for computing TB thickness and marrow spacing have been reported [28]–[32]. Following Hildebrand and Räegsegger [28], thickness at a given point is the diameter of the largest inscribed sphere containing that point. A discrete implementation of this definition using chamfer distances was presented in [32]. The star-volume [30], [31] algorithm has been applied to compute TB marrow spacing. Essentially, it determines the object volume seen unobscured from a given point and, finally, computes the average of this measure over a target volume. This approach is well suited for high-resolution images that can easily be segmented. However, it is bound to fail when significant partial voluming is presented in a target object. Saha and Wehrli [29] overcame this issue of partial voluming in TB thickness computation at low resolution by introducing the use of the fuzzy distance transform (FDT). However, this method fails to fully account for digitization errors in local thickness computation.
Here, we introduce a star-line-based algorithm for an accurate and robust measure of TB thickness and marrow spacing at in vivo resolution in the presence of significant partial voluming. Accuracy of the method was examined on computer-generated phantoms. Robustness of the method was evaluated on human specimens in terms of stability across a wide range of voxel sizes, repeat scan reproducibility under in vivo conditions, and correlation between thickness values computed at ex vivo and in vivo imaging resolutions. Also, the sensitivity of the method was examined by its ability to predict bone strength of cadaveric specimens. Finally, the method was evaluated in a sample of young adult volunteers with tibial scans.
II. Theory and Algorithms
The new method for thickness computation of the fuzzy digital objects interprets fuzzy membership value at a given image voxel as the partial occupancy of the object or the local object material density. Although, the method is designed for fuzzy digital objects at low resolution, its premise is built on objects in the continuous space. First, we establish a definition of “local thickness” in the continuous space, and then, we describe an effective algorithm for digital objects.
A. Definition of Local Thickness
Let R3 denote the continuous 3-D space and let O ⊂ R3 be an object. A ball ℬ ⊂ O is a maximally included ball (MIB) in O, if there exists no other ball ℬ′ ⊂ O that contains ℬ. Obviously, at a given point p ∈ O, the local thickness should be related to the diameters of the MIBs containing p [28]. However, the challenge emerges from the fact that a point p is contained by multiple MIBs and the question is which specific MIB should be used to define the thickness at p. First, consider the axial points of O. A point a ∈ O is an axial point in O if and only if there is a MIB in O whose center is a. Following the fact that the MIB ℬO (a) centered at an axial point a is unique and symmetrically defines the extent of the local structure on both sides of the axis, ℬO (a) is the natural choice for defining the thickness at a. Therefore, a proper choice of local thickness should satisfy the following property:
Property 1
For any object O ⊂ R3 and any axial point a ∈ O, the thickness of O at a is the length of the diameter of the unique MIB ℬO (a) centered at a.
Property 1 is important as it provides the necessary and sufficient condition for reconstruction of an object from its thickness distribution at axial points. Now, let us examine different possible options of defining local thickness at a nonaxial point p ∈ O; letℳO (p) denote the set of all MIBs in O containing p. Hildebrand and Rüegsegger [28] used the largest ball inℳO (p) to define the thickness at p which was further studied by Moreno et al. [34]. Another variation of this choice is to select the diameter of the smallest ball inℳO (p). We will refer to these options as the largest and smallest MIB options. Both of these options fail to satisfy Property 1 as illustrated in Fig. 1(a) and (b). Also, we examine the behavior of these options for an object formed by two overlapping disks of different scales and the results are shown in Fig. 2(a) and (b). The largest MIB option shows thickness bias toward the larger disk, while the smallest MIB option picks the same artifact, but in the opposite direction. Thus, both the largest and the smallest MIB options suffer from serious drawbacks. Here, we introduce the idea of selecting the MIB for thickness definition at a given point p based on the distance between p and the center or the circumference of a MIB.
Fig. 1.
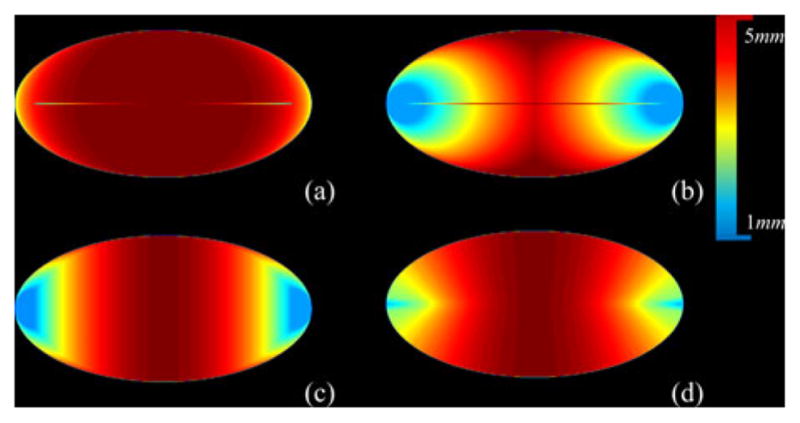
Comparison among different definitions of thickness in terms of satisfying Property 1. The color bar is added where the thickness values are shown in millimeter units. (a) Local thickness distribution on an ellipse using the largest MIB option except that the intensity at an axial point is enforced as the diameter of the MIB centered at that point. (b)–(d) Same as (a) but using the options of smallest MIB (b), nearest MIB center (c), and farthest MIB circumference (d). Axial lines are partially visible in (a) and (b) confirming the failure of the first two thickness options to satisfy Property 1. The axial lines in (c) and (d) are not visible indicating that both the nearest MIB center and the farthest MIB circumference options satisfy Property 1.
Fig. 2.
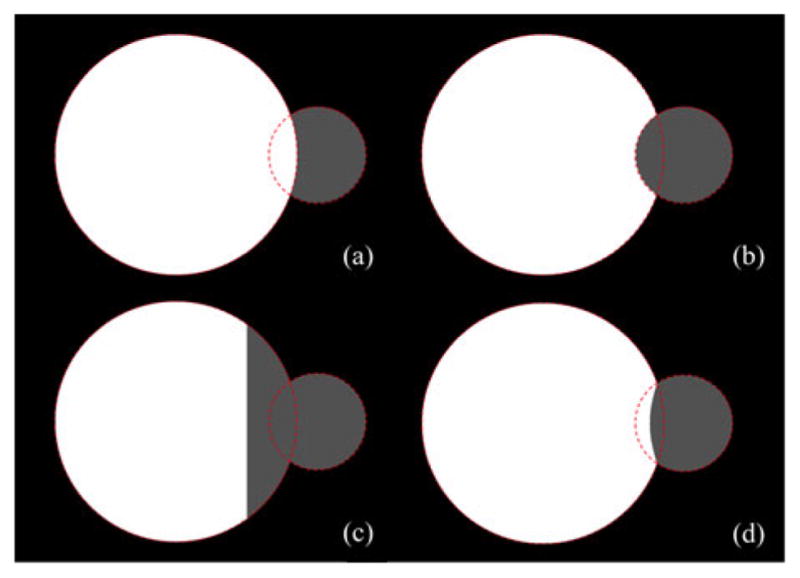
Comparison among different definitions of thickness in terms of their performance for two overlapping disks of different scales. Disk boundaries are shown by dotted lines. (a) Local thickness distribution using the largest MIB option. Here, the thickness of the larger ball gets higher preference and it enters inside the smaller ball. (b) Same as (a) but for the smallest MIB option; here, the artifact is opposite to that of (a). (c) Same as (a) but using the MIB with the nearest center. The failure of this option is obvious. (d) Same as (a) but using the MIB with the farthest circumference. A major advantage of this option is that it impartially divides the intersecting regions between the two balls eliminating bias artifacts.
Liu et al. [35] defined the thickness at the given point p as the diameter of the MIB in ℳO (p) whose center is closest to p. Although the method satisfies Property 1 [see Fig. 1(c)], its performance for two intersecting balls is seriously flawed [see Fig. 2(c)]. Here, we propose the following definition of thickness which satisfies Property 1 [see Fig. 1(d)] and produces an unbiased thickness distribution for two overlapping balls of different scales [see Fig. 2(d)].
Definition 1
For any object O ⊂ R3 and any point p ∈ O, the thickness of O at p, denoted as τO (p), is the length of the diameter of the MIB inℳO (p), whose circumference is farthest from p.
It can be shown that, for any object O ⊂ R3 and a point p ∈ O, the MIB in ℳO (p) whose circumference is farthest is unique. Therefore, Definition 1 produces a unique thickness distribution for any object.
B. Thickness Computation for Fuzzy Digital Objects
The proposed thickness computation algorithm for fuzzy digital objects is summarized in three steps:
Step 1: Computation of the surface skeleton A of a fuzzy digital object
 .
.Step 2: Computation of thickness τ
 (a) at all the axial voxels a ∈ A.
Step 3: Inheritance of thickness τ
 (p) at all the nonskeletal voxels p ∈ O – A following Definition 1.
Step 1 is accomplished using the surface skeletonization algorithm [38] that is applied on the support of the target fuzzy object. We will use A to denote the set of axial voxels or the skeleton of an object. In conventional algorithms [28], [29], local thickness at an axial voxel is determined by sampling the distance transform (DT) [37] at that voxel. Such methods work fine when the relative image resolution is high, but its performance may be suboptimal when image resolution is comparable to object thickness. This effect is reduced by using the FDT [29] instead of the binary DT.
Here, a brief outline of the FDT-based local thickness computation method [29] is presented. Let  = {(p, f
 (p)|p ∈ Z3} be a fuzzy digital object; f
 : Z3
→ [0, 1] be the membership function; O = {p|f
 (p) ≠ = 0} be the support; and Ō = Z3 – O be the background. Let FDT(p) denote the fuzzy distance of a voxel p ∈ O from the background Ō. FDT(p) provides the depth measure of a voxel p in a fuzzy object. The principle of the FDT-based thickness computation is to sample depth values at axial voxels. It uses binary skeletonization [38]–[40] to compute the set A of axial voxels. FDT-based mean thickness THFDT(
 ) is computed as the average of twice the FDT values at axial voxels, i.e.,
| (1) |
where | · | is the voxel count in a set.
The above method of thickness computation suffers from a random negative error caused by digitization of axial voxels. The magnitude of this error is bounded by the interval [0, ], where Δ is the voxel size. Saha and Wehrli [29] (see [29, Fig. 1]) proposed a voxel size-dependent global compensation factor, which was derived under several assumptions on structural anisotropy. However, it is difficult to correct local thickness measures at the voxel level using this approach. Further, it makes several assumptions on structural anisotropy which may not be universally applicable. Therefore, it is of paramount interest to develop a method that avoids digitization errors while computing thickness at individual axial voxels.
Here, an intercept-based algorithm is introduced for computing thickness at axial voxels that overcomes the digitization error. Let us consider a voxel p ∈ O in a fuzzy object  ; an intercept of
  at p along a direction (polar: θ, azimuth: ϕ) is the membership-weighted length of the straight line segment lθ,ϕ (p,
 ) passing through p with the two ends coinciding with the boundary of O. It should be noted that, for a voxel p ∈ O, there can be many intercepts of
  passing through p. Let Π
 (p) denote the set of all possible intercepts of
  that pass through p. The thickness measure τ
 (a) at an axial voxel a is approximately equal to the length of the shortest intercept of
  passing through a, i.e.,
| (2) |
where π(l) denotes the intercept length of l. The above equation offers a new algorithm for thickness computation at axial voxels. Major advantages of this approach are that 1) the minimum-intercept length measure is highly robust under small random shifts of axial voxels, and 2) partial voluming effects are efficiently handled during intercept length computation.
Here, we analytically discuss the relevance of the digitization error in the FDT-based and the new thickness computation methods. The FDT-based approach assumes that an axial voxel where the FDT value is sampled coincides with the true axis of the object and any difference between the two directly contributes to thickness error. In case of the intercept-based approach, the true axis of an object always orthogonally intersects a minimum intercept line. Therefore, even when an axial voxel deviates from the true axis, the error caused by the intercept approach is minimized. To further explain, let us consider a simple 2-D example of Fig. 3. Consider the material density values at different object pixels as 0.30 (dark gray), 0.70 (light gray), and 1.0 (white). Clearly, the thickness values for the structures in (a) and (b) are 4 and 5 pixels, respectively. For both the FDT-based and the proposed methods, thickness values are sampled at axial pixels. For (a), the axial voxels form a digital line along one of the two rows of white pixels, say, the upper row as marked by dots. Consider the skeletal pixel where star-lines are drawn. The FDT-based method will assign a thickness value of 3 pixels. Now consider the new intercept-based approach. Although the sample pixel fails to coincide with the true axis, the minimum intercept line (bold) produces the correct thickness value as the true axis transects the minimum intercept. Finally, this behavior of the FDT-based method is not consistent; for example, it produces the correct thickness value for the structure of (b), and therefore, a uniform compensation may not work to correct for this digitization error. These claims are thoroughly examined and the experimental results are presented in Section IV. Here, it is worth mentioning that, for any compact object in R2 or R3, a minimum intercept line always passes through a unique axial point as it orthogonally intersects the medial axis. However, such a claim may not be made for a digital object and it may be possible to construct an example where a minimum intercept line passes through multiple axial voxels.
Fig. 3.
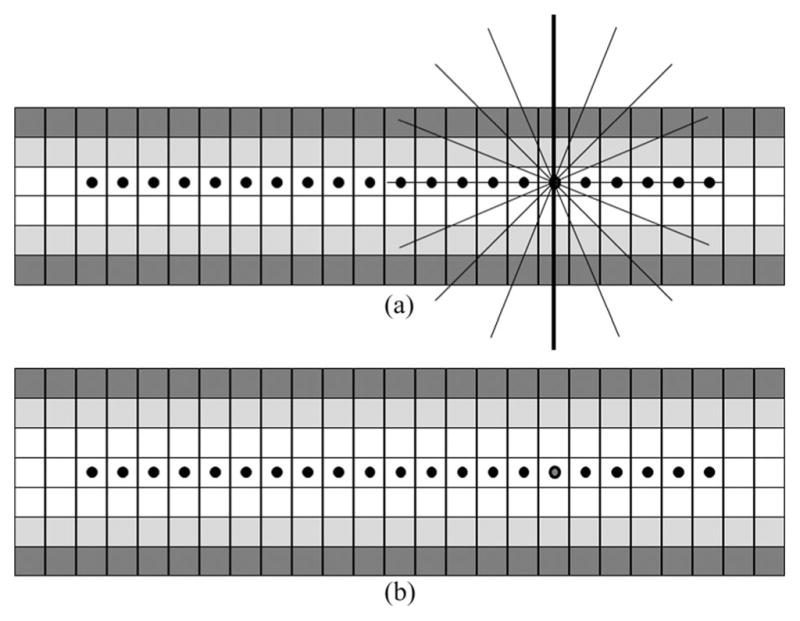
Advantages of intercept-based thickness computation in reducing digitization errors as compared to the FDT-based method.
The star-line-based thickness computation algorithm (see Fig. 4) determines the term minl∈Π ( a) π(l) at axial voxels. It locally traces an object along m pairs of mutually opposite sample lines emanating from an axial voxel a (black dot in Fig. 4). These sample lines are selected at a pseudouniform distribution over the entire 3-D angular space [33]. A parameter ψ is used to define the angular separation between neighboring sample lines. The optimum value of ψ was experimentally determined and used for all experiments (see Section III). A sample line along a direction 〈θ, ϕ〉 is represented as a sequence of points
, for i = 0, 1, 2, . . ., where iθϕ is a unit vector along direction 〈θ, ϕ〉; the opposite sample line is represented by a sequence of points i × δ ×
iθϕ, for i = 0, –1, –2, . . .. Following the arguments by Saha [33] on the basis of the Nyquist theorem, the sample interval δ is set to one-half the smallest dimension of a voxel. At an axial voxel a and a given direction 〈θ, ϕ〉, the local intercept length πθ,ϕ(a) of the target object is determined as follows:
| (3) |
where and are the first sample points, on the respective sample lines, that fall out of the support O of the fuzzy object. The local extent of the object along each sample line is recorded (hollow dots in Fig. 4). The thickness at the axial voxel a is computed as the shortest (solid line segment in Fig. 4) among the m different object intercept lengths along different sample line directions.
Fig. 4.
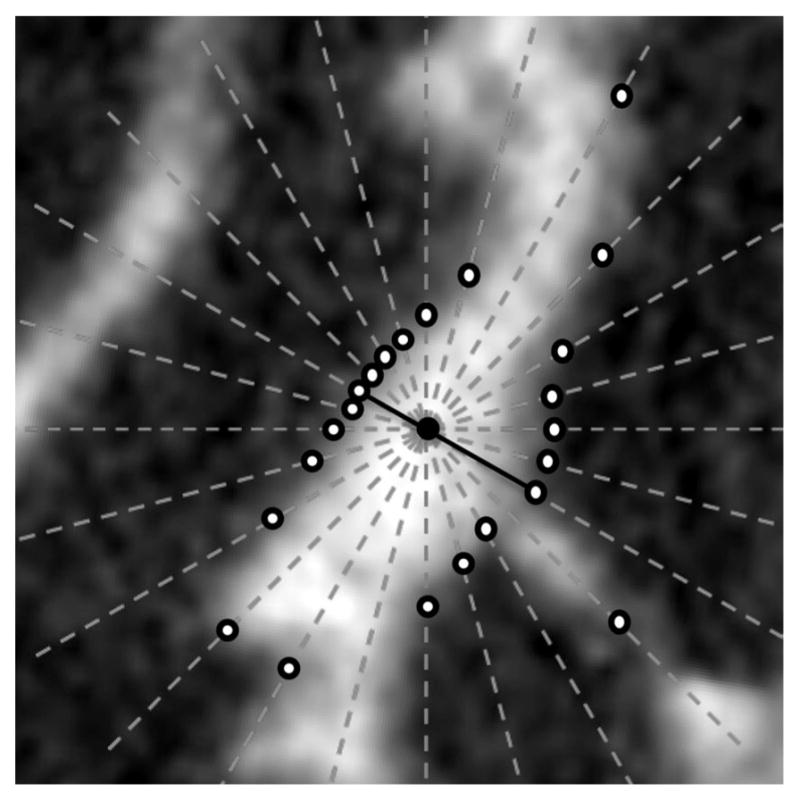
Illustration of star-line-based TB thickness computation in two-dimensions. The candidate voxel (black dot), star-lines (dot), edge locations (hollow dots), and shortest intercept (solid line) in TB thickness computation are shown.
Algorithm 1.
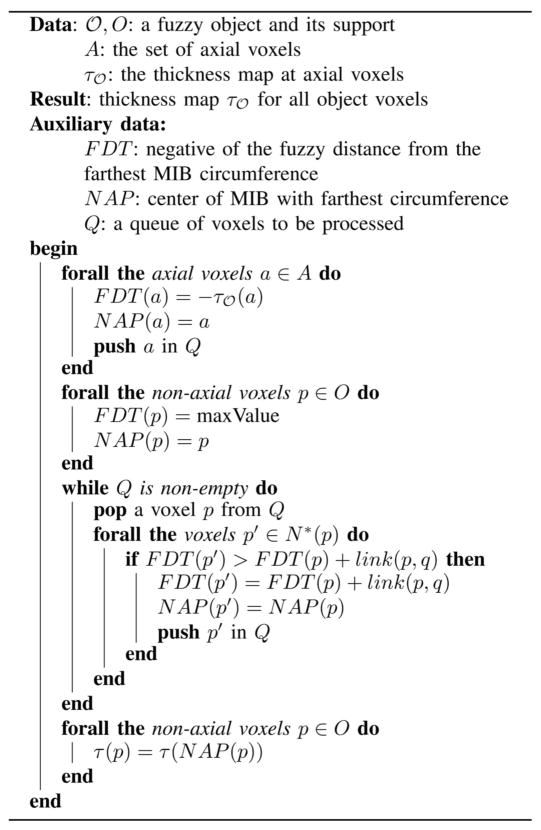
thickness-inheritance-from-axial-voxels
|
Prior to describing Step 3, it is worth mentioning that the idea of sampling the thickness values at axial voxels of an object was proposed earlier [29] and, in this context, the novelty of the current method lies in the process of computing local thickness at individual axial voxels. Although star-line-based approaches have been used previously [30], [31], [33], [36], their application to computing minimum intercept length as local thickness is novel. Vesterby et al. [30] and Croucher et al. [31] used the star-line approach to compute star-volume of TB pores, which is a different measure than structure thickness or spacing. To describe the process in Step 3, let a ∈ O be an axial voxel and let p ∈ O be a nonaxial voxel. The distance of p from the circumference of the MIB
 (a) centered at the axial voxel a is essentially equal to
 (a) –
(a) –
 (a, p), where the
 (a, p) is the fuzzy distance between a and p in
 . Let A denote the set of axial voxels or the skeleton of
 . Therefore, following Definition 1, p inherits the thickness from an axial voxel a in A for which the measure
 (a) –
(a) –
 (a, p) is maximized. Essentially, Algorithm 1 solves the following equation:
| (4) |
In Algorithm 1, N *(p) is the excluded neighborhood [43] of a voxel p and
. It should be noted that, the algorithm solves (4) through a dynamic programming approach [42] and the corresponding axial voxel a is recorded in N AP which eventually determines the inheritance of the thickness value
 (p) at a nonaxial voxel p.
III. Experimental Plans and Methods
An application of the proposed algorithm for computation of TB thickness and marrow spacing by in vivo MD-CT imaging of a human distal tibia was investigated. The experimental study was designed to evaluate the following performance indices: 1) accuracy; 2) stability of local thickness values under random local shifts in axial voxels; 3) stability of local thickness values across a wide range of image voxel sizes; 4) stability of thickness values under a major shift in “true” image resolution using ex vivo and in vivo imaging modalities; 5) repeat scan reproducibility; 6) ability of TB thickness and marrow spacing to predict bone strength; and 7) application to in vivo studies. Computer-generated phantoms were used for Experiment 1, while μ-CT images of cadaveric ankle specimens were used for Experiments 2–4. MD-CT imaging of the same specimens were used for Experiments 4–6. For Experiment 6, bone strength of cadaveric specimens was determined by mechanical testing. Experiment 7 involved MD-CT scans of distal tibia in a human pilot study. The following sequence of steps was applied to each specimen: 1) MD-CT imaging; 2) removal of soft tissue and dislodgement of the distal tibia from the ankle joint; 3) μ-CT imaging; 4) specimen preparation and TB core extraction; and 5) mechanical testing to compute compressive Young’s modulus and yield stress.
Here, it is important to clarify the difference between Experiments 3 and 4. The purpose of Experiment 3 was to examine a method’s performance under digitization at varying voxel size. On the other hand, Experiment 4 examined a method’s performance under a major shift in true image resolution defined by the modulation transfer function (MTF) of an imaging technique. Assuming that the thickness computation using μ-CT at high resolution is quite accurate, this experiment examined the meaningfulness of thickness computation using the current method and an in vivo imaging technique. In the rest of this paper, voxel size or digitization will refer to downsampling effects while resolution will symbolize the effects of the MTF on an imaging technique.
A. Bone Volume Fraction and Volume Fraction Image Computation
To compute trabecular thickness, a fuzzy representation of TB is used where the membership value at a given p represents its bone volume fraction (BVF) denoted as BVF(p). For μ-CT images, BVF was directly computed from the raw CT data using the bimodal intensity distribution. MD-CT imaging acquires data in Hounsfield units and these numbers were first converted to BMD (mg/cc) measures using a calibration phantom. The INTable calibration phantom was used for all cadaveric specimen scans, while the Gammax calibration phantom was used for all human in vivo scans. Finally, a BMD image was converted to a BVF image using the following equation [45]:
| (5) |
Marrow space represents the marrow-filled region between trabeculae. Therefore, marrow spacing was computed from the marrow volume fraction image (MVF), derived as the inverse of the BVF image as follows:
| (6) |
Both BVF and MVF images were resampled using the windowed-sinc interpolation method producing 0.15-mm isotropic voxels.
B. TB Thickness and Marrow Spacing Measures
Computation of both trabecular thickness and marrow spacing was accomplished using the algorithm described in Section II-B. Specifically, the two TB measures, namely, TB thickness (THB ) and marrow spacing (SPM ), were computed over a target volume-of-interest (VOI) V as follows:
| (7) |
| (8) |
where VB (or VM ) is the set of voxels with nonzero BVF (respectively, MVF) in V. In addition to THB and SPM, the average BMD over V was computed as described in [24].
C. Optimum Angular Separation Parameter
As described in Section II-B, the value of the parameter ψ defining the angular separation between neighboring sample lines needs to be determined. A small value of ψ provides a more precise measure of star-line-based thickness at higher computation cost and the right choice of the parameter depends on the tradeoff. To understand the tradeoff between accuracy and computation cost, an experiment was conducted on in vivo MD-CT images of the distal tibia from ten human volunteers. The ideal measure of star-line-based local thickness distribution was determined at dense distribution of star-lines with ψ = 1°. At any other value of ψ, the mean and standard deviation of voxel-wise thickness errors were computed. The mean error was expressed as a percentage of the ideal mean thickness measure (see Fig. 5). Also, the computation time was expressed as a percentage of time required at one degree angular separation (see Fig. 5). An overall tradeoff measure was defined as the square root of the sum of squares of normalized error and computation time. The optimum tradeoff value was attained at the angular separation of 12°. Following the results of this experiment, for all experiments reported in this paper, we used 123 pairs of sample lines at an approximate angular separation of 12° between every two neighboring sample lines.
Fig. 5.
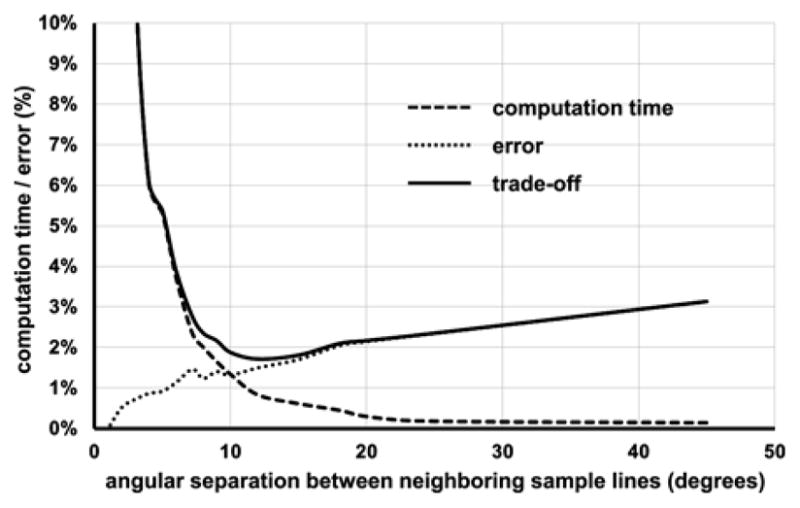
Tradeoff between computation time and error as a function of the parameter ψ defining the angular separation between neighboring sample lines for star-line-based computation of local thickness.
D. Computerized Phantoms With Known Truth
Binary phantoms with a known thickness distribution were generated at high resolution over an array of 512 × 512 × 512. The simulation began with an ideal skeleton in the continuous 3-D space R3 as a union of mathematical surfaces, e.g., sinusoidal, cylindrical, spherical, or elliptical surfaces and sinusoidal curves constituting different cross structures. The ideal skeleton was densely and quasi-uniformly sampled; let ST be the set of NT sampled points. A Euclidean DT [44] was computed from ST and DTT: Z3 → R+ denoted the DT map. To generate a binary volumetric object with nonuniform thickness, a smoothly varying thickness field, say fthickness: Z3 → R+, was generated using trilinear interpolation of independently chosen thickness values at a 25 × 25 × 25 array of control points. The number of control points represented the degrees of freedom in the simulated thickness field.
Finally, a volumetric object corresponding to the true skeleton ST was defined as the set of all voxels with its Euclidean distance DTT not exceeding the true local thickness fthickness. Six binary objects with true thickness distribution were generated; for example, see Fig. 6(a). Test phantom images were generated by downsampling binary phantoms at 3 × 3 × 3, 4 × 4 × 4, and 5 × 5× 5 voxels and by adding noise at signal-to-noise ratios (SNR) of 6, 12, and 24. Zero-mean white Gaussian noise was used for these phantoms and the SNR was defined as the variance of the noise; it may be noted that the true signal value at a fully occupied object voxel is 1. For the six phantoms used in the current experiment, the mean and standard deviation of thickness values at the original resolution were 30 ± 5 and the thickness values covered the range of [10], [50] voxels. After accounting for larger voxel size in the test phantom image, these thickness values at 5 × 5 × 5 downsampling were 6 ± 1 and the range was [2], [10].
Fig. 6.
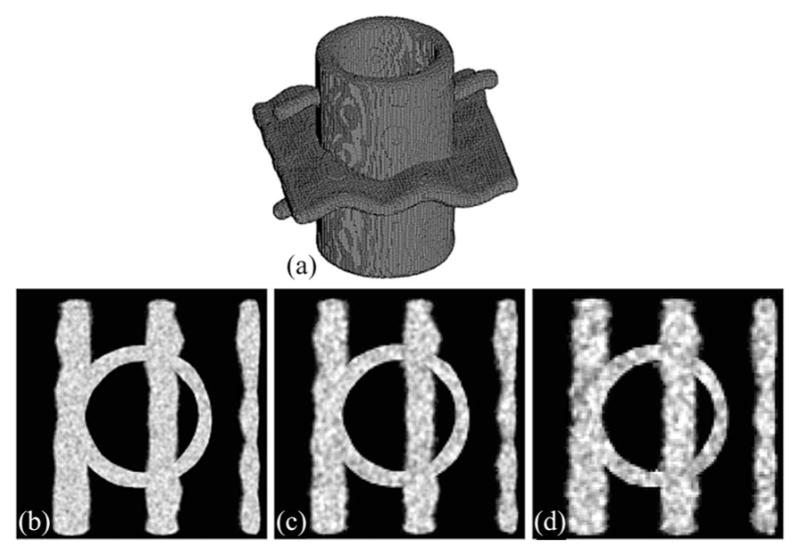
Computer generated phantom data at different levels of noise and downsampling. (a) Three-dimensional rendition of the true binary phantom. (b)–(d) Axial image slices of test phantoms at SNR values of 24, 12, and 6 and downsampling rates of three, four, and five voxels, respectively.
E. Cadaveric Specimens, MD-CT, and μ-CT Imaging
Fifteen fresh-frozen human cadaveric ankle specimens were obtained from 11 body donors (age: 55–91 years). Bodies were obtained under the Deeded Bodies Program, The University of Iowa, Iowa City, IA, USA, and the ankle specimens were removed at the mid-tibia region. Exclusion criteria for this study were evidence of previous fracture or knowledge of bone tumor or bone metastasis. These ankle specimens were kept frozen until the performance of MD-CT imaging.
High-resolution MD-CT scans of the distal tibia were acquired at the University of Iowa Comprehensive Lung Imaging Center on a 128-slice SOMATOM Definition Flash scanner (Siemens, Munich, Germany) using the following CT parameters: single tube spiral acquisition at 120 kV, 200 effective mAs, 1 sec rotation speed, pitch factor: 1.0, nominal collimation: 16 × 0.3 mm, scan length: 10 cm beginning at the distal tibia end-plateau, and total effective dose equivalent to 17 mrem (≈ 20 days of environmental radiation) in the USA. Images were reconstructed at 0.2-mm slice thickness and 0.2 × 0.2 in-plane resolution using a normal cone beam method with a special U70u kernel achieving high structural resolution. Following all MD-CT repeat scans, each specimen was further scanned on an Imtek Microcat II scanner at 28.5-μm isotropic resolution, after removing soft tissue and dislocating the tibia from the ankle joint.
F. Mechanical Testing and Determination of Bone Strength
To determine TB strength, a cylindrical TB core 8 mm in diameter and 20.9 ± 3.3 mm in length was cored from the distal tibia in situ along the proximal-distal direction. Each TB core was mechanically tested for compression using an electromechanical materials testing machine. To minimize specimen end effects, strain was measured with a 6-mm gauge length extensometer attached directly to the midsection of the bone. A compressive preload of 10 N was applied and strains were set to zero. At a strain rate of 0.005 s−1, each specimen was preconditioned to a low strain with at least ten cycles and then loaded to failure. Yield stress was determined as the intersection of the stress-strain curve and a 0.2% strain offset of the modulus.
G. VOI Selection for Cadaveric Image Analysis
The size and location of VOIs for image analysis of the cadaveric bone strength study (Experiment 6) were chosen as per the information recorded during specimen preparation for mechanical testing of individual specimens. First, the image was rotated to align the bone axis along the coordinate z-axis using the following two steps: 1) generation of a cylinder C with its axis lying on the coordinate z-axis and its cross-sectional area equating to the average tibial cross sectional area; and 2) reorientation of the tibial volume to align its axis with C by maximizing the overlap between the tibial volume and the cylinder C. After reorienting the bone image, a VOI cylinder of 8-mm diameter along the coordinate z-axis was generated and its proximal end was manually positioned at the center of the cortical rim using in-plane translation through a graphical user interface. The location of the distal end of the VOI cylinder in the slice direction and its length were determined as per the core location and length recorded during specimen preparation; the growth plate was visually located in the CT data of each specimen. Finally, the central 6-mm region from the cylinder was used as the VOI for the extensometer test; for the nonextensometer study, the length of the VOI was determined as per data collected during specimen preparation for the second mechanical test.
H. Human Volunteers for the In Vivo Study
In vivo MD-CT distal tibia bone scans were obtained for 20 healthy male (M) and 20 healthy female (F) volunteers 19 to 21 years of age from the ongoing Iowa Bone Development Study (IBDS). MD-CT scans were obtained on the left lower leg of each volunteer following the same CT protocol used for cadaveric specimens (see Section III-E). Each volunteer’s tibial length was determined by locating the distal and proximal tibial plateaus in the AP projection MD-CT scout scan of the entire tibia. Along with the healthy volunteers, six male (M) and four female (F) athletes 19 to 21 years of age were recruited and the same MD-CT bone scans were obtained.
I. VOI Selection for In Vivo Studies
The purpose of VOI computation for the in vivo pilot study was to adjust the VOI according to the individual-specific tibia length and width. The following protocol was adopted for this study: 1) determination of tibial sites for the VOI as the percentage of tibial length in reference to the distal end plateau; 2) reorientation of the tibial image to align its axis with the coordinate z-axis using the same method described in Section III-G for cadaveric specimens; 3) location of the distal end plateau in the MD-CT volume scan; and 4) determination of the VOI at the 5% tibial site covering 2% of the tibial length after applying a 45% peel on each cross-sectional slice.
IV. Results and Discussion
Results of TB thickness measures for three specimens with different bone strengths are illustrated in Fig. 7. As observed in the figure, an 8% difference in BMD from a strong bone (a) to a weak bone (c) leads to a 70% loss in bone strength and manifests as a 20% reduction in TB thickness and a 42% increase in marrow spacing. This observation supports that TB thickness and marrow spacing measures are highly sensitive to bone loss and, therefore, play a significant role in early detection of bone diseases.
Fig. 7.
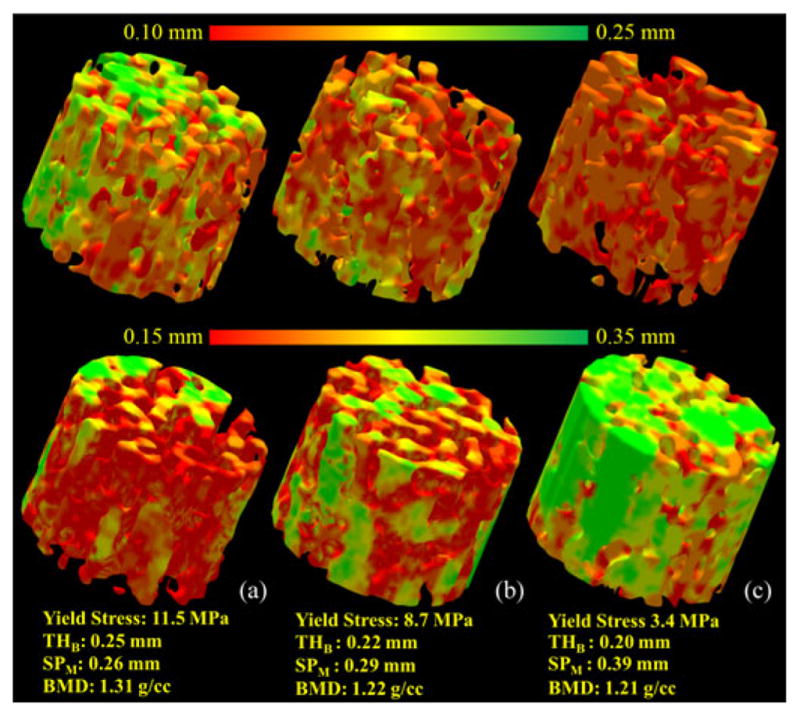
Illustration of the TB thickness and marrow spacing measures for three different TB specimens with distinctly different bone strengths : (a) strong (yield stress: 11.5 MPa), (b) moderate (7.1 MPa), and (c) weak (3.4 MPa).
A. Accuracy Analyses
To examine the accuracy of the method, an error function was defined using the known thickness field fthickness. Let Ol,σ denote the set of voxels with nonzero membership in a phantom image at the downsampling rate of l and the noise at SNR of σ, and let fcom puted,l,σ : Z3 → R+ be the computed thickness map. The thickness computation error was defined as follows:
| (9) |
Average errors using both the new and the FDT-based [29] methods for six phantoms are presented in Table I; the errors are shown in voxel size prior to downsampling. Thus, a mean error of 1.33 at a downsampling of 4 × 4 × 4 and an SNR of 12, essentially, represents an error of 0.46 in terms of the voxel size of the test phantom image. Compared to the FDT-based method, the new method produces smaller errors at all different combinations of noise and downsampling, and these differences are significant (two sample t-test p <0.001).
TABLE I.
Thickness Computation Errors on Phantoms at Different Levels of Downsampling and Noise
| Different down-sampling | Different methods | Different signal to noise rations | |||
|---|---|---|---|---|---|
| noise free | SNR 24 | SNR 12 | SNR 6 | ||
| 3 × 3 × 3 | New method | 1.04±0.15 | 1.17±0.22 | 1.37±0.29 | 1.53±0.20 |
| FDT-based | 1.29±0.25 | 1.53±0.37 | 1.74±0.35 | 2.18±0.33 | |
| 4 × 4 × 4 | New method | 1.19±0.17 | 1.31±0.16 | 1.62±0.24 | 1.76±0.20 |
| FDT-based | 1.51±0.37 | 1.78±0.47 | 1.98±0.47 | 2.38±0.45 | |
| 5 × 5 × 5 | New method | 1.22±0.20 | 1.59±0.14 | 1.82±0.20 | 2.01±0.20 |
| FDT-based | 2.34±0.10 | 2.56±0.09 | 2.71±0.09 | 2.98±0.15 | |
At each level of down sampling and noise the mean and standard deviation of voxel-by-voxel thickness computation errors over the entire object are presented. Errors are expressed in the voxel unit of the original high-resolution phantom image prior to down sampling.
B. Robustness Under Different Conditions
Three different experiments were undertaken to assess the robustness of the new method. The first experiment was designed to examine whether the new thickness computation algorithm is prone to the digitization error of axial voxels. For this purpose, each axial voxel was randomly replaced by one of its 3 × 3 × 3 neighbors, and then, Steps 2 and 3 of the thickness computation algorithm were followed. Two thickness values were computed at each object voxel: one using the originally computed axial voxels and the other derived after randomly moving axial voxels. The error was computed as the average of voxel-by-voxel absolute differences between these two thickness values. This error was normalized by the mean thickness value computed from the original axial voxels. The experiment was run on both μ-CT and MD-CT images of 15 ankle specimens. The mean and standard deviation of voxel-by-voxel errors of TB thickness computation for μ-CT images were 0.9% and 0.5%, respectively, and these numbers were 8% and 6%, respectively, for MD-CT images. It should be mentioned that 8% and 6% thickness computation errors at 150-μm resolution are equivalent to 0.12 and 0.09 voxel errors. Further, it should be mentioned that for MD-CT images, the error was reduced to 3% or 0.04 voxel when average thickness values over a VOI of 1 mm3 were used for error calculation.
To examine the method’s stability under digitization at different voxel sizes, the method was applied on ten μ-CT images each downsampled at six different voxel sizes. Specifically, μ-CT images of original isotropic voxel size of 28.5 μm were used and each image was down sampled at six larger isotropic voxel sizes of 57.0, 85.5, 114.0, 142.5, 171.0, and 199.5 μm, as shown in Fig. 8. Computed mean thickness values for different specimens at various voxel sizes are illustrated in Fig. 9(a). Thickness error for a specific μ-CT image at a given downsampled resolution was computed as the difference between mean thickness values computed from the downsampled and the original μ-CT voxel size. Finally, the average and standard deviation of thickness errors at a given voxel size were computed over the ten μ-CT images and the results are presented in Fig. 9(b). As observed in Fig. 9(b), despite a wide range of voxel sizes covering ex vivo to in vivo regimes, the average thickness error is only 4.3%. These results demonstrate that the new thickness computation method is highly stable across a wide range of voxel sizes. However, it must be clarified that the change in voxel size for this experiment was acquired by downsampling, and it does not reflect the behavior of the method under true loss of resolution due to change in imaging modalities, e.g., the effects of a larger MTF.
Fig. 8.
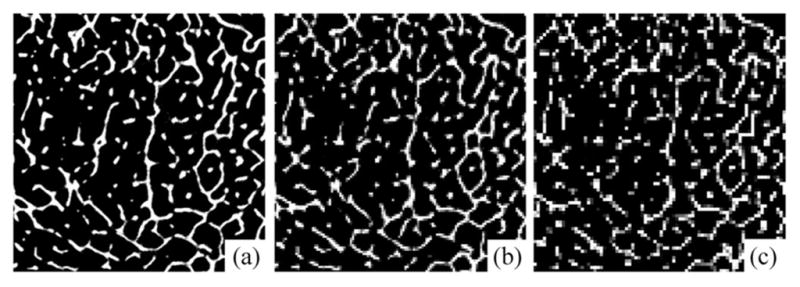
Illustration of a μ-CT image downsampled at different voxel sizes: (a) 28.5 μm, (b) 114.0 μm, and (c) 199.5 μm.
Fig. 9.

Illustration of stability of the new algorithm across a wide range of voxel sizes. (a) Mean thickness values over a matching VOI at different voxel sizes. Each curve represents the results for one specimen. (b) Mean and standard deviation of errors at different voxel sizes as computed based on data from ten specimens.
To examine the performance of the algorithm under true loss of resolution by different imaging modalities with widely different characteristics of MTF, the correlation of TB thickness computed from ex vivo μ-CT and in vivo MD-CT imaging was examined. The purpose of this experiment was different from the previous experiment. In the previous experiment, different voxel sizes were obtained computationally, and the results showed that the proposed algorithm produced highly stable measures of thickness across a wide range of voxel sizes. On the other hand, the current experiment was designed to examine the relationship between thickness values measured from images acquired using ex vivo and in vivo imaging modalities with widely different MTFs. Matching axial image slices from postregistered images of a cadaveric specimen using the two different modalities are presented in Fig. 10. As observed in the figure, the trabecular structures are thicker in MD-CT imaging due to a larger MTF. Therefore, it is unrealistic to expect that the two widely different imaging modalities will generate the same thickness value. Instead, the objective was to examine whether the thickness values measured by the proposed method using the two characteristically different modalities are tightly related or not. The linear correlations of TB thickness and marrow spacing computed from registered μ-CT and MD-CT images are presented in Fig. 11. The r values from a linear regression model of TB thickness and marrow spacing measures in two different modalities are 0.96 and 0.95, respectively, with slopes of 1.66 and 1.08, respectively. For both measures, the regression line passes near the origin. Thus, the results of this experiment reveal that the thickness values computed by the current method from two distinctly different modalities are not identical, but there is a strong association between their values.
Fig. 10.
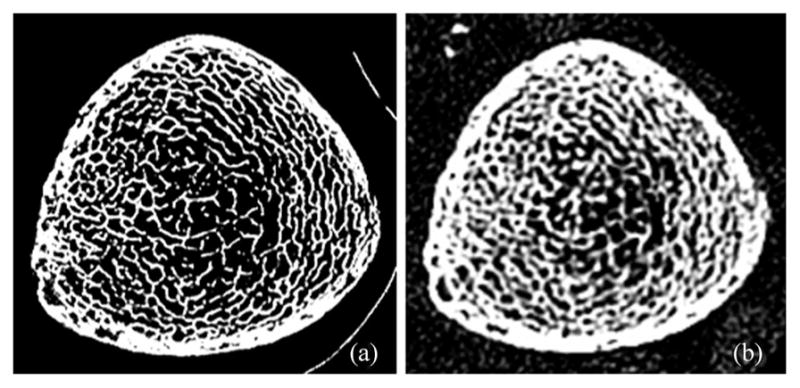
Illustration of a matching axial image slice from postregistered (a) μ-CT and (b) MD-CT images of a cadaveric specimen.
Fig. 11.
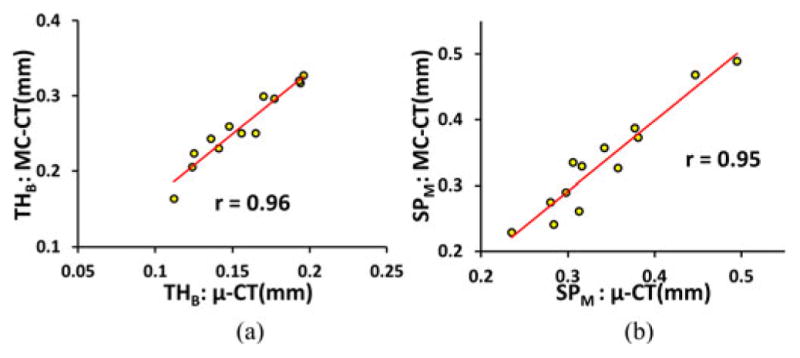
Illustration of the linear correlation of (a) TB thickness and (b) marrow spacing computed from postregistered μ-CT and MD-CT images.
C. Reproducibility Analysis
Three repeat MD-CT scans of 15 cadaveric ankle specimens were used to examine the method’s reproducibility. Fig. 12 illustrates a color-coded TB thickness map over a matching volume in two repeat MD-CT scans of the distal tibia. For quantitative analyses, ten spherical VOIs of the same radius were randomly selected in the first MD-CT scan of each specimen above the position 8-mm proximal to the distal endplate leading to a total of 150 VOIs. A postregistration algorithm was used to locate the matching VOIs in the second and third repeat scans. It is obvious that the result of reproducibility analysis depends on the scale of the VOI, with larger VOIs showing improved reproducibility. The relationship between the method’s reproducibility and VOI size is presented in Fig. 13. As can be seen in the figure, for the new method, at a VOI diameter of 3.45 mm or greater, the intraclass correlation coefficient (ICC) exceeds the value of 0.95 suggesting that the measure is highly reproducible for assessing regional bone alteration. For the conventional FDT-based approach, the VOI diameter has to reach 6.15 mm or greater to achieve equivalent performance in terms of the ICC.
Fig. 12.
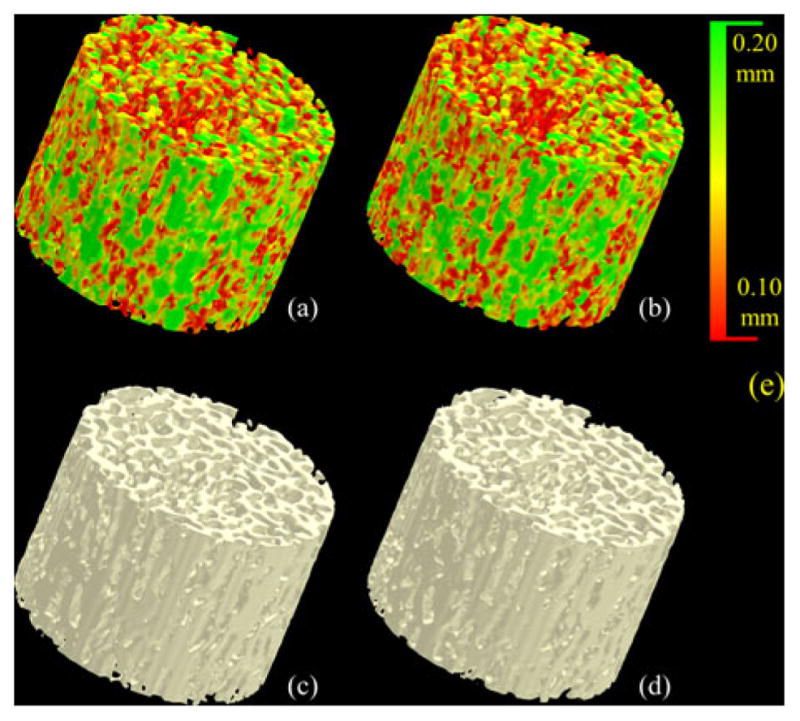
Illustration of reproducibility of the TB thickness measure under MD-CT repeat scans. (a) and (b) Color-coded TB thickness images. (c) and (d) TB image without color coding. (e) Color coding bar.
Fig. 13.
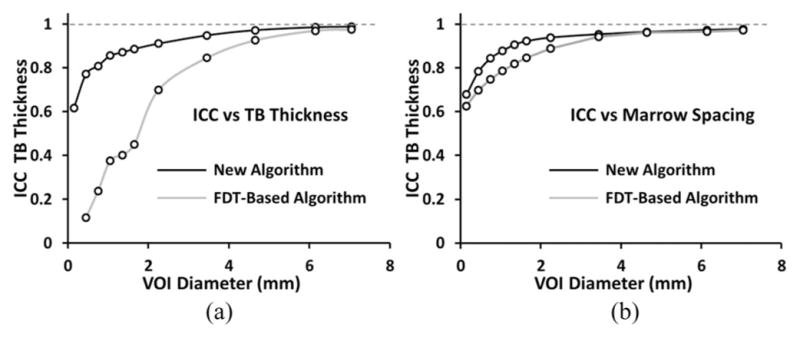
Illustration of repeat MD-CT scan ICC values as a function of VOI diameters for both the new and the FDT-based algorithms. As observed in (a), at a VOI diameter of 3.45 mm or greater, the ICC value for the new algorithm exceeds the mark of 0.95, while the FDT-based algorithm requires a VOI diameter of 6.15 mm or greater to reach to that mark.
D. Ability to Predict Bone Strength
The results of correlation analysis between Yield stress and each of the TB thickness and marrow spacing measures using the new method are shown in Fig. 14(a) and (b), while the results using the FDT-based algorithm are shown in Fig. 14(c) and (d). The values of R2 or coefficients of determination from the linear regression analysis between TB Young’s modulus and the different TB measures are presented in Table II. For both yield stress and Young’s modulus parameters, the TB thickness and marrow spacing measures computed using the new method have demonstrated superiority in predicting bone strength as compared to the FDT-based measures and MD-CT based volumetric BMD.
Fig. 14.
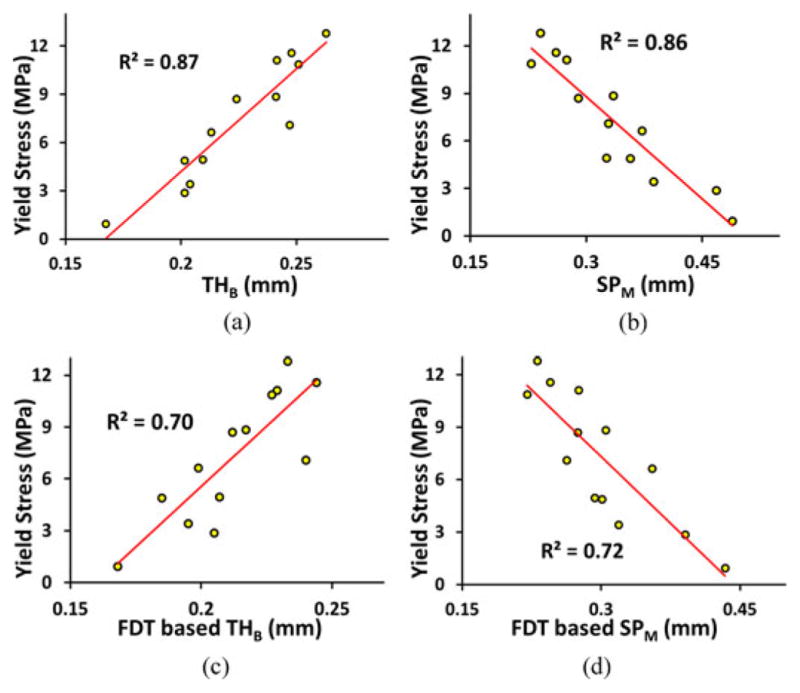
(a) and (b) Ability of TB thickness and marrow spacing measures computed by the method to predict experimental bone strength. The ability is computed in terms of the R2 of linear correlation between bone strength and the respective measure. (c) and (d) Same as (a) and (b) but for the FDT-based method.
TABLE II.
Results of Linear Regression Analysis (R2 Values) Between Different TB Measures and Experimental TB Strength Parameters
| Strength Parameters | New Method | FDT-based Method | BMD | ||
|---|---|---|---|---|---|
| THB | SPM | THB | SPM | ||
| Young’s Modulus | 0.83 | 0.85 | 0.61 | 0.74 | 0.78 |
| Yield Stress | 0.87 | 0.86 | 0.70 | 0.72 | 0.79 |
E. Results of In Vivo Pilot Studies
Twenty male and twenty female volunteers (19 to 21 years) were used to form body mass index (BMI) order-matched male–female pairs. The BMI was 26.89 ± 6.32 kg/m2 (mean±standard deviation) for males and 25.15 ± 7.96 kg/m2 for females, and r for the two ordered groups of BMIs was 0.98. The colored results for one male–female pair are shown in Fig. 15. Clearly, the results indicate that the male has thicker TB than the female. Quantitative results show that males on average have 6.7% thicker TB and 13.9% reduced marrow spacing as compared to females. Observed values for TB thickness and marrow spacing for males were 0.22 ± 0.02 and 0.32 ± 0.06 mm, respectively, and those measures observed for females were 0.19 ± 0.03 and 0.37 ± 0.10 mm (see Table III). Paired t-test results showed the differences were statistically significant (p < 0.03) for both TB thickness and marrow spacing. Using the FDT-based methods, males on average have 2.6% thicker TB and 12.3% reduced marrow spacing as compared to females, with p-values of 0.29 and 0.12 for TB thickness and marrow spacing, respectively.
Fig. 15.
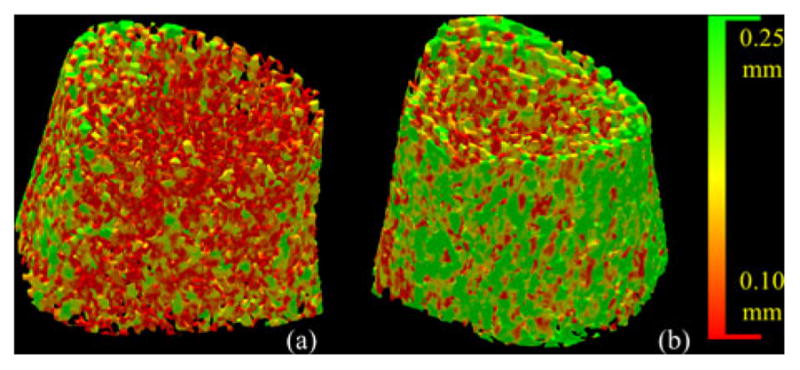
Color-coded illustration of TB thickness distribution using the new method for age-BMI-similar healthy (a) female and (b) male volunteers.
TABLE III.
Results of Paired T-Test for TB Thickness and Marrow Spacing Measures Between BMI-Matched Male and Female Paries and Between Athletes and Sex- and BMI-Matched Healthy Controls
| Male | Female | Diff(%) | p-value | Athlete | Healthy Control | Diff(%) | p-value | |
|---|---|---|---|---|---|---|---|---|
| BMI (kg/m2) | 26.89±6.32 | 25.15±7.96 | +6.90 | 23.73±1.56 | 24.07±1.83 | −1.40 | ||
| THB(mm) | 0.22±0.02 | 0.19±0.03 | +6.70 | <0.03 | 0.24±0.03 | 0.22±0.02 | +9.40 | 0.07 |
| SPM(mm) | 0.32±0.06 | 0.37±0.10 | −13.90 | <0.03 | 0.32±0.06 | 0.36±0.62 | −11.00 | 0.14 |
THB and SPM measures were computed using the new method.
In vivo MD-CT data from ten athlete volunteers (six male and four female) were processed. Collegiate athletes who were actively participating at the varsity level in volleyball or basketball were recruited from regional colleges and universities. We did not recruit from Big Ten universities in order to minimize genetic differences between the athletic sample and the IBDS sample. All athletes were screened to ensure that they had not been injured in the past year. A control group was formed by selecting among the 40 healthy volunteers, ten with the same gender and the most similar BMI value. The mean BMIs were 23.73 ± 1.56 kg/m2 for athletes, and 24.07 ± 1.83 kg/m2 for the control group, and r for the two groups of BMI values was 0.98. The results for one athlete and one nonathlete with similar BMI values are shown in Fig. 16. Obviously, the results indicate that the athlete has thicker TB than the nonathlete. Quantitative results show that athletes on average have 9.4% thicker TB and 11.0% reduced marrow spacing as compared to age-sex-BMI-matched healthy controls (see Table III). Results of paired t-tests showed the differences were statistically significant (p = 0.01 for TB thickness and p = 0.04 for marrow spacing). Using FDT-based methods, athletes on average have 10.0% thicker TB and 9.3% reduced marrow spacing as compared to nonathletes, with p of 0.07 and 0.14 for TB thickness and marrow spacing, respectively.
Fig. 16.
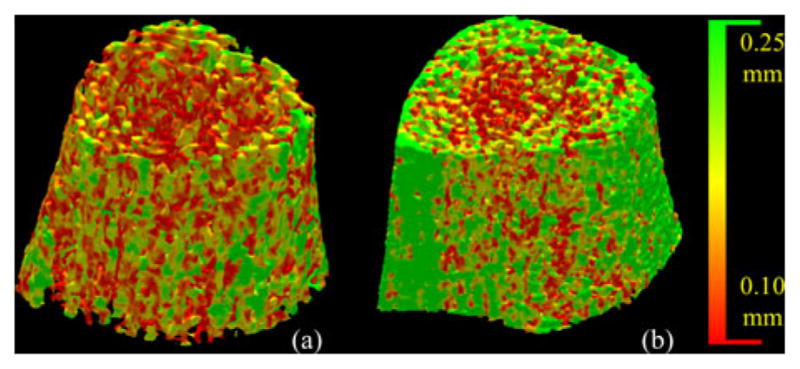
Same as Fig. 15, but comparison between a healthy nonathlete (a) and an age-sex-BMI-matched athlete volunteer.
V. CONCLUSION
In this paper, we presented a new thickness computation algorithm for fuzzy digital objects at relatively low resolution and investigated its role in computing TB thickness and marrow spacing measures through MD-CT imaging under in vivo conditions. Results of a comprehensive study on computer-generated phantoms and fifteen cadaveric ankle specimens evaluating the new method were presented. Observed results demonstrated encouraging accuracy and stability of computed thickness at different levels of noise and downsampling. Also, high repeat MD-CT scan reproducibility of the new thickness computation method was observed in the cadaveric ankle study. TB thickness and marrow spacing measures demonstrated higher ability to predict the experimental mechanical properties of TB under in vivo conditions as compared to BMD and conventional FDT-based methods. Currently, we are investigating the power of the new method to characterize clinical groups with low bone mass.
Also, in vivo data from 40 age similar and BMI order-matched male and female volunteers demonstrated that males have significantly thicker trabeculae and significantly reduced marrow spacing as compared to females. Although similar differences of TB thickness and marrow spacing between males and females were observed for FDT-based measures, differences were not statistically significant. A second experiment on ten basketball or volleyball athletes and age-sex-BMI similar healthy matched controls showed that using the current method, athletes have significantly thicker TB and significantly reduced marrow spacing. This imaging difference is consistent with the Mechanostat theory which states that bone adapts to local mechanical elastic deformation in response to peak forces caused by muscle activity. In short, the thicker TB and reduced marrow spacing in the athletes which we report is an environmental adaptation that improves bone strength. Our results suggest that exercise interventions that do not include pre- and postmeasures of TB may not fully capture the positive effects of the intervention. A similar analysis using FDT-based measures marginally failed to demonstrate statistically significant differences in TB thickness and marrow spacing between and athletes and healthy matched controls. The current experimental results demonstrate the application of the proposed method in a young population, but it has yet to be tested on an osteoporotic population, generally, consisting of elderly subjects or subjects with compromised bone.
One drawback of the current thickness computation method lies in the increased computation time needed to compute interpolated intensity values at multiple sample points on individual star-lines for each axial voxel. Current implementation of the method on a desktop with a 2.53-GHz Intel(R) Xeon(R) CPU and Linux OS requires approximately 4–5 min for a typical MD-CT image analysis of human TB over a region of interest of 300 × 300 × 300 at an isotropic resolution of 150 μm. Considering the fact that the method is fully automated and it can be run on multiple images in a batch mode, the additional computation time may not be an important concern for most applications.
Acknowledgments
This work was supported by the National Institutes of Health under Grant R01-AR054439 and Grant R01-DE012101.
The authors would like to thank J. Fishbaugher for helping with the conduct of the human study.
Contributor Information
Yinxiao Liu, Email: yinxiao-liu@uiowa.edu, Department of Electrical and Computer Engineering, University of Iowa, Iowa City, IA 52242 USA.
Dakai Jin, Email: dakai-jin@uiowa.edu, Department of Electrical and Computer Engineering, University of Iowa, Iowa City, IA 52242 USA.
Cheng Li, Email: cheng-li@uiowa.edu, Department of Electrical and Computer Engineering, University of Iowa, Iowa City, IA 52242 USA.
Kathleen F. Janz, Email: kathleen-janz@uiowa.edu, Department of Health and Human Physiology, University of Iowa, Iowa City, IA 52242 USA
Trudy L. Burns, Email: trudy-burns@uiowa.edu, Department of Epidemiology, University of Iowa, Iowa City, IA 52242 USA
James C. Torner, Email: james-torner@uiowa.edu, Department of Epidemiology, University of Iowa, Iowa City, IA 52242 USA
Steven M. Levy, Email: steven-levy@uiowa.edu, Department of Preventive and Community Dentistry and the Department of Epidemiology, University of Iowa, IA 52242 USA
Punam K. Saha, Department of Electrical and Computer Engineering and the Department of Radiology, University of Iowa, Iowa City, IA 52242 USA.
References
- 1.Boonen S, Singer AJ. Osteoporosis management: Impact of fracture type on cost and quality of life in patients at risk for fracture I. Curr Med Res Opin. 2008;24:1781–1788. doi: 10.1185/03007990802115796. [DOI] [PubMed] [Google Scholar]
- 2.Melton LJ., 3rd Epidemiology of spinal osteoporosis. Spine. 1997;22:2S–11S. doi: 10.1097/00007632-199712151-00002. [DOI] [PubMed] [Google Scholar]
- 3.Benito M, Gomberg B, Wehrli FW, Weening RH, Zemel B, Wright AC, Song HK, Cucchiara A, Snyder PJ. Deterioration of trabecular architecture in hypogonadal men. J Clin Endocrinol Metab. 2003;88:1497–1502. doi: 10.1210/jc.2002-021429. [DOI] [PubMed] [Google Scholar]
- 4.Barger-Lux MJ, Recker RR. Bone microstructure in osteoporosis: Transilial biopsy and histomorphometry. Top Magn Reson Imag. 2002;13:297–305. doi: 10.1097/00002142-200210000-00002. [DOI] [PubMed] [Google Scholar]
- 5.Kleerekoper M, Villanueva AR, Stanciu J, Sudhaker Rao D, Parfitt AM. The role of three-dimensional trabecular microstructure in the pathogenesis of vertebral compression fractures. Calcified Tissue Int. 1985;37:594–597. doi: 10.1007/BF02554913. [DOI] [PubMed] [Google Scholar]
- 6.Parfitt AM. Implications of architecture for the pathogenesis and prevention of vertebral fracture. Bone. 1992;13:S41–S47. doi: 10.1016/8756-3282(92)90196-4. [DOI] [PubMed] [Google Scholar]
- 7.Recker RR. Architecture and vertebral fracture. Calcified Tissue Int. 1993;53(Suppl 1):S139–S142. doi: 10.1007/BF01673423. [DOI] [PubMed] [Google Scholar]
- 8.Vesterby A, Gundersen HJ, Melsen F, Mosekilde L. Marrow space star volume in the iliac crest decreases in osteoporotic patients after continuous treatment with fluoride, calcium, and vitamin D2 for five years. Bone. 1991;12:33–37. doi: 10.1016/8756-3282(91)90052-k. [DOI] [PubMed] [Google Scholar]
- 9.Link TM, Majumdar S, Augat P, Lin JC, Newitt D, Lu Y, Lane NE, Genant HK. In vivo high resolution MRI of the calcaneus: Differences in trabecular structure in osteoporosis patients. J Bone Mine Res. 1998;13:1175–1182. doi: 10.1359/jbmr.1998.13.7.1175. [DOI] [PubMed] [Google Scholar]
- 10.Moore R, Durbridge T, McNeil P, Parkinson I, Need A. Trabecular spacing in post-menopausal Australian women with and without vertebral fractures. Aust N Z J Med. 1992;22:269–273. doi: 10.1111/j.1445-5994.1992.tb02124.x. [DOI] [PubMed] [Google Scholar]
- 11.Parfitt AM, Mathews CHE, Villanueva AR, Kleerekoper M, Frame B, Rao DS. Relationships between surface, volume, and thickness of iliac trabecular bone in aging and in osteoporosis. Implications for the microanatomic and cellular mechanisms of bone loss. J Clin Invest. 1983;72:1396–1409. doi: 10.1172/JCI111096. [DOI] [PMC free article] [PubMed] [Google Scholar]
- 12.Chung H, Wehrli FW, Williams JL, Kugelmass SD. Relationship between NMR transverse relaxation, trabecular bone architecture and strength. Proc Nat Acad Sci. 1993;90:10250–10254. doi: 10.1073/pnas.90.21.10250. [DOI] [PMC free article] [PubMed] [Google Scholar]
- 13.Mosekilde L. Age-related changes in vertebral trabecular bone architecture—Assessed by a new method. Bone. 1988;9:247–250. doi: 10.1016/8756-3282(88)90038-5. [DOI] [PubMed] [Google Scholar]
- 14.Spadaro JA, Werner FW, Brenner RA, Fortino MD, Fay LA, Edwards WT. Cortical and trabecular bone contribute strength to the osteopenic distal radius. J Orthp Res. 1994;12:211–218. doi: 10.1002/jor.1100120210. [DOI] [PubMed] [Google Scholar]
- 15.Chavassieux P, Arlot M, Meunier PJ. Clinical use of bone biopsy. Osteoporosis. 2001;2:501–509. [Google Scholar]
- 16.Rüegsegger P, Koller B, Muller R. A microtomographic system for the nondestructive evaluation of bone architecture. Calcified Tissue Int. 1996;58:24–29. doi: 10.1007/BF02509542. [DOI] [PubMed] [Google Scholar]
- 17.Majumdar S. Magnetic resonance imaging of trabecular bone structure. Top Magn Reson Imag. 2002;13:323–334. doi: 10.1097/00002142-200210000-00004. [DOI] [PubMed] [Google Scholar]
- 18.Wehrli FW. Trabecular bone imaging. In: Young IR, editor. Magnetic Resonance Imaging and Spectroscopy in Medicine and Biology. Vol. 2. London, U.K: Wiley; 2000. pp. 1356–1368. [Google Scholar]
- 19.Laib A, Hauselmann HJ, Rüegsegger P. In vivo high resolution 3D-QCT of the human forearm. Tech Heal Care. 1998;6:329–337. [PubMed] [Google Scholar]
- 20.Burghardt AJ, Link TM, Majumdar S. High-resolution computed tomography for clinical imaging of bone microarchitecture. Clin Orthop Relat Res. 2011;469:2179–2193. doi: 10.1007/s11999-010-1766-x. [DOI] [PMC free article] [PubMed] [Google Scholar]
- 21.MacNeil JA, Boyd SK. Improved reproducibility of high-resolution peripheral quantitative computed tomography for measurement of bone quality. Med Eng Phys. 2008;30:792–799. doi: 10.1016/j.medengphy.2007.11.003. [DOI] [PubMed] [Google Scholar]
- 22.Ito M, Ikeda K, Nishiguchi M, Shindo H, Uetani M, Hosoi T, Orimo H. Multi-Detector Row CT Imaging of Vertebral Microstructure for Evaluation of Fracture Risk. J Bone Miner Res. 2005;20:1828–1836. doi: 10.1359/JBMR.050610. [DOI] [PubMed] [Google Scholar]
- 23.Diederichs G, Link TM, Kentenich M, Schwieger K, Huber MB, Burghardt AJ, Majumdar S, Rogalla P, Issever AS. Assessment of trabecular bone structure of the calcaneus using multi-detector CT: Correlation with microCT and biomechanical testing. Bone. 2009;44:976–983. doi: 10.1016/j.bone.2009.01.372. [DOI] [PubMed] [Google Scholar]
- 24.Saha PK, Xu Y, Duan H, Heiner A, Liang G. Volumetric topological analysis: a novel approach for trabecular bone classification on the continuum between plates and rods. IEEE Trans Med Imag. 2010 Nov;29:1821–1838. doi: 10.1109/TMI.2010.2050779. [DOI] [PMC free article] [PubMed] [Google Scholar]
- 25.Little SA, Sproule MW, Cowan MD, Macleod KJ, Robertson M, Love JG, Chalmers GW, McSharry CP, Thomson NC. High resolution computed tomographic assessment of airway wall thickness in chronic asthma: Reproducibility and relationship with lung function and severity. Thorax. 2002;57:247–253. doi: 10.1136/thorax.57.3.247. [DOI] [PMC free article] [PubMed] [Google Scholar]
- 26.Xu Y, Liang G, Hu G, Yang Y, Geng J, Saha PK. Quantification of coronary arterial stenoses in CTA using fuzzy distance transform. Comput Med Imag Graph. 2012;36:11–24. doi: 10.1016/j.compmedimag.2011.03.004. [DOI] [PubMed] [Google Scholar]
- 27.Saha PK, Gao Z, Alford SK, Sonka M, Hoffman EA. Topo-morphologic separation of fused isointensity objects via multi-scale opening: separating arteries and veins in 3-D pulmonary CT. IEEE Trans Med Imag. 2010 Mar;29(3):840–851. doi: 10.1109/TMI.2009.2038224. [DOI] [PMC free article] [PubMed] [Google Scholar]
- 28.Hildebrand T, Rüegsegger P. A new method for the model independent assessment of thickness in three-dimensional images. J Microscopy. 1997;185:67–75. [Google Scholar]
- 29.Saha PK, Wehrli FW. Measurement of trabecular bone thickness in the limited resolution regime of in vivo MRI by fuzzy distance transform. IEEE Trans Med Imag. 2004 Jan;23(1):53–62. doi: 10.1109/TMI.2003.819925. [DOI] [PubMed] [Google Scholar]
- 30.Vesterby A, Gundersen HJ, Melsen F. Star volume of marrow space and trabeculae of the first lumbar vertebra: Sampling efficiency and biological variation. Bone. 1989;10:7–13. doi: 10.1016/8756-3282(89)90140-3. [DOI] [PubMed] [Google Scholar]
- 31.Croucher PI, Garrahan NJ, Compston JE. Assessment of cancellous bone structure: comparison of strut analysis, trabecular bone pattern factor, and marrow space star volume. J Bone Miner Res. 1996;11:955–961. doi: 10.1002/jbmr.5650110712. [DOI] [PubMed] [Google Scholar]
- 32.Martn-Badosa E, Elmoutaouakkil A, Nuzzo S, Amblard D, Vico L, Peyrin F. A method for the automatic characterization of bone architecture in 3D mice microtomographic images. Comput Med Imag Graph. 2003;27:447–458. doi: 10.1016/s0895-6111(03)00031-4. [DOI] [PubMed] [Google Scholar]
- 33.Saha PK. Tensor scale: A local morphometric parameter with applications to computer vision and image processing. Comput Vis Imag Understanding. 2005;99:384–413. [Google Scholar]
- 34.Moreno R, Borga M. Ö. Smedby, “Estimation of trabecular thickness in gray-scale images through granulometric analysis. Proc SPIE, 2012. 2012:831451-1–831451-9. to be published. [Google Scholar]
- 35.Liu Y, Jin D, Saha PK. A new algorithm for trabecular bone thickness computation at low resolution achieved under in vivo condition. Proc. 10th Int. Symp. Biomed. Imag; San Francisco, CA, USA. 2013. pp. 390–393. [DOI] [PMC free article] [PubMed] [Google Scholar]
- 36.Liu Y, Saha PK, Xu Z. Quantitative characterization of trabecular bone micro-architecture using tensor scale and multi-detector CT imaging. Proc. Image Comput. Comput.-Assisted Intervention Conf; Nice, France. 2012. pp. 124–131. [DOI] [PMC free article] [PubMed] [Google Scholar]
- 37.Borgefors G. On digital distance transformation in three dimensions. Comput Vis Imag Understanding. 1996;64:368–376. [Google Scholar]
- 38.Saha PK, Chaudhuri BB, Majumder DD. A new shape preserving parallel thinning algorithm for 3D digital images. Pattern Recognit. 1997;30:1939–1955. [Google Scholar]
- 39.Arcelli C, Sanniti di Baja G, Serino L. Distance-driven Skeletonization in voxel images. IEEE Trans Pattern Anal Mach Intell. 2011 Apr;33(4):709–720. doi: 10.1109/TPAMI.2010.140. [DOI] [PubMed] [Google Scholar]
- 40.Saha PK, Chaudhuri BB. Detection of 3-D simple points for topology preserving transformations with application to thinning. IEEE Trans Pattern Anal Mach Intell. 1994 Oct;16(10):1028–1032. [Google Scholar]
- 41.Saha PK, Wehrli FW, Gomberg BR. Fuzzy distance transform: Theory, algorithms, and applications. Comput Vis Imag Understanding. 2002;86:171–190. [Google Scholar]
- 42.Saha PK, Udupa JK, Odhner D. Scale-based fuzzy connected image segmentation: Theory, algorithms, and validation. Comput Vis Imag Understanding. 2000;77:145–174. [Google Scholar]
- 43.Saha PK, Chaudhuri BB, Chanda B, Majumder DD. Topology Preservation in 3D Digital Space. Pattern Recognit. 1994;27:295–300. [Google Scholar]
- 44.Breu H, Gil J, Kirkpatrick D, Werman M. Linear time Euclidean distance transform algorithms. IEEE Trans Pattern Anal Mach Intell. 1995;17:529–533. [Google Scholar]
- 45.Hernandez CJ, Beaupre GS, Keller TS, Carter DR. The influence of bone volume fraction and ash fraction on bone strength and modulus. Bone. 2001;29:74–78. doi: 10.1016/s8756-3282(01)00467-7. [DOI] [PubMed] [Google Scholar]


