

Abstract
The formation of a microvasculature is regulated in large part by cell-cell interactions. Ephrins and their Eph receptors mediate cell adhesion, repulsion, and migration, all critical processes in angiogenesis. 1 Here, we use a covalently immobilized ephrinA1, conjugated to poly(ethylene glycol), to induce vessel formation both in vitro and in vivo in poly(ethylene glycol) diacrylate (PEGDA) hydrogels. Human umbilical vein endothelial cell (HUVEC) tubulogenesis in matrix metalloproteinase- sensitive hydrogels was visualized from 6 hours to 7 days in response to three different concentrations of PEG-ephrinA1. The deposition of extracellular matrix proteins collagen IV and laminin that stabilize tubule formation were imaged, quantified, and found to be dependent upon PEG-ephrinA1 concentration. To confirm the importance of the EphA2-ephrinA1 interaction in tubule formation, soluble EphA2 was used to disrupt the EphA2-ephrinA1 interaction between a co-culture of HUVEC and human brain vascular pericyte cells. HUVECs seeded onto PEGDA hydrogels displayed a dose- dependent reduction in tubule formation in response to the soluble EphA2. Finally, hydrogels with releasable platelet derived growth factor (PDGF), immobilized RGDS, and covalently immobilized PEG-ephrinA1 were implanted into the mouse cornea micropocket. These hydrogels induced a more robust vascular response with an increase in vessel density as compared to hydrogels with releasable PDGF alone. As such, PEG-ephrinA1 may represent a promising molecule to regulate cell adhesion and migration for formation of a microvasculature in tissue engineered constructs.
Keywords: hydrogel, PEG, ephrinA1, angiogenesis, biomimetic material
INTRODUCTION
The formation of a microvascular system requires precise coordination between cells and their environment. In particular, signaling by the receptor tyrosine kinases family of Eph receptors and their ephrin ligands is involved in directing the growth, differentiation, and patterning of tissues of the microvascular system. Unlike other receptor tyrosine kinases, Eph receptors bind to membrane bound ephrin ligands. Ephrin ligands are categorized as type A for having a Glycosylphosphatidylinosito-anchor or type B for having a transmembrane domain. Eph receptors of the A class usually interact with ephrin ligands of the A class. Signaling can occur in a forward manner by ephrin ligands activating Eph receptors as well as in reverse by Eph receptors activating ephrin ligands. 1 EphrinA1, which is most commonly expressed on neurons and endothelial cells, is a factor of particular interest for researchers who aim to promote vascularization of tissue constructs. Although initially discovered for involvement in the nervous system, the interaction between ephrinA1 and its EphA2 receptor has since been investigated for its involvement in angiogenesis. 2,3 Activation of ephrinA1 and EphA2 has been shown to initiate endothelial cell migration and capillary invasion by regulating vascular cell shape, migration, adhesion, and proliferation. 4 Expression of ephrinA1 is induced by tumor necrosis factor-α, interleukin-1 beta, and vascular endothelial growth factor. 5 Soluble ephrinA1 has been shown to induce human umbilical vein endothelial cells (HUVECs) to form capillary-like structures. 6 Furthermore, a dominan- negative form of EphA2 inhibited HUVECs from forming capillary-like structures. 7 Soluble ephrinA1 has also induced endothelial cell migration4 and capillary sprouting 8 and in vivo angiogenesis in a variety of assays, including the cornea micropocket 8 and subcutaneous implantation of ephrinA1-soaked sponges. 9
In more recent work, an immobilized ephrinA1 was used to initiate the formation of a tubule network on surface modified hydrogels. 10 Since tissue engineering aims to replace damaged or diseased tissues and organs with functional engineered counterparts, the establishment of a vascular system is critical for the long-term success of these materials. 11 In the present study, poly(ethylene glycol) diacrylate (PEGDA) hydrogels were selected as the scaffold matrix based on their biocompatibility and innate resistance to protein adsorption and nonspecific cellular adhesion. It has been well established that this “blank slate” platform can be precisely modified with molecules to induce desired cellular responses. 12 PEGDA hydrogels are photocrosslinked under mild conditions, enabling high cell viability after encapsulation. Finally, the materials can be rendered biodegradable by incorporating a matrix-metalloproteinase sensitive peptide into the polymer backbone. 13
Immobilized growth factors and signaling peptides have been used to induce specific, local effects. Previously, basic fibroblast growth factor that was immobilized onto PEGDA hydrogels was shown to induce vascular smooth muscle cell proliferation and migration. 14 In another study, immobilized ephrinA1 influenced endothelial cell adhesion via avβ3 integrins in a dose-dependent manner and also contributed to the formation of tubule networks with visible lumen formation. 10 In this work, we further highlight the role of immobilized ephrinA1 in microvascular tubule formation. Based on these findings, we conclude that delivery of immobilized ephrinA1 represents a promising strategy to regulate cell adhesion and migration for the formation of a microvasculature network in tissue engineered constructs.
MATERIALS AND METHODS
Cell Maintenance
HUVECs (Lonza, Walkersville, MD) were cultured in endothelial growth medium EGM-2 (Lonza), supplemented with the EGM-2 bullet kit containing ascorbic acid, epidermal growth factor, fibroblast growth factor (hFGF-2), heparin, hydrocortisone, insulin-like growth factor, GA-1000 (gentamicin, amphotericin-B), and 2% fetal bovine serum (Bulletkit, Lonza). Human brain vascular pericytes (HBVP, ScienCell, Carlsbad, CA) were cultured in pericyte medium (ScienCell) on poly-L- lysine coated flasks (2 μg/cm2). HUVECs were used from passages 4 to 6, and HBVP cells were used from passages 4 to 9. Cells were incubated at 37 °C and 5% CO2 with media replenishment and subculturing as necessary. Immunohistochemistry was performed to confirm ephrinA1 expression by HBVP and EphA2 expression by HUVECs.
Polymer Synthesis
Poly(ethylene glycol) (PEG) diacrylate was synthesized by reacting dry PEG (MW = 6000 Da; Fluka) with acryloyl chloride (Sigma, St. Louis, MO) and triethyl amine (TEA; Sigma) in anhydrous dichloromethane (DCM; Sigma). The reaction was performed using 1:4 PEG:acryloyl chloride and 1:2 PEG:TEA molar ratios under argon gas overnight. 2 M K2CO3 was used to wash the solution before allowing it to separate into aqueous and organic phases. The organic phase containing PEGDA was dried using anhydrous MgSO4 and filtered. PEGDA powder was obtained by precipitating in diethyl ether, filtering, and drying overnight under vacuum and stored at −20°C under argon gas.
The cell-adhesive peptide, Arg-Gly-Asp-Ser, (RGDS, American Peptide, Sunnyvale, CA) was conjugated to a hetero-bifunctional PEG to form PEG-RGDS. RGDS peptide was dissolved into anhydrous dimethyl sulfoxide with one drop of diisopropylethylamine. The solution of RGDS was dripped onto dry acryloyl-PEG-succinimidyl carboxymethyl (PEG-SCM, Laysan, Arab, AL) using a molar ratio of 1.1:1 PEG-SCM: RGDS. The reaction was placed on a rocker overnight, followed by dialysis against water in a regenerated cellulose membrane. The final product was sterilized via filtration and lyophilized. Successful conjugation was confirmed with a gel permeation chromatography (GPC) system equipped with a PLgel column (5μm, 500Å, Polymer Laboratories, Amherst, MA) and an evaporative light scattering detector (Polymer Laboratories).
Degradable hydrogels were synthesized by incorporating a matrix metalloproteinase-sensitive peptide, GGGPQGIWGQGK (abbreviated PQ), into the backbone of the base polymer. Fmoc chemistry was used to synthesize the PQ peptide on an APEX 396 solid phase peptide synthesizer (Aapptec, Louisville, KY). Matrix-assisted laser desorption/ionisation-time of flight mass spectrometry (MALDI- ToF MS Autoflex; Bruker Daltonics, Billerica, MA, solvent: methanol) characterization confirmed successful peptide synthesis. Using a 2.1:1 molar ratio of PEG-SCM to peptide, the synthesized PQ peptide was conjugated to PEG by following a procedure similar to that for PEG-RGDS. PEG-PQ-PEG conjugation was also confirmed using GPC.
PEG-ephrinA1 Conjugation
Acryloyl-PEG-succinimidyl carbonate (PEG-SMC) was synthesized in house in order to formulate a product that was capable of reacting in aqueous conditions, and thus amenable for protein conjugations. Synthesis followed procedures previously outlined (Figure 1A). 15 Briefly, PEG (Fluka/Sigma, MW = 3400 Da) was reacted with Ag2O (Sigma), acryloyl chloride (Sigma), and KI (Sigma) in anhydrous dichloromethane (DCM; Sigma) at 4 °C overnight, at molar excess ratios of 1.5, 1.1, and 0.3 respectively. The solution was filtered using Celite 521 (Spectrum Chemical Mfg Corp, Gardena, CA) and dried prior to dissolution in di H20. The solution was adjusted to pH 3 and heated to 35 °C for 1 h. Activated charcoal (Fisher Pittsburg, PA) was used to remove iodine, and NaCl and DCM were added. Unwanted components were removed via DCM extraction and phase separation with 2 M K2CO3. Monoacrylated PEG was dried and concentrated followed by ethyl ether precipitation and vacuum filtration. Monoacrylated PEG in anhydrous acetonitrile (Sigma) and pyridine (Sigma) was reacted with a four molar excess of disuccinimidyl carbonate (Sigma) under argon overnight. The product was dried and dissolved in anhydrous DCM. After filtration, PEG-SMC was purified in acetate buffer (0.1 M, pH 4.5, 15% NaCl) via phase separation. The purified PEG-SMC was dried with anhydrous MgSO4 and precipitated into ethyl ether. After filtration and drying, PEG-SMC was characterized by proton nuclear magnetic resonance spectroscopy (1H-NMR, Avance 400 Hz; Bruker) and stored at −80 °C under argon.
Figure 1.
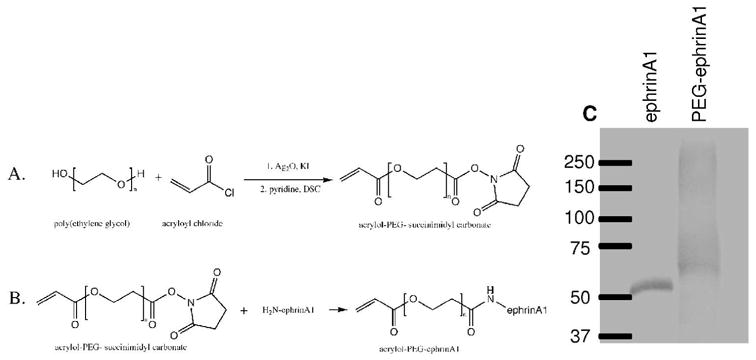
A) Acryloyl-PEG-succinimidyl carbonate (PEG-SMC) was synthesized by reacting poly(ethylene glycol) with acryloyl chloride in the presence of silver oxide and potassium iodide before exposure to disuccinimidyl carbonate. B) Immobilized ephrinA1 was synthesized by reacting PEG-SMC with primary amines on ephrinA1. Successful conjugation was confirmed with a western blot where an increase in molecular weight corresponds to the addition of PEG chains to the protein (C).
EphrinA1-Fc was obtained from R&D Systems (Minneapolis, MN) as a recombinant fusion protein containing the extracellular binding portion of ephrinA1 and the Fc fragment of human IgG. This protein was reacted with acryloyl-PEG-SMC to form PEG-ephrinA1 (Figure 1B). 200 mM sodium bicarbonate buffer (pH 8.5) was used to dissolve synthesized acryloyl-PEG-SMC. The solution was sterilized via filtration (0.2 μm) and combined with ephrinA1 at a 1:100 molar ratio of ephrinA1:PEG-SMC. The reaction was placed on a rocker for four days at 4°C before lyophilization under sterile conditions. The PEG-ephrinA1 powder was reconstituted and stored in HEPES Buffered Saline (100 mM NaCl, 10 mM HEPES in deionized water; HBS; pH 7.4) for up to three months at 4°C. A western blot was used to confirm successful conjugation. 200 ng ephrinA1 and PEG-ephrinA1 were run on a 4–15% Tris-HCL precast polyacrylamide gel (Biorad, Hercules, CA) at 80 V for 2 h. After transferring to a nitrocellulose membrane, bands were detected using a 1:200 dilution of anti-ephrinA1 primary antibody produced in goat (Sigma, St. Louis, MO) with a 1:500 dilution of secondary antibody HRP-conjugated rabbit anti-goat IgG (Sigma). Using an ECL™ chemiluminescent western blotting analysis system (GE Healthcare, Buckinghamshire, UK) images were taken on an LAS 4000 (FujiFilm, Little Rock, AK).
Surface Modification of Hydrogels
6 kDa PEGDA hydrogels were synthesized by dissolving polymer (10 % w/v) in HBS with 10 μl/ml acetophenone stock solution (300 mg 2-dimethoxy-2-phenylacetophenone in 1 ml n-vinyl pyrrolidone (NVP)). The liquid PEGDA solution was injected between glass slides separated by a 0.75 mm polytetrafluoroethylene spacer secured by binder clips. Hydrogels were crosslinked via exposure to UV light (B-200SP UV lamp, UVP, 365 nm, 10 mW/cm2) for 30 s and allowed to swell by soaking in HBS with 0.1% sodium azide.
Circular disks 5 mm in diameter were punched from the bulk hydrogels using a #2 biopsy punch. Solutions containing 50 mg/ml PEG-RGDS and 10 μl/ml acetophenone with 0, 0.0392, 0.216, or 0.392 μg PEG-ephrinA1 were added to the gel surface and exposed to UV light for 2 min to achieve surface immobilization. Hydrogels were soaked in sterile HBS before use.
HUVECs (8.5 × 10⁵ cells/cm2) were seeded onto the modified surfaces and imaged using an Axiovert (Zeiss) inverted fluorescence microscope 2, 3, and 4 weeks after seeding. Images of the hydrogels were merged using Adobe Photoshop Elements, and modified surface areas and tubule lengths were traced using Adobe Illustrator, and then quantified using ImageJ (n = 22, 19, 16, and 16 for PEG-ephrinA1 concentrations of 0, 0.0392, 0.216, 0.392 μg, respectively).
Effects of Soluble EphA2 on Tubulogenesis
Previous work has shown that a co-culture of HUVEC and HBVP cells spontaneously form tubule networks. 16 To confirm the role of the EphA2-ephrinA1 interaction in tubule formation on hydrogel surfaces, soluble EphA2 was added to culture media for inhibition experiments. Hydrogel surfaces were modified with 50 mg/ml PEG-RGDS as described above in the Surface Modification of Hydrogels section. 8.5 × 10⁵ cells/cm2 HUVEC and HBVP cells were seeded onto the modified surfaces at a ratio of 4:1 HUVEC: HBVP. Cells were cultured in media with 0, 500 ng/ml, 1500 ng/ml, or 5000 ng/ml soluble EphA2 (R&D Systems) based upon previously established effective levels of EphA2. 17 Six days after cell seeding, hydrogels were imaged using an Axiovert (Zeiss) inverted fluorescence microscope. Hydrogel area and tubule length were quantified as described above with a sample size of 14 for 0 ng/ml and 500 ng/ml treatment groups and 13 for 1500 ng/ml and 500 ng/ml treatment groups.
Endothelial Cell Encapsulation into Degradable Hydrogels
To delineate the effects of PEG-ephrinA1 on endothelial cells in 3D, HUVECs were encapsulated into MMP-sensitive hydrogels containing PEG-ephrinA1. Polymer solution was prepared with a final formulation of 10% (w/v) PEG-PQ-PEG and 3.5 μmol/ml PEG-RGDS in sterilized 1.5% (v/v) triethanolamine, 1 mM Eosin Y, and 3.95 μl/ml NVP in 10 mM HBS. Three concentrations of PEG-ephrinA1 were used in combination with PEG-RGDS, including 0.25 ng/ml, 2.5 ng/ml, and 25 ng/ml. Hydrogels containing PEG-RGDS alone were used as a control group. HUVECs were harvested using trypsin-EDTA and counted using a Coulter counter. After counting, the cells were pelleted by centrifuging at 2700 RPM for 4 min and resuspended in polymer solution to a concentration of 10,000 cells/μl. Next, a cylindrical polymer droplet was formed. A 5 μl droplet of cell-laden polymer was placed in between two polydimethylsiloxane (PDMS) strips (380 nm in thickness) on a Sigmacoted (Sigma) glass slide. An acrylated coverglass was placed over the polymer and PDMS strips before exposing the polymer to white light for 30 s. Hydrogels were affixed to the acrylated coverglass in order to reduce the movement of hydrogels during staining and imaging. Acrylation was accomplished by first cleaning with a mixture of 30% (v/v) hydrogen peroxide and 70% sulfuric acid, rinsing with ethanol, and then exposing the glass to a solution of 2% 3-(trimethoxysilyl) propyl methacrylate in 95% ethanol overnight. After acrylation, coverglass was incubated at 100°C for 2 h. Cylindrical hydrogels attached to the acrylated coverglass were immediately immersed in EGM-2 media.
Staining for Actin and Extracellular Matrix Proteins
To examine tubule morphology, immunohistochemistry was performed to identify tubule structure and extracellular matrix production. Gels were fixed in 4% paraformaldehyde for 20 min and washed with phosphate buffered saline (PBS). 0.5% Triton-X was used to permeabilize cells for 10 min followed by a second PBS wash. Blocking of non-specific binding was accomplished with 3% bovine serum albumin (BSA). Gels were incubated with a 1:100 dilution of rhodamine phalloidin (Invitrogen, Carlsbad, CA) with 2 μM DAPI in 1% BSA for 2 h to stain actin and nuclei, respectively. Images were obtained on a confocal microscope (Zeiss5 LIVE, Plan-Apochromat 20x objective with 0.8 numerical aperture). To quantify resulting tubule formation visualized via phalloidin staining, Farsight was used to calculate the percent of each cell’s borders that were shared with other cells (n= 3 hydrogels).18,19
To identify collagen IV and laminin production, 3% normal donkey serum (Sigma) was used as a blocking agent. Primary antibodies were diluted in 3% BSA in PBS and incubated overnight at 4 °C on a rocker table. Primary antibodies included anti-collagen IV produced in rabbit (Abcam, Cambridge, MA) and polyclonal anti-laminin produced in chicken (Sigma), which is able to recognize all three polypeptide chains of the laminin protein. Gels were rinsed in PBS for 1 h, and rinsing was repeated four times. Gels were incubated with a 1:500 dilution of Alexafluor 488 donkey anti-rabbit IgG (Invitrogen) or Alexafluor 488 goat anti-chicken IgG (Invitrogen) overnight at 4 °C in order to visualize the primary antibodies. PBS washing was repeated and gels were imaged using a confocal microscope. Images were taken using a 20x objective to yield 318 μm × 318 μm images. Alexafluor 488 pixel intensities in 3D projections of 20 μm in thickness with 1 μm in between slices were quantified in ImageJ using 3 fields of view from each of 3 hydrogels and normalized to cell number using DAPI pixel intensity.
Angiogenesis Assay: Hydrogel Implantation into the Mouse Cornea
To visualize vessel invasion into the materials, hydrogels were implanted into Flk1-myr::mCherry transgenic mice, which express an endothelial cell specific florescent protein. 20 Hydrogel preparation and implantation followed the protocol outlined in Poche et al., 21 and all animal experiments were conducted in accordance with Baylor College of Medicine Institutional Animal Care and Use Committee protocols. Briefly, hydrogels were prepared at 10% polymer weight of degradable PEG-PQ-PEG, 3.5 μmol/ml PEG-RGDS, 10 μl/ml acetophenone stock solution, and 160 ng soluble platelet derived growth factor BB (PDGF-BB) per gel with or without 1.6 ng PEG-ephrinA1 (n=5 and 6, respectively). A mold of precise thickness was made by separating two glass slides with a 0.005 in polytetrafluoroethylene (PTFE) spacer and securing the glass slides with binder clips. 0.12 μl of the polymer solution was then injected between glass slides. Hydrogels were exposed to UV light (B-200SP UV lamp, 365 nm, 10mW/cm2) for 2 min and immediately implanted into a micropocket formed in the cornea. 22 Briefly, a partial thickness incision was made in the cornea of anesthetized mice. A Von Graefe knife was used to separate the layers of the cornea stroma, creating a micropocket for hydrogel implantation. Fourteen days after implantation, mice were euthanized, and corneas were collected and fixed in 4% paraformaldehyde. The tissue was flatmounted and imaged on a Zeiss LSM 510 META confocal microscope using a Zeiss 40x/1.2NA C-Apochromat water immersion objective lens. The mCherry fluorophore was excited with a 543 nm laser for visualization of endothelial cells that invaded the cornea and hydrogel in response to growth factor release. Images of vessels on the hydrogel were compiled from projections of z-stacks exactly 22 μm in thickness, spaced 1.1 μm apart.
Confocal z-stacks were used to quantify vessel parameters. Vessel branch points and diameters were quantified using the image browser in the LSM software. Fractal dimension, lacunarity, and vessel density were quantified as previously described. 23 The fractal dimension was quantified to describe the complexity of the vessel network and lacunarity to examine nonuniformity of cell distribution in a scale-invariant manner. 23–25
Statistics
Two-way ANOVA and subsequent Bonferroni post hoc tests were used to statistically analyze vessel formation and extracellular matrix production. For each analysis, p<0.05 was considered significant.
RESULTS
Polymer Characterization
Synthesis of PEG-RGDS and PEG-PQ-PEG were carried out as previously described.12 Successful synthesis of PEG-RGDS and PEG-PQ-PEG were confirmed with gel permeation chromatography. Successful conjugation of acryloyl-PEG-SCM to ephrinA1 was confirmed using a western blot where the increase in molecular weight confirms conjugations of PEG chains to ephrinA1 (Figure 1C).
HUVEC Tubule Formation on Hydrogel Surfaces Modified with PEG-ephrinA1
HUVECs seeded onto surfaces modified with three concentrations of PEG-ephrinA1 exhibited robust tubule formation with branching networks. Using a two-way ANOVA and Bonferroni post hoc analysis (supplemental table 1), a significant effect of the PEG-ephrinA1 concentration was observed (Fig 2, mean ± standard error of the mean (s.e.m.); p≪0.001). As early as 14 days after seeding, a direct relationship existed between the concentration of PEG-ephrinA1 and tubule formation with a significant difference between the highest concentration of 0.392 μg and both 0 μg and 0.039 μg (p<0.05). Prolonged ephrinA1 signaling via immobilization onto the surface maintained tubule formation at 28 days for the highest concentration of PEG-ephrinA1; whereas in the absence of immobilized ephrinA1, vessels rapidly regressed. A significant difference between the control group and both 0.216 μg and 0.392 μg PEG-ephrinA1 groups confirms the concentration affect (p<0.05).
Figure 2.
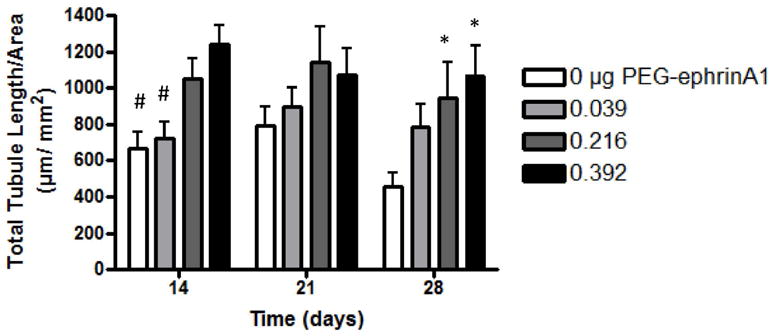
HUVECs seeded onto 2D surfaces modified with PEG-ephrinA1 exhibited robust tubule formation (mean ± s.e.m) where PEG-ephrinA1 concentration had a significant effect (p≪0.05). As early as 14 days, the 0.392 μg PEG-ephrinA1 induces significantly more tubule formation when compared to 0 and 0.039 μg (# p<0.05). By 28 days, the presence of PEG-ephrinA1 maintains tubule formation, and a significant difference is visible between the control and both 0.216 and 0.392 μg PEG-ephrinA1 (* p<0.05). Complete Bonferroni post hoc analysis is provided in supplemental table 1.
Soluble EphA2 Downregulates PEG-ephrinA1-induced Tubule Formation
Soluble EphA2 acts as a competitive inhibitor to EphrinA1/EphA2 binding on cells. 17 Soluble EphA2 was used to effectively diminish the tubule-inducing capacity of immobilized PEG-ephrinA1 on the surfaces of hydrogels. Six days after cell seeding, the co-culture of HUVEC and HBVP exhibited a reduction in tubule formation dependent upon the dose of soluble EphA2 (Figure 3; p<0.05), confirming the importance of the EphA2-ephrinA1 interaction in tubule formation.
Figure 3.

Disruption of the EphA2-ephrinA1 interaction between HBVP and HUVEC cells seeded onto 2D PEG-RGDS modified surfaces via soluble EphA2 in the media induced a dose-dependent decrease in tubule formation (C, mean ± standard deviation). CD31-labeled vessels (green) are visible in the lowest dose of 500 ng/ml EphA2 (B) while few vessels are visible in the highest dose of 5,000 ng/ml EphA2 (A; nuclei=blue, α-smooth muscle actin=red; scale bar= 50 μm). All dose pairings exhibit a statistically significance difference except 1500 and 500 ng/ml (p<0.05).
Encapsulated HUVECs Exposed to PEG-ephrinA1 form tubule networks
In 3D experiments, HUVECs encapsulated in degradable hydrogels with PEG-ephrinA1 formed tubule networks, as visualized at timepoints from 6 hours to 7 days via staining for tubule morphology (Supplemental Images). Three different concentrations of PEG-ephrinA1 were used, including 0.25, 2.5, and 25 ng/ml and compared to the presence of no PEG-ephrinA1. At early timepoints (24 and 48 hours), the low concentration of 0.25 ng/ml PEG-ephrinA1 induced the most tubule formation (Fig 4A). However, by 5 and 7 days, tubules persisted most notably in the presence of the highest growth factor concentration (25 ng/ml PEG-ephrinA1). In order to quantify the tubule formation response, the percentage of shared borders was calculated for all cells using a two-way ANOVA and Bonferroni post hoc test. For individual differences using the Bonferroni post hoc test, please refer to supplemental table 2. The concentration of PEG-ephrinA1, the time elapsed, and the interaction between the concentration and time were found to affect HUVEC tubule formation. For example, at 24 hours the cells exposed to the lowest concentration of 0.25 ng/ml PEG-ephrinA1 had a significantly higher number of shared borders when compared to all other treatments groups (p<0.05). By 7 days, all concentrations of PEG-ephrinA1 generated a cellular response that was statistically different from the control (Figure 4A; mean ± s.e.m.).
Figure 4.

A) Robust tubule formation was seen at early time points using low PEG-ephrinA1 concentrations and at late time points using higher PEG-ephrinA1 concentrations. In order to quantify the resulting tubule formation in 3D, the parameter percent shared borders was calculated to examine the percentage of each cell’s edges that were interacting with other cells to form tubule networks (mean ± s.e.m.). A two-way ANOVA shows a significant effect of PEG-ephrinA1 concentration and time. B) Collagen IV deposition was quantified and found to correspond to areas of high tubule formation (mean ± standard deviation). This effect is noticeable at 2 days using the 0.25 ng/ml PEG-ephrinA1 concentration as well as in the 7-day, 25 ng/ml PEG-ephrinA1 concentration. C) Laminin deposition was shown to be dependent upon both PEG-ephrinA1 concentration and time (mean ± standard deviation). For example, at 5 days, 25 ng/ml PEG-ephrinA1 expressed the most laminin and deposition decreased with PEG-ephrinA1 dose. The effects of time are visible in 2.5 ng/ml PEG-ephrinA1 where there is a notable increase in laminin deposition. Complete Bonferroni post hoc analysis is provided in supplemental table 2.
Collagen IV and Laminin Expression in Tubule Networks
Immunohistochemistry was performed to investigate the production of extracellular matrix proteins, specifically collagen IV and laminin, during tubule formation and stabilization. In order to allow time for collagen IV and laminin synthesis and deposition, staining began with the 2 day timepoint. Images containing high amounts of collagen IV corresponded to areas with extensive tubule formation. Specifically, 0.25 ng/ml PEG-ephrinA1 at 2 days and 25 ng/ml PEG-ephrinA1 at 7 days showed the highest expression (Figure 4B). Complete Bonferroni post hoc analysis is provided in supplemental table 2. Laminin deposition was found to increase over time and was also dependent upon PEG-ephrinA1 concentration (p<0.05). For example, laminin expression increased as more PEG-ephrinA1 was included at both 5 and 7 days (Figure 4C). Looking specifically at 0.25 and 2.5 ng/ml, the increase in pixel intensity from 5 to 7 days is also clearly visible, highlighting the dependence upon time (Figure 4C). Complete Bonferroni post hoc analysis is provided in supplemental table 2.
PEG-ephrinA1 Enhances the In vivo Vascular Response
Hydrogels were implanted into the mouse cornea micropocket to investigate the impact of PEG3- ephrinA1 in vivo. The mouse cornea micropocket facilitates image analysis of angiogenesis using an established and reproducible assay in which the endothelial cells of newly formed vessels are highlighted by a red fluorescence. Using the Flk1-myr::mCherry transgenic mouse, soluble PDGF-BB was shown to stimulate fluorescently-labeled angiogenic processes to grow onto the gel from the surrounding limbus (Figure 5A). The angiogenic response was enhanced with the addition of PEG-ephrinA1 (Figure 5B). The addition of immobilized ephrinA1 allowed prolonged signaling once the vessels had reached the hydrogel, resulting in a significant increase in vessel density (p<0.05, Figure 5C) and vessel branch points (Figure 5D) fourteen days after implantation. Additionally, space filling parameters were also used to quantify vessel morphology. 23 The addition of PEG-ephrinA1 significantly increased both (p<0.05) fractal dimension (E) and lacunarity (F), indicating a greater complexity among the vessel networks where immobilized PEG-ephrinA1 was included. Interestingly, PEG-ephrinA1 induced smaller diameter vessels.
Figure 5.

Bioactive hydrogels incorporating releasable PDGF-BB and PEG-ephrinA1 (B) showed a more robust vascular response than hydrogels with releasable PDGF-BB alone (A) when implanted into the mouse cornea. The presence of PEG-ephrinA1 induced a significant increase in vessel density (C), branch points (D), fractal dimension (E), and lacunarity (F). PEG-ephrinA1 also stimulated a significant decrease in vessel diameter.
DISCUSSION
Rapid vessel formation and perfusion are key to the survival of implanted cells. 26,27 While stable vessels have been formed in engineered constructs using multiple cell types, 28,29 the use of immobilized PEG-ephrinA1 removes the necessity for a supportive cell type by exploiting cell-cell interactions and offering an alternative approach for forming long-lasting tubule structures. 30,31 Specifically, an immobilized ephrinA1 has been used to induce tubule formation for its ability to influence endothelial cell migration and invasion. In 2D, immobilized ephrinA1 led to prolonged tubule formation and branching networks for 4 weeks after cell seeding. In 3D degradable scaffolds, PEG-ephrinA1 induced HUVEC tubule formation as early as 24 hours with persistent tubules up to 7 days. The dose of PEG-ephrinA1 incorporated into the scaffold can also be tailored based on the specific application. Notably, the response to PEG-ephrinA1 may suggest an intermediate dose of PEG-ephrinA1 is optimal for angiogenesis. This complex response has been noted as cells respond to other ephrin molecules. For example, endothelial cells adhered to nitrocellulose coated dishes in a biphasic manner in response to ephrinB1. 32 Similar biphasic responses have been exhibited as axons extended in response to low concentrations of ephrinA2 but extension was inhibited using high concentrations. 33 The capability of ephrins to signal in both forward and reverse manners may enable the complex cellular responses.
The mechanism by which ephrinA1 stabilizes tubule formation may related to production of basement membrane proteins, including laminin and collagen IV, as the basement membrane connects cells to the interstitial matrix and is necessary for tissue development and vessel stabilization. 34 Samples were stained for laminin and collagen IV, and the accumulation of both proteins was shown to depend upon PEG-ephrinA1 concentration. In addition, laminin deposition varied significantly with time in culture. While laminin deposition indicates vessel maturation, 35 collagen IV is largely responsible for the mechanical properties of the basement membrane. 34 Laminins are critical in regulating cell adhesion, migration, and matrix-mediated signaling 36 via interacting with their integrin receptors. Similarly, endothelial cell binding to collagen IV is mediated by integrins, and is necessary for cell adhesion, migration, and proliferation. 37 Interestingly, cell binding to both laminin and collagen IV is regulated by αvβ3 integrin, which is the same integrin that was shown induce endothelial cell adhesion in response to immobilized ephrinA1.10,38 The link between ephrinA1 and laminin production has been previously established in tumor formation as ephrinA1 and EphA2 play a role in tumor neovascularization, enabling tumor growth. 7 Heptocellular carcinoma cell lines that over-expressed ephrinA1 also increased expression of laminin, 39 and aggressive melanoma cells have been found to over-express EphA2 and laminin. 40
To confirm the role of the EphA2-ephrinA1 interaction in tubule formation, soluble EphA2-Fc was used to prevent EphA2-ephrinA1 interaction between HUVECs and HBVP cells (Figure 3). Soluble EphA2-Fc was found to decrease tubule formation on modified hydrogel surfaces in a dose dependent manner. Similar findings were illustrated when soluble EphA2-Fc inhibited vessel formation in a rat aortic ring assay and in vivo Matrigel plus assay in a dose dependent manner. 17 Soluble EphA2 has also been targeted in cancer therapy, where delivery of soluble EphA2 receptors inhibited tumor angiogenesis and disease progression. 41
The presence of PEG-ephrinA1 in hydrogel implants in the mouse cornea induced vessel coverage of the hydrogel with an increase in vessel density and branch points, but a decrease in vessel diameter. This phenomenon has been illustrated previously when Lee et al. generated an MMP-resistant form of vascular endothelial growth factor (VEGF) that caused vessels within MMP-resistant VEGF tumors to display an increased branching but smaller overall diameter. 42 Vessel remodeling involves alterations to cytoskeletal organization, extracellular matrix composition, and cell-cell connections to stabilize vessels. Inhibition of αvβ3 integrins has been shown to prevent remodeling, and αvβ3 integrin binding is likely involved in determining vascular diameter. 43,44 Smooth muscle cell recruitment during vessel stabilization has also been linked to the αvβ3 integrin receptor, and may be an area for future investigation. 45 Interestingly, embroid bodies lacking laminin γ1 displayed an increase in lumen size, consistent with findings in laminin α4 deficient mice. 46 The increase in lumen is possibly due to a weakening of the vessel wall, enhanced sprouting activity, or because a laminin-rich basement membrane is important in polarization of endothelial cells, which is required for lumen formation.
CONCLUSION
The formation of a microvascular system is highly regulated by cell-cell interactions for capillary sprouting and remodeling. In this work, an immobilized ephrinA1 was used to exploit the cell signaling interaction of EphA2 and ephrinA1 seen in angiogenesis. PEG-ephrinA1 was shown to induce HUVEC tubule formation on modified surfaces as well as in 3D degradable hydrogels in a dose dependent manner. The production of collagen IV and laminin, which are extracellular matrix proteins involved in vessel stabilization, was also found to be dependent upon PEG-ephrinA1 concentration. The presence of soluble EphA2 prevented EphA2-ephrinA1 interactions between HUVEC and HBVP cells, reducing tubule formation in a dose dependent manner and confirming the importance of ephrinA1 in tubule formation. Finally, hydrogels incorporating PEG-ephrinA1 in vivo resulted in vessels with a statistically significant increase in vessel density, branch points, lacunarity, and fractal dimension. The results presented demonstrate the utility of the immobilized cell adhesion and patterning molecule ephrinA1 in inducing microvascular network formation for use in tissue engineered constructs and other applications in regenerative medicine.
Supplementary Material
Acknowledgments
This work was supported by NIH grants P20 EB007076, R01 EB005173, R01 HL097520, and R21 EY020632, a National Science Foundation Graduate Research Fellowship (JES), and an AHA Predoctoral Fellowship, 10PRE4190021 (DJG).
Footnotes
Supporting Information Available: Complete images of 3D tubule formation in response to PEG-ephrinA1 concentrations. Complete Bonferroni post hoc analysis of data in figure 2 and 4. This material is available free of charge via the Internet at http://pubs.acs.org.
References
- 1.Heroult M, Schaffner F, Augustin HG. Exp Cell Res. 2006;312:642–650. doi: 10.1016/j.yexcr.2005.10.028. [DOI] [PubMed] [Google Scholar]
- 2.Pasquale EB. Cell. 2008;133:38–52. doi: 10.1016/j.cell.2008.03.011. [DOI] [PubMed] [Google Scholar]
- 3.Pandey A, Shao H, Marks RM, Polverini PJ, Dixit VM. Science. 1995;268:567–569. doi: 10.1126/science.7536959. [DOI] [PubMed] [Google Scholar]
- 4.Brantley DM, Cheng N, Thompson EJ, Lin Q, Brekken RA, Thorpe PE, Muraoka RS, Cerretti DP, Pozzi A, Jackson D, Lin C, Chen J. Oncogene. 2002;21:7011–7026. doi: 10.1038/sj.onc.1205679. [DOI] [PubMed] [Google Scholar]
- 5.Cheng N, Brantley DM, Chen J. Cytokine Growth Factor Rev. 2002;13:75–85. doi: 10.1016/s1359-6101(01)00031-4. [DOI] [PubMed] [Google Scholar]
- 6.Daniel TO, Stein E, Cerretti DP, St John PL, Robert B, Abrahamson DR. Kidney Int Suppl. 1996;57:S73–S81. [PubMed] [Google Scholar]
- 7.Ogawa K, Pasqualini R, Lindberg RA, Kain R, Freeman AL, Pasquale EB. Oncogene. 2000;19:6043–6052. doi: 10.1038/sj.onc.1204004. [DOI] [PubMed] [Google Scholar]
- 8.Cheng N, Brantley DM, Liu H, Lin Q, Enriquez M, Gale N, Yancopoulos G, Cerretti DP, Daniel TO, Chen J. Mol Cancer Res. 2002;1:2–11. [PubMed] [Google Scholar]
- 9.Brantley-Sieders DM, Caughron J, Hicks D, Pozzi A, Ruiz JC, Chen J. J Cell Sci. 2004;117:2037–2049. doi: 10.1242/jcs.01061. [DOI] [PubMed] [Google Scholar]
- 10.Moon JJ, Lee SH, West JL. Biomacromolecules. 2007;8:42–49. doi: 10.1021/bm060452p. [DOI] [PubMed] [Google Scholar]
- 11.Langer R, Vacanti JP. Science. 1993;260:920–926. doi: 10.1126/science.8493529. [DOI] [PubMed] [Google Scholar]
- 12.Hahn MS, McHale MK, Wang E, Schmedlen RH, West JL. Ann Biomed Eng. 2007;35:190–200. doi: 10.1007/s10439-006-9099-3. [DOI] [PubMed] [Google Scholar]
- 13.West JL, Hubbell JA. Macromolecules. 1999;32:241–244. [Google Scholar]
- 14.DeLong SA, Moon JJ, West JL. Biomaterials. 2005;26:3227–3234. doi: 10.1016/j.biomaterials.2004.09.021. [DOI] [PubMed] [Google Scholar]
- 15.Leslie-Barbick JE, Moon JJ, West JL. J Biomater Sci Polym Ed. 2009;20:1763–1779. doi: 10.1163/156856208X386381. [DOI] [PubMed] [Google Scholar]
- 16.Stratman AN, Malotte KM, Mahan RD, Davis MJ, Davis GE. Blood. 2009;114:5091–5101. doi: 10.1182/blood-2009-05-222364. [DOI] [PMC free article] [PubMed] [Google Scholar]
- 17.Dobrzanski P, Hunter K, Jones-Bolin S, Chang H, Robinson C, Pritchard S, Zhao H, Ruggeri B. Cancer Res. 2004;64:910–919. doi: 10.1158/0008-5472.can-3430-2. [DOI] [PubMed] [Google Scholar]
- 18.Roysam B, Shain W, Robey E, Chen Y, Narayanaswamy A, Tsai CL, Al-Kofahi Y, Bjornsson C, Ladi E, Herzmark P. Microsc Microanal. 2008;14:60–61. [Google Scholar]
- 19.Bjornsson CS, Lin G, Al-Kofahi Y, Narayanaswamy A, Smith KL, Shain W, Roysam B. J Neurosci Methods. 2008;170:165–178. doi: 10.1016/j.jneumeth.2007.12.024. [DOI] [PMC free article] [PubMed] [Google Scholar]
- 20.Larina IV, Shen W, Kelly OG, Hadjantonakis AK, Baron MH, Dickinson ME. Anat Rec. 2009;292:333–341. doi: 10.1002/ar.20821. [DOI] [PMC free article] [PubMed] [Google Scholar]
- 21.Poche RA, Larina IV, Scott ML, Saik JE, West JL, Dickinson ME. Dev Dyn. 2009;238:2318–2326. doi: 10.1002/dvdy.21886. [DOI] [PMC free article] [PubMed] [Google Scholar]
- 22.Poche RA, Saik JE, West JL, Dickinson ME. Cold Spring Harb Protoc. 2010;2010 doi: 10.1101/pdb.prot5416. pdb prot5416. [DOI] [PMC free article] [PubMed] [Google Scholar]
- 23.Gould DJ, Vadakkan TJ, Poche RA, Dickinson ME. Microcirculation. 2011;18:136–151. doi: 10.1111/j.1549-8719.2010.00075.x. [DOI] [PMC free article] [PubMed] [Google Scholar]
- 24.Mandelbrot BB. The Fractal Geometry of Nature. 20. Freeman; New York: 1982. [Google Scholar]
- 25.Lopes R, Betrouni N. Med Image Anal. 2009;13:634–649. doi: 10.1016/j.media.2009.05.003. [DOI] [PubMed] [Google Scholar]
- 26.Hegen A, Blois A, Tiron CE, Hellesoy M, Micklem DR, Nor JE, Akslen LA, Lorens JB. J Tissue Eng Regen Med. 2010;5:e52–e62. doi: 10.1002/term.336. [DOI] [PMC free article] [PubMed] [Google Scholar]
- 27.Laschke MW, Harder Y, Amon M, Martin I, Farhadi J, Ring A, Torio-Padron N, Schramm R, Rucker M, Junker D, Haufel JM, Carvalho C, Heberer M, Germann G, Vollmar B, Menger MD. Tissue Eng. 2006;12:2093–2104. doi: 10.1089/ten.2006.12.2093. [DOI] [PubMed] [Google Scholar]
- 28.Chen X, Aledia AS, Ghajar CM, Griffith CK, Putnam AJ, Hughes CC, George SC. Tissue Eng Part A. 2008;15:1363–1371. doi: 10.1089/ten.tea.2008.0314. [DOI] [PMC free article] [PubMed] [Google Scholar]
- 29.Koike N, Fukumura D, Gralla O, Au P, Schechner JS, Jain RK. Nature. 2004;428:138–139. doi: 10.1038/428138a. [DOI] [PubMed] [Google Scholar]
- 30.Jain RK, Au P, Tam J, Duda DG, Fukumura D. Nat Biotechnol. 2005;23:821–823. doi: 10.1038/nbt0705-821. [DOI] [PubMed] [Google Scholar]
- 31.Francis ME, Uriel S, Brey EM. Tissue Eng Part B. 2008;14:19–32. doi: 10.1089/teb.2007.0115. [DOI] [PubMed] [Google Scholar]
- 32.Huynh-Do U, Stein E, Lane AA, Liu H, Cerretti DP, Daniel TO. EMBO J. 1999;18:2165–2173. doi: 10.1093/emboj/18.8.2165. [DOI] [PMC free article] [PubMed] [Google Scholar]
- 33.Rosentreter SM, Davenport RW, Loschinger J, Huf J, Jung J, Bonhoeffer F. J Neurobiol. 1998;37:541–562. [PubMed] [Google Scholar]
- 34.Kruegel J, Miosge N. Cell Mol Life Sci. 2010;67:2879–2895. doi: 10.1007/s00018-010-0367-x. [DOI] [PMC free article] [PubMed] [Google Scholar]
- 35.Risau W, Lemmon V. Dev Biol. 1988;125:441–450. doi: 10.1016/0012-1606(88)90225-4. [DOI] [PubMed] [Google Scholar]
- 36.Hamill KJ, Kligys K, Hopkinson SB, Jones JC. J Cell Sci. 2009;122:4409–4417. doi: 10.1242/jcs.041095. [DOI] [PMC free article] [PubMed] [Google Scholar]
- 37.Khoshnoodi J, Pedchenko V, Hudson BG. Microsc Res Tech. 2008;71:357–370. doi: 10.1002/jemt.20564. [DOI] [PMC free article] [PubMed] [Google Scholar]
- 38.Durbeej M. Cell Tissue Res. 2010;339:259–268. doi: 10.1007/s00441-009-0838-2. [DOI] [PubMed] [Google Scholar]
- 39.Iida H, Honda M, Kawai HF, Yamashita T, Shirota Y, Wang BC, Miao H, Kaneko S. Gut. 2005;54:843–851. doi: 10.1136/gut.2004.049486. [DOI] [PMC free article] [PubMed] [Google Scholar]
- 40.Hendrix MJ, Seftor EA, Hess AR, Seftor RE. Oncogene. 2003;22:3070–3075. doi: 10.1038/sj.onc.1206447. [DOI] [PubMed] [Google Scholar]
- 41.Cheng N, Brantley D, Fang WB, Liu H, Fanslow W, Cerretti DP, Bussell KN, Reith A, Jackson D, Chen J. Neoplasia. 2003;5:445–456. doi: 10.1016/s1476-5586(03)80047-7. [DOI] [PMC free article] [PubMed] [Google Scholar]
- 42.Lee S, Jilani SM, Nikolova GV, Carpizo D, Iruela-Arispe ML. J Cell Biol. 2005;169:681–691. doi: 10.1083/jcb.200409115. [DOI] [PMC free article] [PubMed] [Google Scholar]
- 43.Martinez-Lemus LA, Hill MA, Meininger GA. Physiology. 2009;24:45–57. doi: 10.1152/physiol.00029.2008. [DOI] [PubMed] [Google Scholar]
- 44.Iruela-Arispe ML, Davis GE. Dev Cell. 2009;16:222–231. doi: 10.1016/j.devcel.2009.01.013. [DOI] [PMC free article] [PubMed] [Google Scholar]
- 45.Bendeck MP, Irvin C, Reidy M, Smith L, Mulholland D, Horton M, Giachelli CM. Arterioscler Thromb Vasc Biol. 2000;20:1467–1472. doi: 10.1161/01.atv.20.6.1467. [DOI] [PubMed] [Google Scholar]
- 46.Jakobsson L, Domogatskaya A, Tryggvason K, Edgar D, Claesson-Welsh L. FASEB J. 2008;22:1530–9. doi: 10.1096/fj.07-9617com. [DOI] [PubMed] [Google Scholar]
Associated Data
This section collects any data citations, data availability statements, or supplementary materials included in this article.