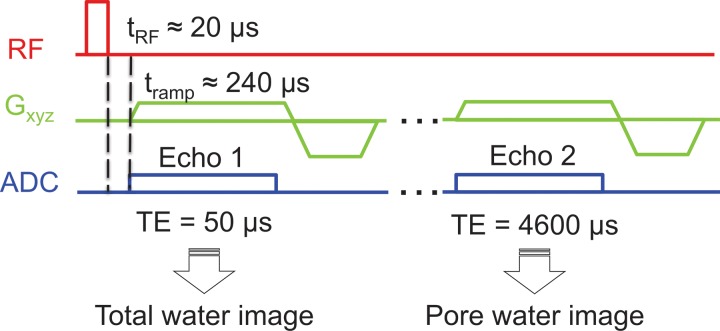
Figure 1:
Graph shows three-dimensional UTE pulse sequence used to generate total and pore water images by sampling two TEs in the same acquisition for in vivo studies. Dashed vertical lines represent the switching delay from “transmit” mode to “receive” mode. ADC = analog-to-digital conversion, Gxyz = magnetic field gradients, μs = μsec, RF = radiofrequency pulses, tramp = ramp time, tRF = radiofrequency pulse duration.

