Abstract
Purpose
To analyze rate, risk factors, and costs associated with 30-day readmission after ovarian cancer surgery.
Patients and Methods
The SEER-Medicare linked database (1992 to 2010) was used to evaluate readmission rates within 30 days of index surgery in patients with stage IIIC/IV ovarian, primary peritoneal, or fallopian tube cancer. Multivariable logistic regression was used to identify factors associated with readmission.
Results
Of 5,152 eligible patients, 1,003 (19.5%) were readmitted within 30 days of discharge. Mean patient age was 75 years. Diagnoses associated with readmission included infection (34.7%), dehydration (34.3%), ileus/obstruction (26.2%), metabolic/electrolyte derangements (23.1%), and anemia (12.3%). In multivariable analysis, year of discharge was significantly associated with 30-day readmission (1996 to 2000: odds ratio [OR], 1.32; 95% CI, 1.01 to 1.71; 2001 to 2005: OR, 1.58; 95% CI, 1.24 to 2.0; 2006 to 2010: OR, 1.73; 95% CI, 1.35 to 2.21; referent years 1992 to 1995), as were length of index hospital stay more than 8 days (OR, 1.39; 95% CI, 1.18 to 1.64) and discharge to a skilled nursing facility (OR, 1.3; 95% CI, 1.04 to 1.63). Patients readmitted within 30 days had a significantly greater 1-year mortality rate compared with patients not readmitted (41.1% v 25.1%, respectively; P < .001). The median cost of readmission hospital stay was $9,220 in year 2010 dollars, with a total cost of $9.3 million over the study period.
Conclusion
Early readmission after surgery for ovarian cancer is common. There is a significant association between 30-day readmission and 1-year mortality. These findings may catalyze development of targeted interventions to decrease early readmission, improve patient outcomes, and control health care costs.
INTRODUCTION
Ovarian cancer continues to be the leading cause of mortality in patients with gynecologic malignancies. In 2014, it is anticipated that there will be 21,980 newly diagnosed patients with ovarian cancer in the United States, with 14,270 deaths.1 Because of the lack of an effective screening strategy, the majority of patients are diagnosed with advanced-stage disease, and treatment relies on surgical resection and adjuvant chemotherapy. Often, these patients suffer from comorbidities that increase operative risk and complicate both postoperative management and the administration of chemotherapy, resulting in unanticipated hospital readmissions. Prior investigators have described single-institution readmission rates of 13% to 17% in this patient population, with significant associated health care costs and an impact on patient quality of life.2
The Patient Protection and Affordable Care Act (PPACA) was signed into law on March 23, 2010, and was subsequently upheld as constitutional by the Supreme Court of the United States on June 28, 2012.3,4 Within the PPACA, hospital readmissions were identified as an area of potential cost savings. Currently, readmission costs for Medicare patients alone are estimated at $26 billion annually, prompting the Centers for Medicare and Medicaid Services (CMS) to create a Hospital Readmissions Reduction Program.3 Within the context of this program, hospitals with excess 30-day readmissions (calculated using an adjustment factor determined by expected v observed readmissions) were penalized with up to a 1% reduction of Medicare payments starting October 2012. This value increased to 2% of regular payments in October 2013 and is anticipated to increase to 3% in 2014. Importantly, it is expected that in 2015 this readmission policy will include surgical procedures. Furthermore, beginning June 2009, CMS began publishing 30-day readmission data for selected medical diseases, and hospital readmission rates have rapidly developed into an important quality of care metric.5
This financial pressure is geared toward motivating medical centers to create systems and structures that will help avoid unplanned readmissions. Within the context of the PPACA, the Community Care Transition Program and the Independence at Home Demonstration Program represent two novel initiatives geared toward driving down hospital readmission and thus controlling Medicare/Medicaid costs.6
Studies exploring 30-day readmission in patients with ovarian cancer have been limited to single institutions with limited generalizability.7 Perhaps the greatest fund of knowledge is in patients discharged after a diagnosis of heart failure, where models predicting and trying to avert readmission have been developed.8–12 Analogously, readmission rates after episodes of care in patients after general or orthopedic surgery have been described.2,5
To optimize patient care and maximize compliance with PPACA mandates, we looked to explore rates of, risk factors associated with, and costs of readmission in a large cohort of patients with ovarian cancer after primary surgery using the national SEER-Medicare linked database.
PATIENTS AND METHODS
Data Source
After institutional review board approval, we conducted a retrospective population-based cohort study using the linked SEER-Medicare database. The SEER program of the National Cancer Institute (NCI) contains approximately 97% of all incident cancer cases from tumor registries that cover 28% of the U.S. population.13,14 The SEER program registries routinely collect data on patient demographics, primary tumor site, tumor morphology, stage, first course of treatment, and vital status. Among patients older than 65 years in SEER data, 93% are identified in the Medicare enrollment file and their records are successfully matched to SEER patients in the linkage process performed by NCI and CMS.13 The Medicare claims database includes all inpatient hospitalizations, outpatient visits, physician/supplier data, durable medical equipment, hospice, and home health care. All claims are longitudinal from the time of a person's Medicare eligibility until death. The NCI also created a hospital file that includes information about hospitals that are part of the SEER-Medicare database. Our analysis data included SEER patients from 1992 to 2009 and their Medicare claims from 1991 to 2010.
Cohort Selection
We identified 38,792 patients with invasive ovarian cancer (SEER primary site code C569) as their first or only primary tumor with a diagnosis date between January 1, 1992, and December 31, 2009. We sequentially removed 287 patients with missing tumor histology, 117 patients with nonepithelial histology, 820 patients with autopsy or death certificate only, 10,468 patients with age at diagnosis less than 66 years old, 3,337 patients with missing tumor stage, 8,731 patients with cancer stage ≤ IIIB, 36 patients with missing diagnosis month, and 4,696 patients who did not have continuous enrollment of Medicare Part A and Part B or who were ever enrolled in a health maintenance organization from the period starting 12 months before diagnosis. Of 10,300 patients who were identified from SEER data, we were able to find 10,097 patients who were Medicare beneficiaries and had records of claims in a Medicare database. We then removed 4,516 patients who did not undergo curative-intent cancer-directed surgery for ovarian cancer using International Classification of Diseases, Ninth Revision, Clinical Modification (ICD-9-CM) procedure codes in inpatient data (Appendix Table 1A, online only), 141 patients with surgery more than 1 year after diagnosis, and 288 patients with in-hospital mortality. A total of 5,152 patients with index surgery during their hospital stay were identified and eligible for analysis.
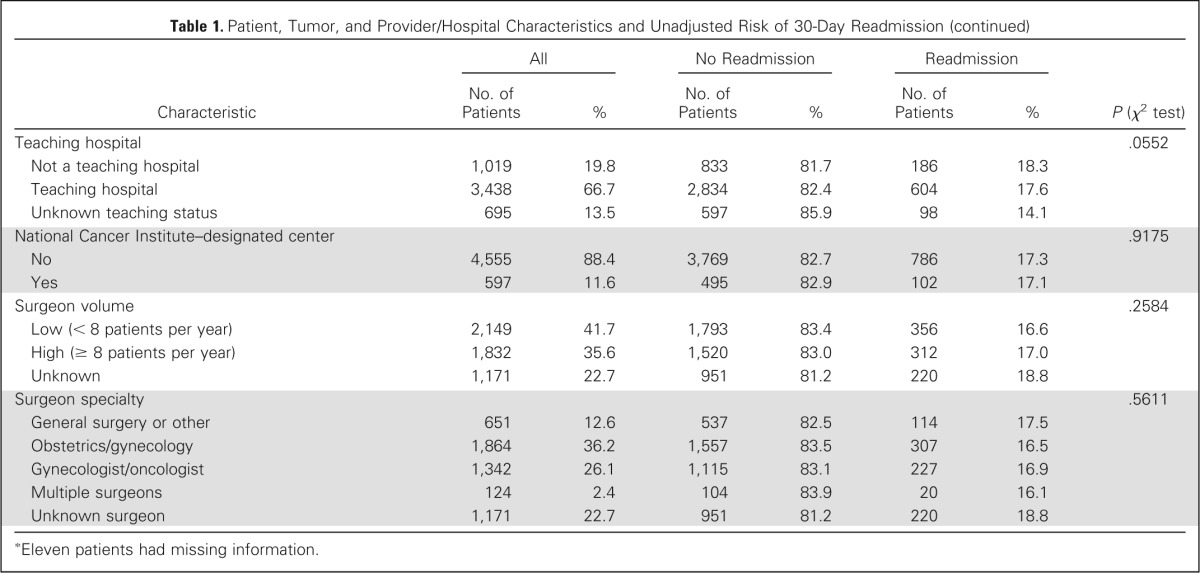
Table 1.
Patient, Tumor, and Provider/Hospital Characteristics and Unadjusted Risk of 30-Day Readmission

| Characteristic | All |
No Readmission |
Readmission |
P (χ2 test) | |||
|---|---|---|---|---|---|---|---|
| No. of Patients | % | No. of Patients | % | No. of Patients | % | ||
| All patients | 5,152 | 100 | 4,264 | 82.8 | 888 | 17.2 | |
| Race | .7501 | ||||||
| White | 4,652 | 90.3 | 3,857 | 82.9 | 795 | 17.1 | |
| Black | 256 | 5.0 | 204 | 79.7 | 52 | 20.3 | |
| Asian | 108 | 2.1 | 89 | 82.4 | 19 | 17.6 | |
| Hispanic | 52 | 1.0 | 44 | 84.6 | 8 | 15.4 | |
| Other | 84 | 1.6 | 70 | 83.3 | 14 | 16.7 | |
| Age, years | .0775 | ||||||
| Mean | 74.8 | 74.7 | 75.2 | ||||
| Standard deviation | 5.8 | 5.8 | 6 | ||||
| Census tract, % of high school graduates* | .0807 | ||||||
| Lowest quartile | 1,285 | 24.9 | 1,059 | 82.4 | 226 | 17.6 | |
| Second quartile | 1,285 | 24.9 | 1,069 | 83.2 | 216 | 16.8 | |
| Third quartile | 1,286 | 25.0 | 1,040 | 80.9 | 246 | 19.1 | |
| Highest quartile | 1,285 | 24.9 | 1,085 | 84.4 | 200 | 15.6 | |
| Census tract, median income* | .3005 | ||||||
| Lowest quartile | 1,285 | 24.9 | 1,050 | 81.7 | 235 | 18.3 | |
| Second quartile | 1,285 | 24.9 | 1,080 | 84.0 | 205 | 16.0 | |
| Third quartile | 1,286 | 25.0 | 1,060 | 82.4 | 226 | 17.6 | |
| Highest quartile | 1,285 | 24.9 | 1,063 | 82.7 | 222 | 17.3 | |
| Charlson score | .002 | ||||||
| 0 | 3,423 | 66.4 | 2,877 | 84.0 | 546 | 16.0 | |
| 1 | 1,112 | 21.6 | 898 | 80.8 | 214 | 19.2 | |
| ≥ 2 | 617 | 12.0 | 489 | 79.3 | 128 | 20.7 | |
| Tumor stage | .0665 | ||||||
| IIIC | 2,801 | 54.4 | 2,343 | 83.6 | 458 | 16.4 | |
| IV | 2,351 | 45.6 | 1,921 | 81.7 | 430 | 18.3 | |
| Discharge year (index stay) | < .001 | ||||||
| 1992-1995 | 897 | 17.4 | 777 | 86.6 | 120 | 13.4 | |
| 1996-2000 | 1,009 | 19.6 | 849 | 84.1 | 160 | 15.9 | |
| 2001-2005 | 1,812 | 35.2 | 1,481 | 81.7 | 331 | 18.3 | |
| 2006-2010 | 1,434 | 27.8 | 1,157 | 80.7 | 277 | 19.3 | |
| Length of index stay, days | < .001 | ||||||
| Mean | 10.7 | 10.4 | 12.7 | ||||
| Standard deviation | 8.6 | 8.2 | 10.2 | ||||
| Index surgery complication | .0025 | ||||||
| No | 4,716 | 91.5 | 3,926 | 83.2 | 790 | 16.8 | |
| Yes | 436 | 8.5 | 338 | 77.5 | 98 | 22.5 | |
| Index discharge type | < .001 | ||||||
| To nursing home | 721 | 14.0 | 553 | 76.7 | 168 | 23.3 | |
| To home | 3,039 | 59.0 | 2,606 | 85.8 | 433 | 14.2 | |
| Other | 1,392 | 27.0 | 1,105 | 79.4 | 287 | 20.6 | |
| Type of index surgery | .0048 | ||||||
| Oophorectomy + omentectomy (± hysterectomy) | 3,788 | 73.5 | 3,174 | 83.8 | 614 | 16.2 | |
| Oophorectomy (± hysterectomy) | 738 | 14.3 | 592 | 80.2 | 146 | 19.8 | |
| Other | 626 | 12.2 | 498 | 79.6 | 128 | 20.4 | |
| Chemotherapy | < .001 | ||||||
| No chemotherapy | 700 | 13.6 | 524 | 74.9 | 176 | 25.1 | |
| Neoadjuvant chemotherapy | 773 | 15.0 | 667 | 86.3 | 106 | 13.7 | |
| Adjuvant chemotherapy | 3,679 | 71.4 | 3,073 | 83.5 | 606 | 16.5 | |
| Hospital volume | .7513 | ||||||
| Low (< 15 patients with ovarian cancer per year) | 4,352 | 84.5 | 3,605 | 82.8 | 747 | 17.2 | |
| High (≥ 15 patients with ovarian cancer per year) | 800 | 15.5 | 659 | 82.4 | 141 | 17.6 | |
| Hospital size | .6822 | ||||||
| Small (< 450 beds) | 2,643 | 51.3 | 2,193 | 83.0 | 450 | 17.0 | |
| Large (≥ 450 beds) | 2,509 | 48.7 | 2,071 | 82.5 | 438 | 17.5 | |
| Teaching hospital | .0552 | ||||||
| Not a teaching hospital | 1,019 | 19.8 | 833 | 81.7 | 186 | 18.3 | |
| Teaching hospital | 3,438 | 66.7 | 2,834 | 82.4 | 604 | 17.6 | |
| Unknown teaching status | 695 | 13.5 | 597 | 85.9 | 98 | 14.1 | |
| National Cancer Institute–designated center | .9175 | ||||||
| No | 4,555 | 88.4 | 3,769 | 82.7 | 786 | 17.3 | |
| Yes | 597 | 11.6 | 495 | 82.9 | 102 | 17.1 | |
| Surgeon volume | .2584 | ||||||
| Low (< 8 patients per year) | 2,149 | 41.7 | 1,793 | 83.4 | 356 | 16.6 | |
| High (≥ 8 patients per year) | 1,832 | 35.6 | 1,520 | 83.0 | 312 | 17.0 | |
| Unknown | 1,171 | 22.7 | 951 | 81.2 | 220 | 18.8 | |
| Surgeon specialty | .5611 | ||||||
| General surgery or other | 651 | 12.6 | 537 | 82.5 | 114 | 17.5 | |
| Obstetrics/gynecology | 1,864 | 36.2 | 1,557 | 83.5 | 307 | 16.5 | |
| Gynecologist/oncologist | 1,342 | 26.1 | 1,115 | 83.1 | 227 | 16.9 | |
| Multiple surgeons | 124 | 2.4 | 104 | 83.9 | 20 | 16.1 | |
| Unknown surgeon | 1,171 | 22.7 | 951 | 81.2 | 220 | 18.8 | |
Eleven patients had missing information.
Outcomes
Thirty-day readmission was defined as readmission to an acute care hospital within 30 days of index discharge. Readmissions excluded hospital transfer or admission for planned chemotherapy. Causes of readmission were examined. Thirty-day, 1-year, and 5-year overall mortality rates after index discharge were compared between readmission and nonreadmission groups. Cost and length of stay for readmission were examined. Total cost of hospital stay was calculated as the sum of the amount that Medicare reimbursed, the amount that was made by a primary payer other than Medicare, total of all claims passed through for the stay, and patients' deductible and Part A coinsurance. Costs were adjusted for inflation and presented in 2010 dollars using consumer price index for medical care services from the Bureau of Labor Statistics.15
Covariates
Covariates included patient, tumor, institutional, clinical, and provider characteristics. Patient characteristics were race/ethnicity (white, black, Asian or Pacific Islander, Hispanic, or other), age at diagnosis, percentage of high school graduates in patient's census tract, and median income of patient's census tract. Patient comorbidities were measured using the Deyo adaptation of the Charlson comorbidity index. Comorbidity scores were calculated using all ICD-9-CM diagnosis codes, procedure codes, and Healthcare Common Procedure Coding System procedure codes included in the inpatient, outpatient, and physician claims in the 12 months before the cancer diagnosis.16,17 To prevent overestimation of comorbidity when using physician or outpatient claims, diagnoses were required to appear on at least two different claims that were more than 30 days apart. Conditions that did not appear on two different claims were not counted as comorbid conditions.18 Tumor characteristics included tumor stage (International Federation of Gynecology and Obstetrics stage IIIC or IV), tumor grade, tumor histology, and tumor size (≤ 5, 5 to 10, or ≥ 10 cm or unknown).
Characteristics of index stay included year of index discharge, length of index stay, surgical complications during index stay (Appendix Table A1), index discharge type (discharge to nursing home or to home), and type of index surgery (oophorectomy and omentectomy with or without hysterectomy, oophorectomy with or without hysterectomy, or other surgery combination). Receipt of chemotherapy was identified if any of the inpatient, outpatient, or physical claims indicated that chemotherapy was administrated (Appendix Table A1). Starting date of chemotherapy and surgery date (estimated by admission date of index stay) were used to determine treatment sequence (no chemotherapy, neoadjuvant chemotherapy, or adjuvant chemotherapy).
Provider/hospital characteristics included hospital volume (< or ≥ 15 patients with ovarian cancer per year), calculated using average annual patient volume from Medicare inpatient data for all stages of invasive ovarian cancer between 1992 and 2010, and hospital size (categorized into < or ≥ 450 beds using median among all hospitals). The number of beds was determined from hospital files provided by SEER-Medicare data. In addition, teaching hospital status (yes, no, or unknown), NCI-designated cancer center (yes or no), and surgeon volume (< or ≥ eight patients per year) were abstracted. Surgeon average annual patient volume, calculated from Medicare physician claims data for all stages of invasive ovarian cancer from 1992 to 2010, and surgeon specialty (general surgery, obstetrics/gynecology, gynecologist/oncologist, multiple surgeons, or unknown) were also abstracted.
Statistical Analysis
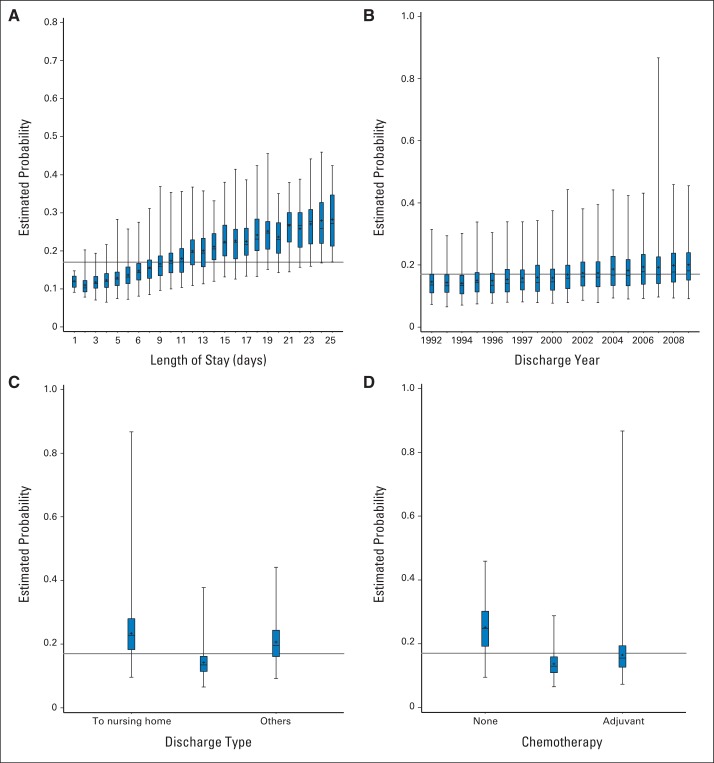
Frequency distribution of patients' demographic, clinical, and provider characteristics was analyzed using the χ2 or Fisher's exact test for categorical variables in bivariate analysis. Multivariable logistic regression was performed to examine the association of covariates with 30-day readmission. The final logistic regression model included variables that showed significance in bivariate analysis and variables that were associated with readmission in the literature and clinical practice. The predicted probability of readmission from the final model was plotted against selected covariates to examine the marginal effect of the predictor (Appendix Fig A1, online only). Short- and long-term overall survival were examined using Kaplan-Meier estimates of survival probability. Overall survival estimates and P values from log-rank tests were produced. After verifying proportionality assumptions, a Cox proportional hazards model was fitted to evaluate effect on survival, adjusting for patient and tumor characteristics. Adjusted hazard ratios (HRs) and their 95% CIs were listed. Patients age and discharge year were treated as categorical variables for bivariate analysis and continuous variables in the model. All P values are two-sided. Statistical analysis was performed using SAS version 9.2 (SAS Institute, Cary, NC).
RESULTS
A total of 5,152 patients who underwent surgery for the treatment of advanced-stage ovarian cancer between January 1992 and December 2009 were eligible for evaluation. Eight hundred eighty-eight patients were readmitted within 30 days of discharge after index surgery, for an overall readmission rate of 17.2%. Of the 888 patients, 105 had two or more readmissions within the 30-day window, for a total of 1,003 readmissions (19.5%).
Patient demographic and tumor and provider/hospital characteristics (in the unadjusted model) are listed in Table 1. All patients were 66 years of age or older (Medicare-linked data set), more than 90% were white, and 66% had a Charlson comorbidity score of 0. By definition, all patients had at least International Federation of Gynecology and Obstetrics stage IIIC epithelial ovarian cancer.
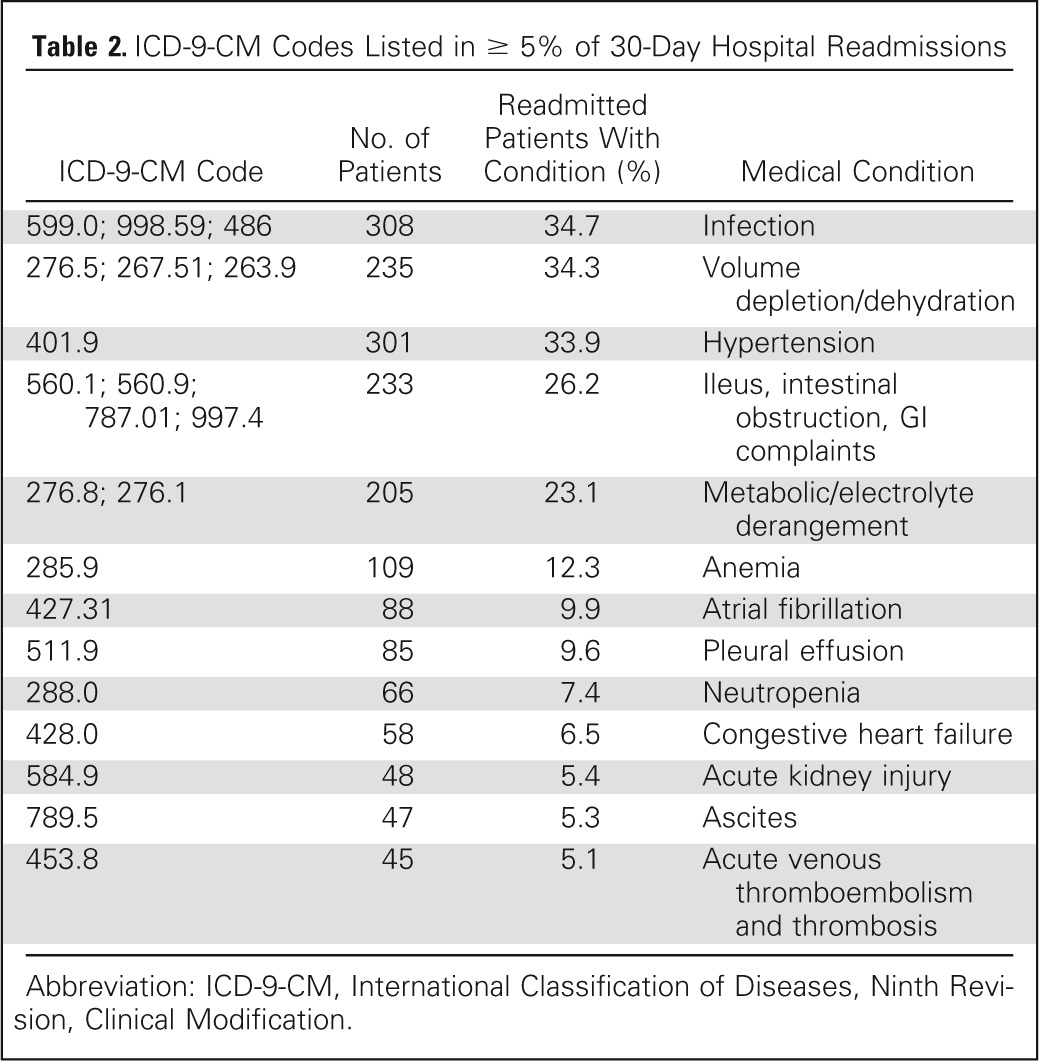
A total of 775 separate ICD-9-CM diagnosis codes were identified and linked to 30-day readmission within the cohort. Codes occurring with a frequency of greater than 5% are listed in Table 2. The most common diagnoses associated with readmission included infection (34.7%); dehydration (34.3%); ileus, obstruction, and GI complaints (nausea/emesis; 26.2%); metabolic/electrolyte derangements (23.1%); and anemia (12.3%).
Table 2.
ICD-9-CM Codes Listed in ≥ 5% of 30-Day Hospital Readmissions
| ICD-9-CM Code | No. of Patients | Readmitted Patients With Condition (%) | Medical Condition |
|---|---|---|---|
| 599.0; 998.59; 486 | 308 | 34.7 | Infection |
| 276.5; 267.51; 263.9 | 235 | 34.3 | Volume depletion/dehydration |
| 401.9 | 301 | 33.9 | Hypertension |
| 560.1; 560.9; 787.01; 997.4 | 233 | 26.2 | Ileus, intestinal obstruction, GI complaints |
| 276.8; 276.1 | 205 | 23.1 | Metabolic/electrolyte derangement |
| 285.9 | 109 | 12.3 | Anemia |
| 427.31 | 88 | 9.9 | Atrial fibrillation |
| 511.9 | 85 | 9.6 | Pleural effusion |
| 288.0 | 66 | 7.4 | Neutropenia |
| 428.0 | 58 | 6.5 | Congestive heart failure |
| 584.9 | 48 | 5.4 | Acute kidney injury |
| 789.5 | 47 | 5.3 | Ascites |
| 453.8 | 45 | 5.1 | Acute venous thromboembolism and thrombosis |
Abbreviation: ICD-9-CM, International Classification of Diseases, Ninth Revision, Clinical Modification.
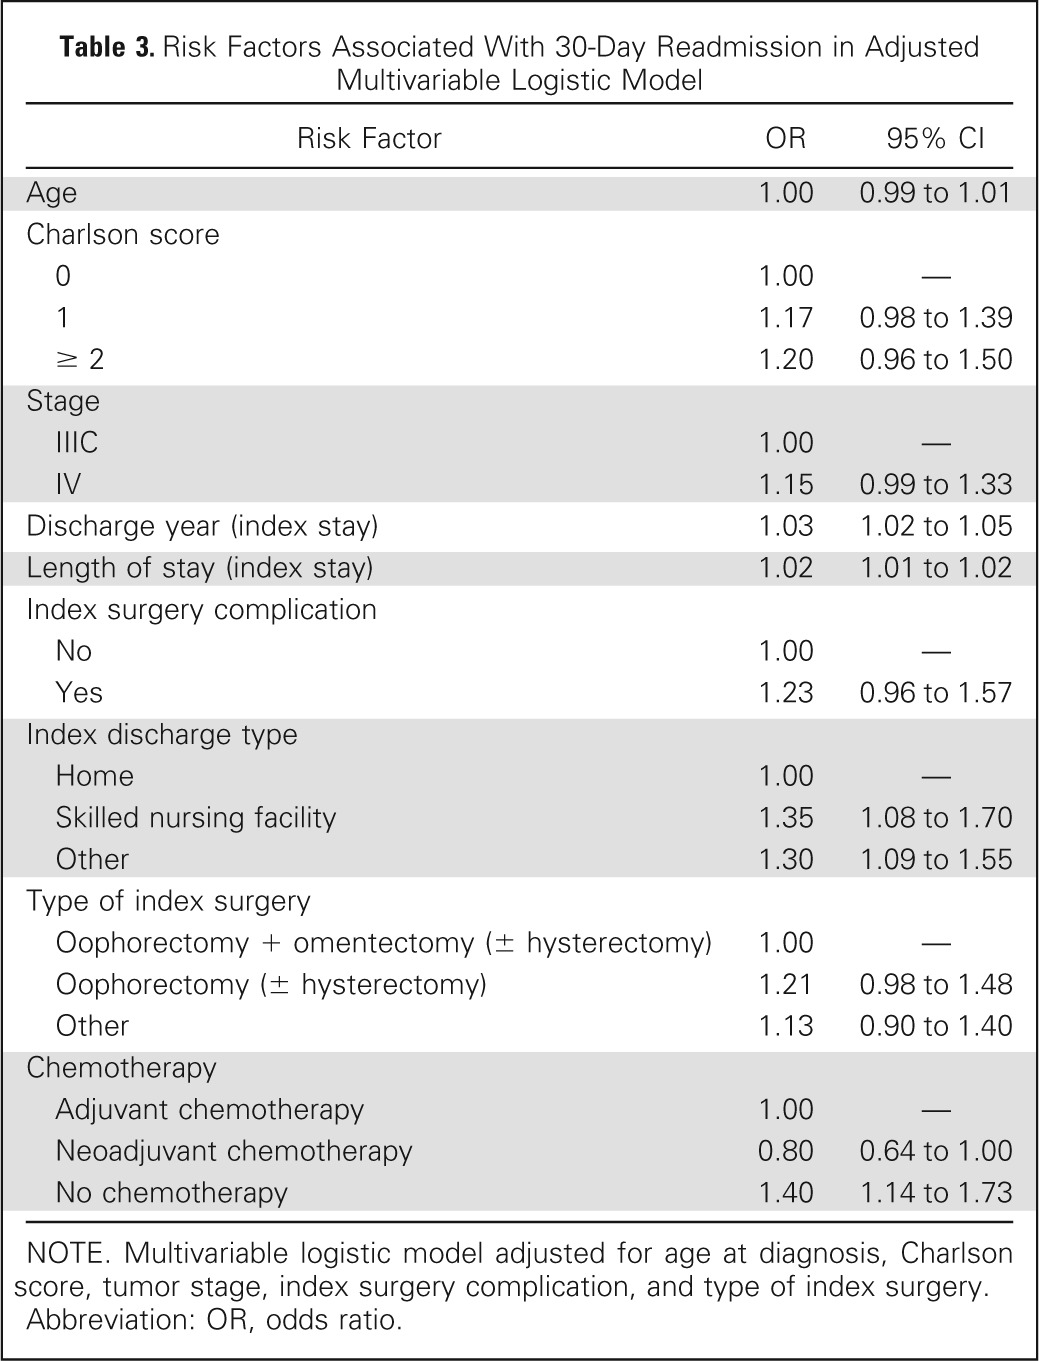
To identify factors associated with 30-day readmission, a multivariable logistic regression analysis was performed. The multivariable model identified discharge year (odds ratio [OR], 1.03; 95% CI, 1.02 to 1.05), length of index stay (OR, 1.02; 95% CI, 1.01 to 1.02), and discharge to skilled nursing facility (OR, 1.35; 95% CI, 1.08 to 1.70) as significant predictors of early readmission after surgery for advanced-stage ovarian cancer (Table 3).
Table 3.
Risk Factors Associated With 30-Day Readmission in Adjusted Multivariable Logistic Model
| Risk Factor | OR | 95% CI |
|---|---|---|
| Age | 1.00 | 0.99 to 1.01 |
| Charlson score | ||
| 0 | 1.00 | — |
| 1 | 1.17 | 0.98 to 1.39 |
| ≥ 2 | 1.20 | 0.96 to 1.50 |
| Stage | ||
| IIIC | 1.00 | — |
| IV | 1.15 | 0.99 to 1.33 |
| Discharge year (index stay) | 1.03 | 1.02 to 1.05 |
| Length of stay (index stay) | 1.02 | 1.01 to 1.02 |
| Index surgery complication | ||
| No | 1.00 | — |
| Yes | 1.23 | 0.96 to 1.57 |
| Index discharge type | ||
| Home | 1.00 | — |
| Skilled nursing facility | 1.35 | 1.08 to 1.70 |
| Other | 1.30 | 1.09 to 1.55 |
| Type of index surgery | ||
| Oophorectomy + omentectomy (± hysterectomy) | 1.00 | — |
| Oophorectomy (± hysterectomy) | 1.21 | 0.98 to 1.48 |
| Other | 1.13 | 0.90 to 1.40 |
| Chemotherapy | ||
| Adjuvant chemotherapy | 1.00 | — |
| Neoadjuvant chemotherapy | 0.80 | 0.64 to 1.00 |
| No chemotherapy | 1.40 | 1.14 to 1.73 |
NOTE. Multivariable logistic model adjusted for age at diagnosis, Charlson score, tumor stage, index surgery complication, and type of index surgery.
Abbreviation: OR, odds ratio.
The crude association between 30-day readmission and 1-year overall survival was examined using Kaplan-Meier estimates. Within the cohort, 1-year mortality rates were 41.4% and 25.1% in the readmission and nonreadmission groups, respectively. This relationship remained statistically significant when controlling for race, age, comorbidity score, stage, tumor size, grade, and histology, with an HR of death of 1.90 (95% CI, 1.69 to 2.14) in the multivariable survival model for 1-year survival and an HR of 1.42 (95% CI, 1.31 to 1.54) in the multivariable survival model for 5-year survival (Fig 1; P < .001). Importantly, 30-day overall mortality contributed minimally to 1-year overall mortality, with 4.1% and 9.5% of patients dying in the nonreadmission and readmission groups within 30 days, respectively (Appendix Table A2, online only).
Fig 1.
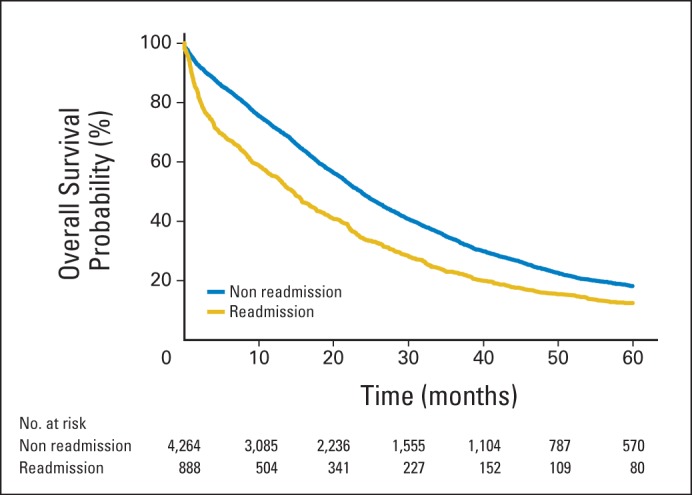
Five-year overall survival stratified by 30-day readmission status.
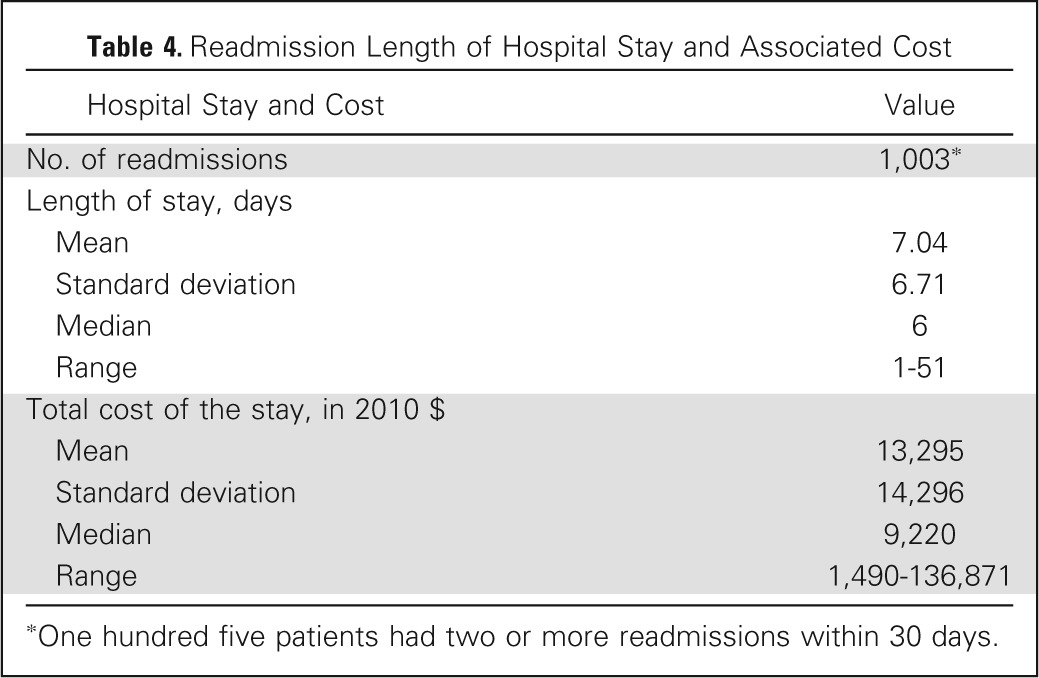
We also looked to determine the financial implications of unanticipated hospital readmission. The mean length of stay associated with readmission was 7 ± 6.7 days, with a range of 1 to 51 days. The median cost of readmission was calculated as $9,220, with a total cost of approximately $9.3 million over the study period ($513,758 per year; Table 4).
Table 4.
Readmission Length of Hospital Stay and Associated Cost
| Hospital Stay and Cost | Value |
|---|---|
| No. of readmissions | 1,003* |
| Length of stay, days | |
| Mean | 7.04 |
| Standard deviation | 6.71 |
| Median | 6 |
| Range | 1-51 |
| Total cost of the stay, in 2010 $ | |
| Mean | 13,295 |
| Standard deviation | 14,296 |
| Median | 9,220 |
| Range | 1,490-136,871 |
One hundred five patients had two or more readmissions within 30 days.
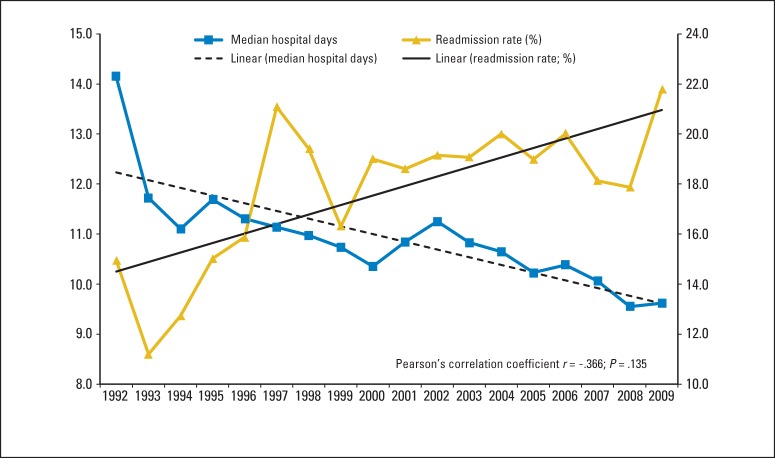
Lastly, the relationship between median length of index hospital stay and 30-day readmission rates was examined (Fig 2). Over the study period spanning from 1992 to 2010, a decline in the median length of index hospital stay (from 14.1 to 9.6 days) was associated with a gradual increase in 30-day readmission rates (from 13.4% to 19.3%; Pearson's correlation coefficient, r = −0.366; P = .135).
Fig 2.
Median length of index hospital stay (days) by discharge year plotted against 30-day readmission rates by year.
DISCUSSION
With implementation of the PPACA, an emphasis has been placed on optimizing patient care while simultaneously controlling health care costs. Specifically, the 30-day readmission rate has been singled out as a quality improvement metric and tied to CMS reimbursements, resulting in significant institutional attention. In addition, unanticipated readmissions are devastating to patients and families and significantly impact quality of life and potentially treatment. Patients with ovarian cancer are recommended to receive adjuvant chemotherapy within 3 to 4 weeks of surgery, and unanticipated hospital admissions may delay initiation of such treatment.19 In this study of patients with advanced-stage ovarian cancer, the 30-day readmission rate, after index admission for surgical cytoreduction, was 17.2%, and increased to more than 19% if multiple readmissions per patient were considered.
Patients with ovarian cancer represent a unique population, subject to both medical and surgical morbidities. Many of these patients have a significant cancer burden and are relatively immunosuppressed, with GI manifestations, ascites, and protein-calorie malnutrition, potentially increasing risk of postoperative morbidity.20 In our analysis, however, Charlson comorbidity score and index surgery complications were not significant predictors of 30-day readmission.
When examining the possible indications for readmission, our results were consistent with prior studies, with infection, failure to thrive/malnutrition, and GI complications ranking among the most commonly reported ICD-9-CM codes at the time of readmission.2,5,7,21,22 In the general surgery literature, postoperative blood transfusion, dehydration, and infection have been associated with higher rates of readmission.23–25
In alternate disease states, an aggressive effort has been made to identify risk factors for 30-day readmission and to implement critical and system-based prevention strategies. As described by Atul Gawande, the sickest, most difficult patients account for a disproportionate share of health care expenditure, and adoption of innovative strategies may help reduce readmission rates and control costs, while simultaneously improving patient outcomes.26 As part of the desire to identify and prevent readmissions, we also looked to explore the association between length of index hospital stay and 30-day readmission. In the entire cohort, index length of stay greater than 8 days was associated with a significant risk of readmission, supporting the findings of prior authors.27 Efforts by nurses, physicians, social workers, and home health aides may help identify patients with prolonged index stays, facilitating a multidisciplinary approach in preventing readmission following discharge.
Interestingly, a nonsignificant inverse relationship between median length of index hospital stay and 30-day readmission rates was seen over the study period spanning from 1992 to 2010 and may imply that pressure for rapid disposition after surgery may leave patients at risk for unanticipated readmission (Fig 2). As the health care delivery model evolves, patients are increasingly discharged to transitional care facilities, and coordination and continuity of care may be compromised.28 To maximize the odds of a safe transition, communication, patient and family education, accurate medication reconciliation, and short-interval outpatient follow-up are essential.29 Patients with ovarian cancer represent a vulnerable population because of their age, complex medical regimens, and comorbidities, and fragmentation of care may leave them susceptible to unanticipated readmission. Currently, lack of integrated health delivery systems and uniform electronic medical records, an overburdened work force, and lack of financial incentives serve as barriers toward coordination of care in the outpatient setting.29 Furthermore, early evaluation after discharge has been identified as critical in the care of complex patients, and utilization of allied health professionals in conjunction with physicians may permit extended office hours and early follow-up, driving down 30-day readmission rates. Too often, the emergency department is used for postoperative see-and-treat visits that are costly and avoidable and commonly result in hospital readmission.30
Interestingly, high-volume surgeons, surgical subspecialists, and high-volume institutions were not associated with a reduction in unanticipated hospital readmission. This is consistent with prior publications, which have failed to show a beneficial impact of provider or hospital volume on 30-day readmission rates.31,32 Patients with advanced-stage ovarian cancer suffer from medical comorbidities that complicate recovery and may leave them vulnerable to readmission independent of surgical complications. These factors, such as malnutrition, ascites, and overall poor health, are not strongly influenced by provider or hospital characteristics.
Our study has several limitations. First, the use of the 30-day metric has been criticized as a quality measure because it does not have a clear biologic, clinical, or therapeutic evidence base.33 Despite significant improvements in total hospital admissions, length of stay, and in-hospital mortality, 30-day readmission remains as the stand-alone measure not demonstrating progress. Others are concerned that the focus on reduction of readmission may divert financial support from other important quality-of-care and safety initiatives, compromising true progress in comprehensive patient care. Limitations associated with use of SEER-Medicare linked data include the absence of patients ≤ 65 years old and exclusion of patients enrolled in managed care plans, both of which have an unpredictable effect on calculated 30-day readmission rates and may limit the generalizability of our findings. In addition, the database is updated periodically, contains only observational data, and may not reflect contemporary trends. The strengths of our study include the large population studied (5,152 eligible patients), reliability of data contained, and the broad geographic area captured in the SEER-Medicare database.
In conclusion, among patients ≥ 66 years old with advanced ovarian cancer after index surgery, 30-day readmission rates remain high. Multivariable logistic regression identified discharge year, length of index hospital stay, and discharge to skilled nursing facility as independently associated with readmission. Prospective collection of data across multiple centers, with broader inclusion criteria, may allow for better identification of risk factors and the development of effective interventions.
Appendix
Table A1.
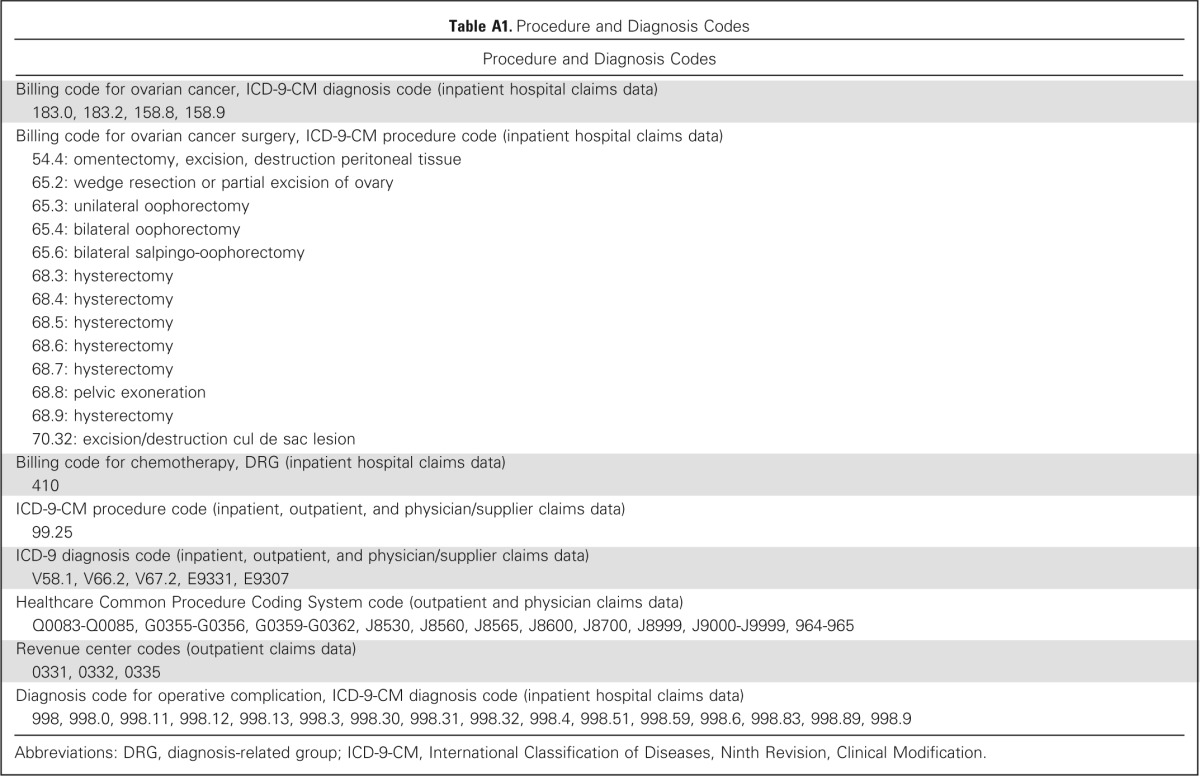
Procedure and Diagnosis Codes
| Procedure and Diagnosis Codes |
|---|
| Billing code for ovarian cancer, ICD-9-CM diagnosis code (inpatient hospital claims data) |
| 183.0, 183.2, 158.8, 158.9 |
| Billing code for ovarian cancer surgery, ICD-9-CM procedure code (inpatient hospital claims data) |
| 54.4: omentectomy, excision, destruction peritoneal tissue |
| 65.2: wedge resection or partial excision of ovary |
| 65.3: unilateral oophorectomy |
| 65.4: bilateral oophorectomy |
| 65.6: bilateral salpingo-oophorectomy |
| 68.3: hysterectomy |
| 68.4: hysterectomy |
| 68.5: hysterectomy |
| 68.6: hysterectomy |
| 68.7: hysterectomy |
| 68.8: pelvic exoneration |
| 68.9: hysterectomy |
| 70.32: excision/destruction cul de sac lesion |
| Billing code for chemotherapy, DRG (inpatient hospital claims data) |
| 410 |
| ICD-9-CM procedure code (inpatient, outpatient, and physician/supplier claims data) |
| 99.25 |
| ICD-9 diagnosis code (inpatient, outpatient, and physician/supplier claims data) |
| V58.1, V66.2, V67.2, E9331, E9307 |
| Healthcare Common Procedure Coding System code (outpatient and physician claims data) |
| Q0083-Q0085, G0355-G0356, G0359-G0362, J8530, J8560, J8565, J8600, J8700, J8999, J9000-J9999, 964-965 |
| Revenue center codes (outpatient claims data) |
| 0331, 0332, 0335 |
| Diagnosis code for operative complication, ICD-9-CM diagnosis code (inpatient hospital claims data) |
| 998, 998.0, 998.11, 998.12, 998.13, 998.3, 998.30, 998.31, 998.32, 998.4, 998.51, 998.59, 998.6, 998.83, 998.89, 998.9 |
Abbreviations: DRG, diagnosis-related group; ICD-9-CM, International Classification of Diseases, Ninth Revision, Clinical Modification.
Table A2.
Thirty-Day, 1-Year, and 5-Year Overall Mortality in the Readmission and No Readmission Groups

| Mortality | No. of Patients | Mortality Rate (%) |
|
|---|---|---|---|
| No Readmission | Readmission | ||
| 30-day mortality | |||
| All patients | 5,152 | 4.1 | 9.2 |
| Charlson comorbidity score | |||
| 0 | 3,423 | 3.5 | 8.2 |
| 1 | 1,112 | 4.2 | 8.4 |
| ≥ 2 | 617 | 7.0 | 14.8 |
| 1-year mortality | |||
| All patients | 5,152 | 25.1 | 41.4 |
| Charlson comorbidity score | |||
| 0 | 3,423 | 21.9 | 36.5 |
| 1 | 1,112 | 28.8 | 45.3 |
| ≥ 2 | 617 | 37.0 | 56.2 |
| 5-year mortality | |||
| All patients | 5,152 | 75.3 | 82.2 |
| Charlson comorbidity score | |||
| 0 | 3,423 | 73.6 | 79.5 |
| 1 | 1,112 | 77.2 | 85.5 |
| ≥ 2 | 617 | 81.8 | 88.3 |
Fig A1.
Predicted probability of readmission plotted against selected covariates to examine the marginal effect of the predictor: (A) length of stay, (B) discharge year, (C) discharge type, and (D) chemotherapy administration.
Footnotes
Supported by the Ruth L. Kirschstein National Research Service Award Institutional Training Research Grant No. 2T32 CA06039611 and a kind gift from the Queen of Hearts Foundation.
Presented at the 2014 Society of Gynecologic Oncology 45th Annual Meeting on Women's Cancer, Tampa, FL, March 22-25, 2014.
Authors' disclosures of potential conflicts of interest are found in the article online at www.jco.org. Author contributions are found at the end of this article.
AUTHORS' DISCLOSURES OF POTENTIAL CONFLICTS OF INTEREST
Disclosures provided by the authors are available with this article at www.jco.org.
AUTHOR CONTRIBUTIONS
Conception and design: All authors
Collection and assembly of data: All authors
Data analysis and interpretation: All authors
Manuscript writing: All authors
Final approval of manuscript: All authors
AUTHORS' DISCLOSURES OF POTENTIAL CONFLICTS OF INTEREST
Evaluation of 30-Day Hospital Readmission After Surgery for Advanced-Stage Ovarian Cancer in a Medicare Population
The following represents disclosure information provided by authors of this manuscript. All relationships are considered compensated. Relationships are self-held unless noted. I = Immediate Family Member, Inst = My Institution. For a detailed description of the disclosure categories, or for more information about ASCO's conflict of interest policy, please refer to the Author Disclosure Declaration and the Disclosures of Potential Conflicts of Interest section in Information for Contributors.
Ramez N. Eskander
No relationship to disclose
Jenny Chang
No relationship to disclose
Argyrios Ziogas
No relationship to disclose
Hoda Anton-Culver
No relationship to disclose
Robert E. Bristow
No relationship to disclose
REFERENCES
- 1.Siegel R, Ma J, Zou Z, et al. Cancer statistics, 2014. CA Cancer J Clin. 2014;64:9–29. doi: 10.3322/caac.21208. [DOI] [PubMed] [Google Scholar]
- 2.Henretta MS, Scalici JM, Engelhard CL, et al. The revolving door: Hospital readmissions of gynecologic oncology patients. Gynecol Oncol. 2011;122:479–483. doi: 10.1016/j.ygyno.2011.05.011. [DOI] [PubMed] [Google Scholar]
- 3.Centers for Medicare and Medicaid Services, Department of Health and Human Services. Patient Protection and Affordable Care Act; maximizing January 1, 2014 coverage opportunities: Interim final rule with comment period. Fed Regist. 2013;78:76212–76218. [PubMed] [Google Scholar]
- 4.Lampton LM. The U.S. Supreme Court decision on PPACA. J Miss State Med Assoc. 2012;53:169–170. [PubMed] [Google Scholar]
- 5.Kassin MT, Owen RM, Perez SD, et al. Risk factors for 30-day hospital readmission among general surgery patients. J Am Coll Surg. 2012;215:322–330. doi: 10.1016/j.jamcollsurg.2012.05.024. [DOI] [PMC free article] [PubMed] [Google Scholar]
- 6.Sade RM. Introduction: The Health Care Reform Law (PPACA)—Controversies in ethics and policy. J Law Med Ethics. 2012;40:523–525. doi: 10.1111/j.1748-720X.2012.00684.x. [DOI] [PMC free article] [PubMed] [Google Scholar]
- 7.Fauci JM, Schneider KE, Frederick PJ, et al. Assessment of risk factors for 30-day hospital readmission after surgical cytoreduction in epithelial ovarian carcinoma. Int J Gynecol Cancer. 2011;21:806–810. doi: 10.1097/IGC.0b013e3182157a19. [DOI] [PubMed] [Google Scholar]
- 8.Wasfy JH, Rosenfield K, Zelevinsky K, et al. A prediction model to identify patients at high risk for 30-day readmission after percutaneous coronary intervention. Circ Cardiovasc Qual Outcomes. 2013;6:429–435. doi: 10.1161/CIRCOUTCOMES.111.000093. [DOI] [PubMed] [Google Scholar]
- 9.Mazimba S, Grant N, Parikh A, et al. Heart failure performance measures: Do they have an impact on 30-day readmission rates? Am J Med Qual. 2013;28:324–329. doi: 10.1177/1062860612465066. [DOI] [PubMed] [Google Scholar]
- 10.Laskey WK, Ricciardi MJ. 30-day readmission rate following percutaneous coronary intervention: Much more than a binary variable. JACC Cardiovasc Interv. 2013;6:245–246. doi: 10.1016/j.jcin.2012.12.119. [DOI] [PubMed] [Google Scholar]
- 11.Hernandez MB, Schwartz RS, Asher CR, et al. Predictors of 30-day readmission in patients hospitalized with decompensated heart failure. Clin Cardiol. 2013;36:542–547. doi: 10.1002/clc.22180. [DOI] [PMC free article] [PubMed] [Google Scholar]
- 12.Schmeida M, Savrin RA. Heart failure rehospitalization of the Medicare FFS patient: A state-level analysis exploring 30-day readmission factors. Prof Case Manag. 2012;17:155–161. doi: 10.1097/NCM.0b013e31824c5fca. [DOI] [PubMed] [Google Scholar]
- 13.Warren JL, Klabunde CN, Schrag D, et al. Overview of the SEER-Medicare data: Content, research applications, and generalizability to the United States elderly population. Med Care. 2002;40(suppl):IV-3–18. doi: 10.1097/01.MLR.0000020942.47004.03. [DOI] [PubMed] [Google Scholar]
- 14.Klabunde CN, Warren JL, Legler JM. Assessing comorbidity using claims data: An overview. Med Care. 2002;40(suppl):IV-26–35. doi: 10.1097/00005650-200208001-00004. [DOI] [PubMed] [Google Scholar]
- 15.US Department of Labor. Bureau of Labor Statistics Consumer Price Index: All Urban Consumers–US Medical Care Services. http://data.bls.gov/cgi-bin/surveymost.
- 16.Deyo RA, Cherkin DC, Ciol MA. Adapting a clinical comorbidity index for use with ICD-9-CM administrative databases. J Clin Epidemiol. 1992;45:613–619. doi: 10.1016/0895-4356(92)90133-8. [DOI] [PubMed] [Google Scholar]
- 17.Charlson ME, Pompei P, Ales KL, et al. A new method of classifying prognostic comorbidity in longitudinal studies: Development and validation. J Chronic Dis. 1987;40:373–383. doi: 10.1016/0021-9681(87)90171-8. [DOI] [PubMed] [Google Scholar]
- 18.Klabunde CN, Potosky AL, Legler JM, et al. Development of a comorbidity index using physician claims data. J Clin Epidemiol. 2000;53:1258–1267. doi: 10.1016/s0895-4356(00)00256-0. [DOI] [PubMed] [Google Scholar]
- 19.Mahner S, Eulenburg C, Staehle A, et al. Prognostic impact of the time interval between surgery and chemotherapy in advanced ovarian cancer: Analysis of prospective randomised phase III trials. Eur J Cancer. 2013;49:142–149. doi: 10.1016/j.ejca.2012.07.023. [DOI] [PubMed] [Google Scholar]
- 20.Rezk Y, Timmins PF, 3rd, Smith HS. Review article: Palliative care in gynecologic oncology. Am J Hosp Palliat Care. 2011;28:356–374. doi: 10.1177/1049909110392204. [DOI] [PubMed] [Google Scholar]
- 21.McPhee JT, Nguyen LL, Ho KJ, et al. Risk prediction of 30-day readmission after infrainguinal bypass for critical limb ischemia. J Vasc Surg. 2013;57:1481–1488. doi: 10.1016/j.jvs.2012.11.074. [DOI] [PubMed] [Google Scholar]
- 22.Kaplan B, Sweeney JF. Assessing 30-day hospital readmission after renal transplantation: A complex task. Am J Transplant. 2012;12:3171–3172. doi: 10.1111/j.1600-6143.2012.04289.x. [DOI] [PubMed] [Google Scholar]
- 23.Schneider EB, Hyder O, Wolfgang CL, et al. Patient readmission and mortality after surgery for hepato-pancreato-biliary malignancies. J Am Coll Surg. 2012;215:607–615. doi: 10.1016/j.jamcollsurg.2012.07.007. [DOI] [PMC free article] [PubMed] [Google Scholar]
- 24.Schneider EB, Hyder O, Brooke BS, et al. Patient readmission and mortality after colorectal surgery for colon cancer: Impact of length of stay relative to other clinical factors. J Am Coll Surg. 2012;214:390–398. doi: 10.1016/j.jamcollsurg.2011.12.025. [DOI] [PubMed] [Google Scholar]
- 25.Wick EC, Shore AD, Hirose K, et al. Readmission rates and cost following colorectal surgery. Dis Colon Rectum. 2011;54:1475–1479. doi: 10.1097/DCR.0b013e31822ff8f0. [DOI] [PubMed] [Google Scholar]
- 26.Gawande A. The hot spotters: Can we lower medical costs by giving the neediest patients better care? New Yorker. http://www.newyorker.com/magazine/2011/01/24/the-hot-spotters. [PubMed]
- 27.Hannan EL, Zhong Y, Krumholz H, et al. 30-day readmission for patients undergoing percutaneous coronary interventions in New York state. JACC Cardiovasc Interv. 2011;4:1335–1342. doi: 10.1016/j.jcin.2011.08.013. [DOI] [PubMed] [Google Scholar]
- 28.Coleman EA, Berenson RA. Lost in transition: Challenges and opportunities for improving the quality of transitional care. Ann Intern Med. 2004;141:533–536. doi: 10.7326/0003-4819-141-7-200410050-00009. [DOI] [PubMed] [Google Scholar]
- 29.Hernandez AF, Greiner MA, Fonarow GC, et al. Relationship between early physician follow-up and 30-day readmission among Medicare beneficiaries hospitalized for heart failure. JAMA. 2010;303:1716–1722. doi: 10.1001/jama.2010.533. [DOI] [PubMed] [Google Scholar]
- 30.Dharmarajan K, Hsieh AF, Lin Z, et al. Diagnoses and timing of 30-day readmissions after hospitalization for heart failure, acute myocardial infarction, or pneumonia. JAMA. 2013;309:355–363. doi: 10.1001/jama.2012.216476. [DOI] [PMC free article] [PubMed] [Google Scholar]
- 31.Mäkelä KT, Häkkinen U, Peltola M, et al. The effect of hospital volume on length of stay, re-admissions, and complications of total hip arthroplasty. Acta Orthop. 2011;82:20–26. doi: 10.3109/17453674.2010.533930. [DOI] [PMC free article] [PubMed] [Google Scholar]
- 32.Goodney PP, Stukel TA, Lucas FL, et al. Hospital volume, length of stay, and readmission rates in high-risk surgery. Ann Surg. 2003;238:161–167. doi: 10.1097/01.SLA.0000081094.66659.c3. [DOI] [PMC free article] [PubMed] [Google Scholar]
- 33.Vaduganathan M, Bonow RO, Gheorghiade M. Thirty-day readmissions: The clock is ticking. JAMA. 2013;309:345–346. doi: 10.1001/jama.2012.205110. [DOI] [PubMed] [Google Scholar]


