

Abstract
Microglia are resident macrophages in the CNS that scavenge pathogens, dying cells, and molecules using pattern recognition Toll-like receptors (TLRs). Nuclear factor of activated T-cells (NFAT) family transcription factors also regulate inflammatory responses in microglia. However, whether there exists cross talk between TLR and NFAT signaling is unclear. Here we show that chronic activation of murine microglia by prolonged stimulation of Toll-like receptor 4 (TLR4) ligand lipopolysaccharides (LPSs) leads to unexpected translocation of NFAT1 into mitochondria. This mitochondrial import of NFAT1 is independent of calcium/calcineurin signaling. Instead, inhibition of Toll/interleukin 1 receptor domain-containing adapter-inducing interferon-β (TRIF) pathway blocks the mitochondrial translocation of NFAT1. Functionally, inhibition of NFAT1 reduces the TRIF-mediated expression of interferon-β and compromises the production of ATP and reactive oxygen species in LPS-treated microglia. Therefore, our findings reveal a new inflammatory signaling pathway that links TLR with NFAT in regulating cytokine production and mitochondrial activity during chronic microglial activation.
SIGNIFICANCE STATEMENT Nuclear factor of activated T-cells (NFAT) family transcription factors are known to undergo nuclear translocation in response to inflammatory stimulation. In this study, we uncovered a surprise transportation of NFATs into mitochondria in microglia after a prolonged treatment with bacteria endotoxin lipopolysaccharides (LPSs). LPSs activated Toll-like receptor 4 and its downstream Toll/interleukin 1 receptor-domain-containing adapter-inducing interferon-β (TRIF) to regulate the mitochondrial translocation of NFAT in microglia, whereas genetic inhibition of NFAT1 compromised TRIF-mediated cytokine production and reduced ATP and reactive oxygen species generation. These findings reveal a previously undescribed mitochondrial translocation of NFAT in microglia responding to extended activation of Toll-like receptor-mediated signaling transduction pathways.
Keywords: microglia, mitochondria, neuroinflammation, NFAT, Toll-like receptor
Introduction
Microglia are the primary immune cells in the CNS to protect against the pathogen infection (Rock et al., 2004). Lipopolysaccharides (LPSs), the main component of the outer membrane of the Gram-negative bacterial cell wall, is widely used to stimulate the activation of microglia (Rietschel and Brade, 1992). Toll-like receptor 4 (TLR4) is the main TLR receptor for LPSs in mammals (Poltorak et al., 1998). The TLR4-MD2 complex and CD14 coreceptor are necessary and sufficient to transduce LPS stimulations in immune cells by recruiting both myeloid differentiation primary response protein 88 (MyD88) and Toll/interleukin 1 receptor (TIR)-domain-containing adapter-inducing interferon-β (TRIF)-dependent pathways, which leads to the activation of transcription factors such as nuclear factor-κ B, activator protein 1, and interferon regulatory factor 3, resulting in induction or suppression of genes involving in the inflammatory response (Kawai and Akira, 2010).
NFAT comprises a family of transcription factors also important for regulating immune responses (Macian, 2005). With the exception of NFAT5, the activity of NFAT1–NFAT4 is controlled by the calcium/calcineurin signaling that allows the translocation of NFATs from cytosol to the nucleus (Crabtree and Olson, 2002). There are speculations about potential cross talk between TLR and NAFT signaling pathways. An early study in mouse dendritic cells shows that LPSs can induce the nuclear translocation of NFAT; however, the initiation of this process is exclusively dependent on the CD14-mediated calcium mobilization (Zanoni et al., 2009). Meanwhile, the same study also suggests that LPSs cannot trigger calcium influx and NFAT activation in the periphery macrophages. Although microglia share the same lineage with macrophages and other monocytes during development, they possess distinct characteristics in the resting/ramified and reactive/amoeboid states (Rock et al., 2004). Whether LPSs can activate NFAT pathway in microglia remains to be determined.
To study the effect of LPSs on the NFAT-mediated signaling pathway in microglia, we exposed primary cultured mouse microglia with prolonged LPS stimulation to better mimic the bacterial infection in vivo. Surprisingly, we found that LPSs induced mitochondrial translocation of NFAT1 in microglia. We further identified that the C-terminal mitochondria targeting motif of NFAT1 was critical for the import of NFAT1 into the mitochondria. In addition, the mitochondrial translocation of NFAT1 was independent of the classic calcium/calcineurin signaling, but relied on the TRIF-dependent endocytic pathway. To investigate the functional consequence of NFAT1 mitochondrial translocation, we treated Nfat1 knock-out (Nfat1−/−) mice and their littermate controls with TLR-grade LPSs (TLR-LPSs) and demonstrated that the microglia in the striatum of Nfat1−/− mice were less activated than those in their littermate controls. Therefore, our findings reveal a new signaling pathway in microglia that couples TLR4 activation with the translocation of NFAT1 into mitochondria to control the microglial activation during brain infection.
Materials and Methods
Animals.
Nfat1 knock-out mice were purchased from the Mutant Mouse Regional Resource Centers as described previously (Xanthoudakis et al., 1996). All of the mice were housed in a 12 h light/dark cycle and fed a regular diet ad libitum. All mouse work followed the guidelines approved by the Institutional Animal Care and Use Committees of the National Institute of Child Health and Human Development and Beijing Normal University.
Antibodies and chemicals.
Regular and TLR-grade LPSs (Escherichia coli; Serotype O111:B4, S-form) was purchased from Enzo Life Sciences; EGTA (molecular biology grade) and dynamin inhibitor dynasore were purchased from Calbiochem. The TLR ligands, such as Pam3 [Pam3Cys-Ser-(Lys) 4.3HCl], MALP-2, poly (I:C) (polyinosinic-polycytidylic acid K), taxol, R848 (C17H22N4O2), and ODN1668 (5'-tccatgacgttcctgatgct-3'), were purchased from Enzo Life Sciences. Flagellin was purchased from InvivoGen, and cyclosporin A from Sigma-Aldrich. The Vectastain Elite ABC Kit and ImmPACT DAB Peroxidase Substrate Kit were purchased from Vector Laboratories. The NFAT antibodies used for immunocytochemistry were purchased from Santa Cruz Biotechnology, including NFAT1 (NFATc2, M-300), NFAT2 (NFATc1, H-110), NFAT3 (NFATc4, H-74), and NFAT4 (NFATc3, M-75) antibodies. The other antibodies used for immunocytochemistry were ionized calcium-binding adaptor molecule-1 (Iba1; rabbit, Wako Chemicals; goat, Abcam), MyD88 (N-19; Santa Cruz Biotechnology), TICAM1 (Imgenex), and OxPhos complex IV subunit I (COX1; Invitrogen).
Primary microglial cell cultures.
Mixed glial cell culture was prepared from postnatal day 4 pups of either sex. Briefly, each individual cortex was subjected to papain digestion (Worthington Biochemical) for 30 min at 37°C. The digested tissue was washed three times and carefully triturated with DMEM (12–604F; Lonza) supplemented with 10% FBS, 10 U/ml penicillin, and 10 μg/ml streptomycin (Invitrogen) into cell suspension, plated to 75 cm2 flasks, and maintained at 37°C in a 95% O2 and 5% CO2 humidified incubator. Medium was changed on days in vitro (DIV) 1, 4, and 7. At 10 DIV, 10 ml of fresh medium was added into the flasks, and the flasks were shaken for 30 min at room temperature. The medium was collected and centrifuged at 400 × g for 7 min. The pelleted microglia were resuspended in DMEM with 5% FBS and seeded in 24-well and 6-well plates for cell biology or biochemistry study.
Transfection of primary microglial cells.
Primary microglial cells were transfected at 24 h after seeding using the CalPhos Mammalian Transfection Kit (Clontech Laboratories). Microglia were incubated with the DNA-calcium phosphate precipitate for ∼3 h. The precipitate was then dissolved by the incubation of the cells in a medium that had been preequilibrated in a 10% CO2 incubator. The cells were in turn transferred to their original conditioned medium and fixed at ∼24–48 h after transfection (Jiang and Chen, 2006). Green fluorescent protein (GFP)-tagged NFAT expression vector was a gift from Dr. Zhihua Liu (Biophysics Institute, Chinese Academy of Sciences, Beijing, China).
Transfection of small interfering RNA.
Primary microglial cells were transfected with the preselected small interfering RNAs (siRNAs; Qiagen, FlexiTube technology) against mouse Nfat1, Trif, and Myd88 genes. The transfection was performed using the HiperFect Transfection reagent (Qiagen) according to manufacturer's instructions. Microglia were fixed in 4% paraformaldehyde (PFA) 48 h after transfection and subjected to confocal imaging analysis after staining with NFAT1, TRIF, MyD88, and COX1 antibodies.
Immunocytochemical staining and image acquisition.
Microglia were fixed in 4% PFA as described previously (Parisiadou et al., 2009). Briefly, they were permeabilized with Triton X-100 and incubated with 10% donkey serum (Sigma-Aldrich) for 1 h to block unspecific binding and incubated overnight with the primary antibody. Fluorescent images were captured using a Zeiss confocal microscope (LSM 510). Antibodies specific to nuclear factor of activated T-cells 1 (NFAT1 or NFATc2, 1:500; Santa Cruz Biotechnology), NFAT2 (NFATc1, 1:250; Santa Cruz Biotechnology), NFAT3 (NFATc4, 1:250; Santa Cruz Biotechnology), NFAT4 (NFATc3, 1:250; Santa Cruz Biotechnology), Iba1 (1:500, Wako Chemicals; 1:500, Abcam), MyD88 (1:500; Santa Cruz Biotechnology), TRIF (TICAM1, 1:500; Imgenex), and COX1 (1:500; Invitrogen) were used as suggested by manufacturers. Alexa 488- or Alexa 568-conjugated secondary antibody (1:500; Invitrogen) was used to visualize the staining. Fluorescence intensities and areas were determined and fractal dimension quantification was performed using the NIH ImageJ software.
Immunohistochemistry and light microscopy.
As described previously (Cai et al., 2005), mice were killed and perfused via cardiac infusion with 4% paraformaldehyde in cold PBS. To obtain frozen sections, brain tissues were removed and submerged in 30% sucrose for 24 h and sectioned at 40 μm thickness using a cryostat (CM1950, Leica). Antibodies specific to NFAT1 or NFATc2 (1:100; Santa Cruz Biotechnology), Iba1 (1:200; Abcam), and COX1 (1:200; Invitrogen) were used as suggested by manufacturers. Alexa 488- or Alexa 568-conjugated secondary antibody (1:500; Invitrogen) was used to visualize the staining. Fluorescence images were captured using a laser-scanning confocal microscope (LSM 510; Zeiss). The paired images in all the figures were collected at the same gain and offset settings. The postcollection processing was applied uniformly to all paired images. The images were presented as either a single optic layer after acquisition in z-series stack scans at 0.8 μm intervals from individual fields or displayed as maximum-intensity projections to represent confocal stacks. Bright-field images were captured with a Zeiss Axio microscope (Imager A1). The cellular areas were performed using the NIH ImageJ software.
Postembedding immunoelectron microscopy.
Procedure of the postembedding immunoelectron microscopy was performed in the National Cancer Institute electron microscopy (EM) facility. Briefly, cultured cells were fixed in 4% formaldehyde and 0.05% glutaraldehyde in PBS for 2 h. Dehydration was performed in a series of cold ethanol (precooled to 4°C) from 35 to 100%, followed by infiltration in a 1:1 mixture of 100% ethanol and LR White resin, and then in LR White resin overnight. The cells were embedded in LR White resin and cured in a 55°C oven for 24 h. Thin sections (90 to 100 nm) were made and mounted on 300 mesh nickel grids. The grids were blocked for nonspecific binding sites by a commercial blocking buffer for goat, and then incubated in a serial dilution of primary antibody followed by 10 nm immunogold-conjugated secondary antibody. The grids were washed in Tris buffer, pH 7.4, containing 0.1% BSA (w/v), 250 mm NaCl, and 0.01% Tween20 (v/v). The grids were stained in uranyl acetate and lead citrate and examined in an electron microscope equipped with a digital camera.
Living image of microglia.
Primary microglial cells were seeded on poly-lysine-coated (50 μg/ml; Sigma) 35 mm glass bottom dishes (MatTek) for 24 h and then transfected with NFAT1-GFP and DsRed-Mito plasmids (Clontech Laboratories) using the CalPhos Mammalian Transfection Kit (Clontech Laboratories). Twenty-four hours after transfection, cells were treated with 200 ng/ml LPSs for 24 h before live imaging analysis. Twenty minutes before live imaging, 4′,6-diamidino-2-phenylindole dihydrochloride (DAPI, Invitrogen) was added in culture medium at the final concentration of 10 μm. The culture dish was then placed on heating plate (5% CO2, 90% humidity, 37°C) for 10 min before taking images. Fluorescence images were captured using an inverted laser-scanning confocal microscope (LSM 780; Zeiss). Images were taken every 5 s for 1 min.
11R-VIVIT treatment.
For cell-permeable RRRRRRRRRRRVIVIT (11R-VIVIT) (EMD Millipore) pretreatment, primary microglial cells were treated first with 1 μm 11R-VIVIT for 30 min and then with 200 ng/ml TLR-LPSs for 20 h. For posttreament, cells were exposed to 200 ng/ml LPSs first and 1 h later to 1 μm 11R-VIVIT for 20 h. Once added, 11R-VIVIT remained in the culture medium.
Mitochondrial fractionation from primary microglia.
The mitochondria of cultured microglia were isolated with a mitochondria isolation kit (Thermo Fisher Scientific, catalog #89874) according to the manufacturer's instructions. After 6 h treatment with 100 nm TLR-LPSs or DMSO, microglia were washed twice with ice-cold PBS and scraped from the bottom of the culture plates. Then, 2 × 10⁷ microglia were pelleted by centrifuging the harvested cell suspension in a 2 ml tube at ∼850 × g for 2 min at 4°C. The supernatant was carefully removed and discarded. Eight hundred microliters of Mitochondria Isolation Reagent A supplemented with protease inhibitor cocktail (Thermo Fisher Scientific, catalog #1861279) were added to the cell pellet, after which they were vortexed at medium speed for 5 s and incubated on ice for exactly 2 min. After adding 10 μl of Mitochondria Isolation Reagent B, the samples were vortexed at maximum speed for 5 s and incubated on ice for 5 min with vortex at maximum speed every minute. Then, 800 μl of Mitochondria Isolation Reagent C supplemented with protease inhibitor cocktail was added. After several inversions to mix thoroughly, a 160 μl aliquot sample was collected, and SDS was added to a final concentration of 1% to prepare the total cell lysate. The remaining suspension was centrifuged at 700 × g for 10 min at 4°C. The supernatant was transferred to a new, 2.0 ml tube and centrifuged at 12,000 × g for 15 min at 4°C. The supernatant (cytosol fraction) was collected, and SDS was added to a final concentration of 1%. The pellet containing the isolated mitochondria was washed with 500 μl Mitochondria Isolation Reagent C and centrifuged at 12,000 × g for another 5 min. The mitochondrial pellet was then dissolved in 100 μl 1% SDS buffer to prepare the mitochondria fraction. After 30 s sonication, total cell lysates, the cytosol and mitochondrial fractions, were centrifuged at 20,000 × g for 15 min. Supernatant was collected, and protein concentration was measured with BCA assay (Thermo Fisher Scientific, catalog #23225). After denaturing at 70°C for 10 min, equal amounts of protein samples were separated by 4–12% Tris-Bis NuPage gel and transferred to nitrocellulose membrane. Blots were incubated with antibodies to NFAT1 (Thermo Fisher Scientific, MA1–025), COX IV (Cell Signaling Technology, 4844S), LaminA/C (Cell Signaling Technology, 4777S), and β-actin (Sigma, A1978). The levels of protein expression were determined using a LI-COR system and Odyssey software.
Real-time reverse-transcription PCR.
Primary microglia were seeded on 24-well plates and treated in triplicate under the different experimental paradigms. At the end of treatment, cells were washed with ice-cold PBS three times, and total RNA was isolated with the PicoPure RNA isolation kit following the manufacturer's instruction (Applied Biosystems). The cDNA was then synthesized from 100 ng of RNA with the RT2 First Strand kit (Qiagen). The SYBR Green real-time PCR detection method was used to quantitate the transcript levels of the Ifnb1, TNFα, and β-actin using commercially prepared primers (Qiagen). The gene expression was calculated as fold changes normalized with the β-actin.
In vitro and mitochondrial functional assays.
Primary microglial cells were seeded in 96-well plates at a concentration of 0.5 × 10⁶ cells/ml in 100 μl of complete DMEM plus in the presence or absence of LPSs (200 ng/ml). After 24 h, 100 μl of complete DMEM was added to the culture. Cellular ATP and H2O2 levels were measured using the Bioluminescent Somatic Cell ATP Assay Kit (Sigma-Aldrich) and Hydrogen Peroxide Assay Kit (Cayman Chemical), respectively.
TLR-LPS administration in vivo.
Vehicle (PBS solution) or lipopolysaccharide (TLR-grade; E. coli, Serotype O111:B4 S-form; Enzo Life Sciences) at the concentration 2 mg/kg bodyweight was injected intraperitoneally daily for 3 d into 1-month-old Nfat1−/− and littermate control male mice. Four hours after the final injection, the mice were killed, and the brains were fixed by 4% paraformaldehyde and processed for DAB staining. The Vectastain Elite ABC Kit and ImmPACT DAB Peroxidase Substrate Kit were used as suggested by the manufacturer.
Statistical analysis.
Statistical analysis was performed using GraphPad Prism software. Data are presented as mean ± SD. Statistical significance was determined by comparing means of different groups using Student's t test or ANOVA followed by post hoc test.
Results
Prolonged LPS stimulation induces mitochondrial translocation of NFAT1
NFAT1 is expressed by neurons, astrocytes, and microglia in the CNS, which may regulate cell survival, apoptosis, and aging-related neuroinflammation (Benedito et al., 2005; Luoma and Zirpel, 2008; Sama et al., 2008; Nagamoto-Combs and Combs, 2010) However, little is known about how NFAT1 regulates the activity of microglia. Early studies show that LPS stimulation induces nuclear translocation of NFAT1 through the calcium/calcineurin-dependent pathway in dendritic cells, but fails in macrophages because LPSs are not able to trigger their calcium mobilization (Zanoni et al., 2009; Liu et al., 2011). To investigate the biological response of NFAT1 after activation of TLR4, We then set up primary cultures of microglia from postnatal day 2–4 mice and treated the cultures with LPSs for 1, 2, 6, and 24 h. LPSs induced only a modest increase of nuclear NFAT1 after 1 h of treatment, but failed to induce any obvious nuclear translocation of NFAT1 after treatment for 2 h (Fig. 1A,B). As a positive control, ionomycin treatment that triggers the release of calcium from endoplasmic reticulum (Smith et al., 1989) induced a more significant increase of nuclear NFAT1 in microglia (Fig. 1A,B). The specificity of NFAT1 staining was verified by transfection of microglia with siRNAs, which target two different regions of Nfat1 mRNAs and greatly reduced the expression of endogenous NFAT1 in the transfected cells (Fig. 1C). Together, these data suggest that NFAT1 may respond differently to LPS stimulation in the microglia compared with the dendritic cells.
Figure 1.
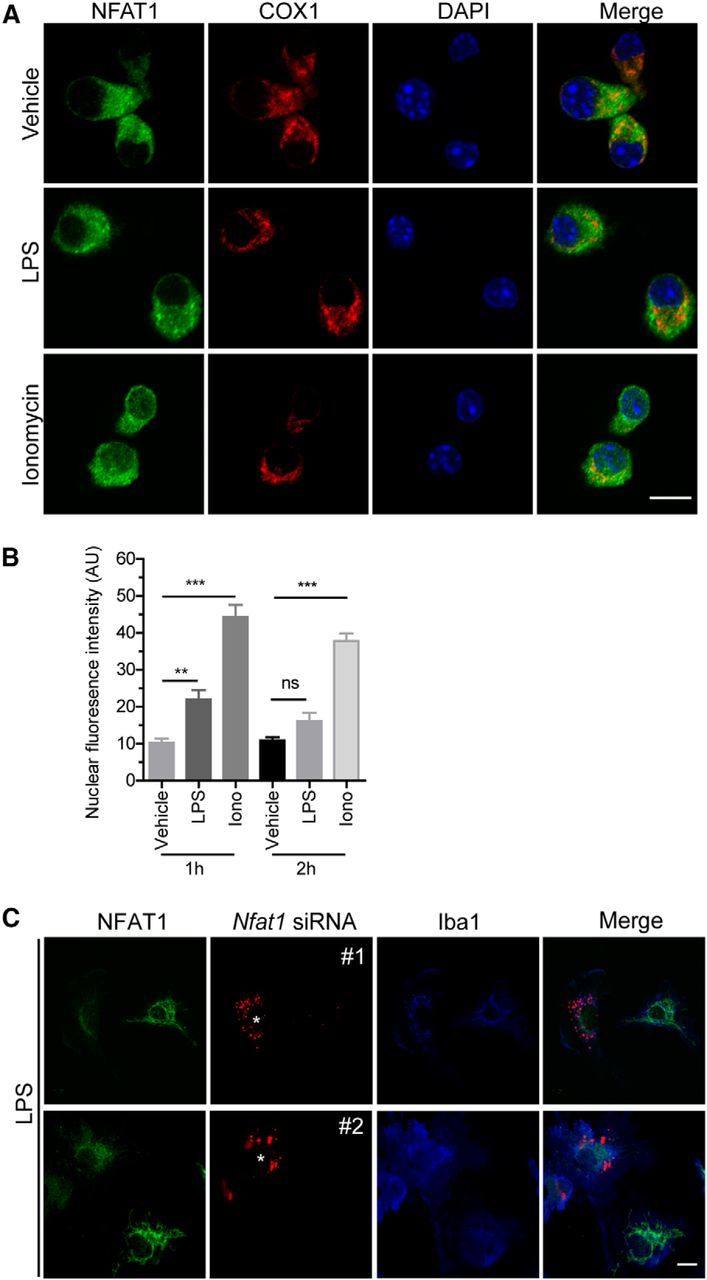
NFAT1 shows less nuclear translocation in response to LPS stimulation in microglia. A, Confocal images show NFAT (green), COX1 (red), and DAPI (blue) signals in primary microglia treated with LPSs (200 ng/ml) or ionomycin (Iono; 1 μm) for 2 h. B, Quantification of microglial confocal images shows that LPSs induced only a modest increase of nuclear NFAT1 after 1 h treatment and failed to induce any obvious nuclear translocation of NFAT1 after treatment for 2 h. As a positive control, ionomycin treatment induced more nuclear NFAT1 translocation in microglia. Data represent the mean ± SD of three independent experiments with n ≥ 150 cells per experiment. **p < 0.01; ***p < 0.001. C, Confocal images show NFAT (green), Nfat1 siRNAs (red; #1 and #2), and Iba1 (blue) signals in Nfat1 siRNA-transfected primary microglia after treatment with LPSs for 24 h. Scale bars: A, 10 μm.
Interestingly, after treatment with LPSs for 24 h, NFAT1 staining revealed some extensive tubular structures residing in the cytosol of microglia (Fig. 2A). We then costained NFAT1 with different organelle markers and found that NFAT specifically colocalized with mitochondrial protein COX1 (Fig. 2A). This LPS-induced NFAT1 mitochondrial translocation seems time dependent, with 10 and 95% of microglia showing NFAT1 mitochondrial transportation after treatment with LPSs for 6 and 24 h, respectively (Fig. 2B). However, there was no significant dose effect on LPS-induced NFAT1 mitochondrial translocation when microglia were treated with 20, 200, and 2000 ng/ml LPSs for 24 h (Fig. 2C). Noticeably, although prolonged LPS treatment significantly altered the mitochondrial morphology, it did not affect the survival of microglia (Fig. 2D). Next, we investigated the distribution of NFAT1 within mitochondria by immunogold EM of cultured microglia treated with LPSs for 24 h. Around 80% of immunogold particles were found in the matrix and cristae of mitochondria in LPS-treated microglia (Fig. 2E). This immunogold signal disappeared when the primary anti-NFAT1 antibody was omitted (data not show). Moreover, we examined the mitochondrial localization of NFAT1 in live microglia. We transfected the cells with a mitochondrial marker that contains a mitochondrial targeting sequence from subunit VIII of human cytochrome c oxidase (Mito) and red fluorescence protein (DsRed), DsRed-Mito (Rizzuto et al., 1995), as well as GFP-tagged NFAT1. Consistent with our findings in fixed cells, we found a colocalization of DsRed-Mito with NFAT1-GFP in LPS-treated live microglia (Fig. 2F). We further performed cell fractionation experiments of vehicle and LPS-treated microglia (Fig. 2G). We found that substantially more NFAT1 proteins were transported into mitochondria after prolonged LPS stimulation (Fig. 2H). Collectively, these data demonstrate that prolonged LPS stimulation induces mitochondrial translocation of NFAT1 in microglia, which may regulate the function of mitochondria during microglial activation.
Figure 2.
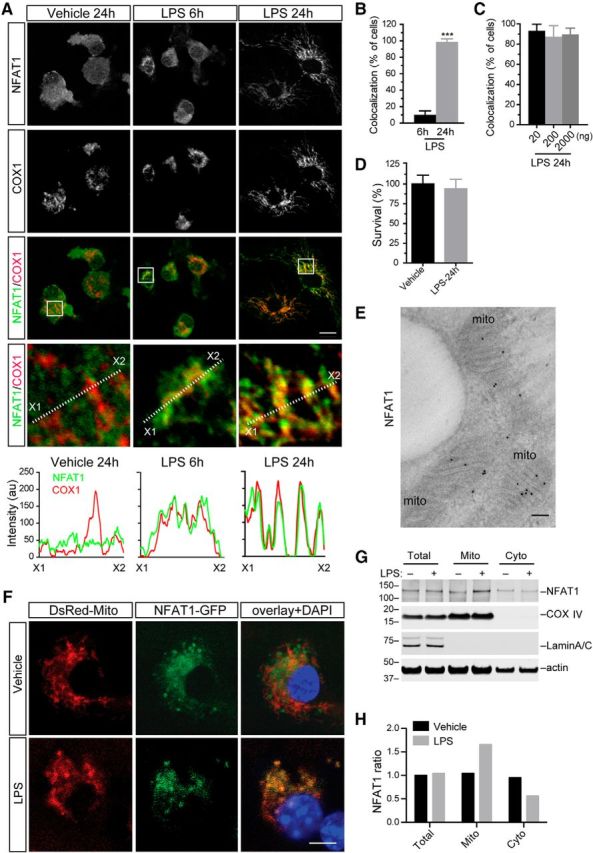
Prolonged LPS stimulation induces mitochondrial translocation of NFAT1 in microglia. A, Representative confocal images show NFAT1 (green) and mitochondrial marker COX1 (red) staining in primary microglia treated with vehicle for 24 h or LPSs (200 ng/ml) for 6 and 24 h. White dashed lines highlight the optic sections for line scans, which illustrate the fluorescence intensities of NFAT1 (green) and COX1 (red) along the selected lines. B, Bar graph depicts the percentage of microglia showing NFAT1 and COX1 colocalization after treatment with LPSs for 6 and 24 h. ***p < 0.001. C, Bar graph shows that there is no significant dose effect on LPS-induced NFAT1 mitochondrial translocation when microglia are treated with 20, 200, and 2000 ng/ml LPSs for 24 h. D, Bar graph shows the surviving rates of microglia treated with vehicle or LPSs for 24 h. Data represent the mean ± SD for three independent experiments with n ≥ 150 cells per experiment. E, Representative image shows immunogold EM staining of NFAT (dark pigments) in primary microglia treated with 200 ng/ml LPSs for 24 h. Mitochondria are indicated as “mito.” F, Representative images show DsRed-Mito and NFAT1-GFP distribution in live primary microglia treated with vehicle or 200 ng/ml LPSs for 24 h. The nucleus was labeled by DAPI. G, Western blots show NFAT1 protein accumulation in total cell lysates as well as in mitochondrial (Mito) and cytosol (Cyto) fractions of microglia after treatment with vehicle or 200 ng/ml LPSs for 6 h. COXIV and LaminA/C were used as mitochondrial and nuclear marker proteins. β-actin was used as loading control. H, Bar graph shows the ratio of NFAT1 in the mitochondrial and cytosolic fractions of microglia treated with vehicle or LPSs. Scale bars: A, F, 10 μm; E, 100 nm.
The C-terminal mitochondrial targeting sequence of NFAT1 is required for the mitochondrial translocation
To determine the sequence motif responsible for the mitochondrial import of NFAT1, we transfected cultured microglia with different GFP-tagged NFAT1 expression vectors that express human NFAT1 full-length cDNA [GFP-NFAT1 (FL)] and various NFAT1 deletion mutations that lack the NFAT homology region (also known as the NFAT regulatory domain), the Rel homology domain (also known as the DNA binding domain), or the C-terminal domain, respectively (Fig. 3A). We found that the C-terminal of NFAT1 was required for the mitochondrial translocation of NFAT1 after prolonged LPS treatment (Fig. 3A,B). Furthermore, iPSORT analysis (Bannai et al., 2002) predicted a mitochondria targeting motif “LRGGG” at the C-terminal of NFAT1 (Fig. 3A). Collaboratively, deletion of these five amino acids abolished the translocation of NFAT1 into mitochondria (Fig. 3B). In addition, iPSORT analysis also predicted the existence of mitochondria targeting motifs in other NFAT family members, of which NFAT2 has a mitochondrial-targeting motif at amino acids 27–32 (LRPAPP), NFAT3 at amino acids 398–403 (FRTSAL), and NFAT4 at amino acids 413–418 (FRTSSL). Consistently, prolonged treatment of LPSs also triggered the translocation of NFAT2, NFAT3, and NFAT4 into the mitochondria of cultured microglia (Fig. 4). Together, here we demonstrate that NFAT1–NFAT4 family proteins all undergo mitochondrial translocation in response to LPS-mediated chronic microglial activation.
Figure 3.
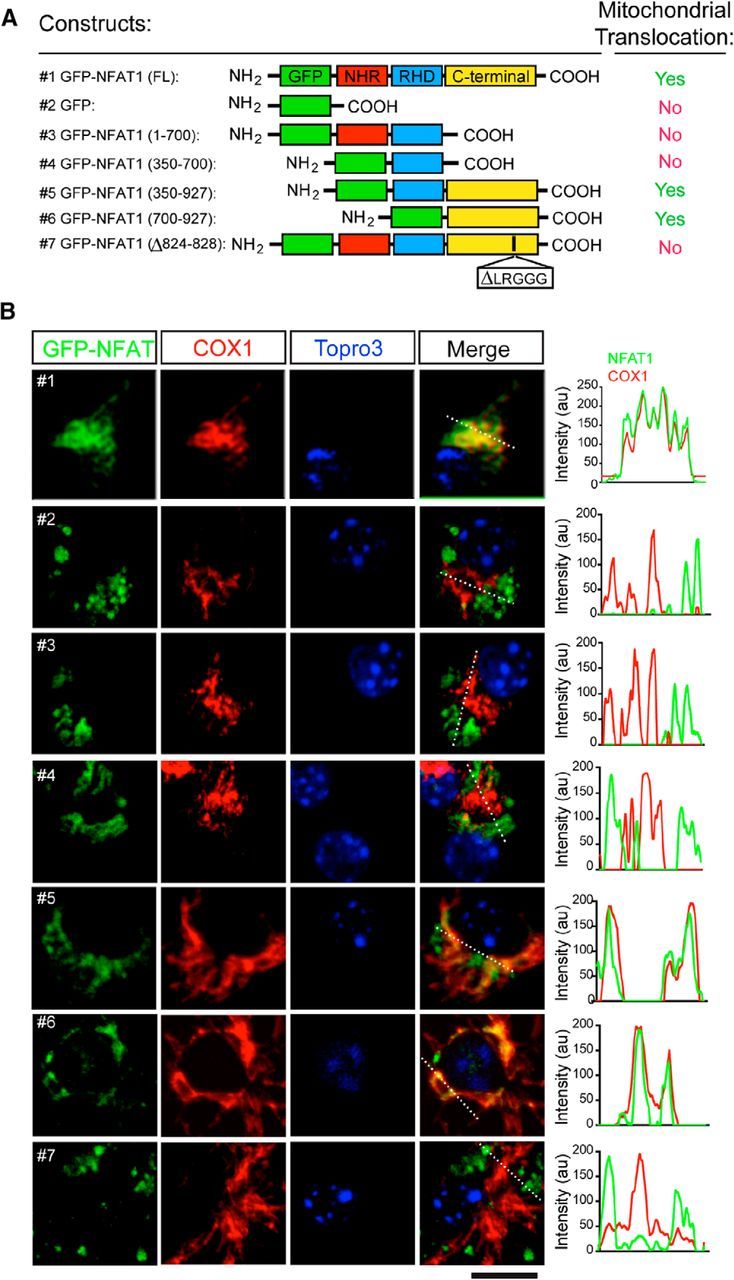
The C-terminal mitochondrial targeting sequence of NFAT1 is required for mitochondrial translocation. A, Schematic diagrams show GFP-tagged NFAT1 full-length (FL) and mutant expression vectors and their capability for mitochondrial targeting in microglia after treatment with LPSs for 24 h. B, Confocal images show expression of exogenous GFP-tagged NFAT1 (green) and endogenous COX1 (red) in NFAT1-transfected primary microglia treated with LPSs for 24 h. Line graphs illustrate the fluorescence intensities of GFP-NFAT1 (green) and COX1 staining (red) along the white dashed lines in the merged images. Scale bar, 10 μm.
Figure 4.
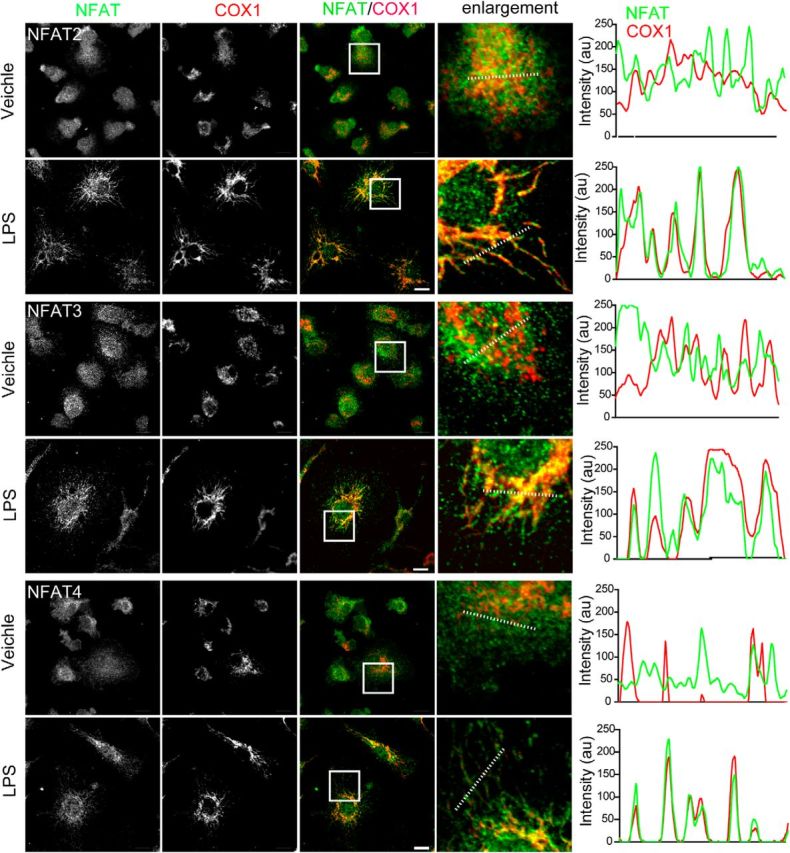
The other members of the NFAT family, including NFAT2, NFAT3 and NFAT4, also translocate into mitochondria in LPS-treated microglia. Confocal images show NFAT2–NFAT4 (green) and COX1 (red) staining in primary microglial cells treated with vehicle or LPSs (200 ng/ml) for 24 h. Scale bars: 10 μm. Line graphs illustrate the fluorescence intensities of NFAT1 (green) and COX1 (red) along the dashed lines of selected cells.
The mitochondrial translocation of NFAT1 is independent of the calcium/calcineurin pathway
To determine whether the well-documented calcium/calcineurin pathway regulates the mitochondrial translocation of NFAT1 upon prolonged LPS challenge, cultured microglia were treated with calcium chelator EGTA before LPS challenge. We found that EGTA did not prevent the mitochondrial translocation of NFAT1 in LPS-treated microglia or affect the survival of microglia (Fig. 5A–C). Similarly, calcineurin inhibitor cyclosporine A (Liu et al., 1991) also failed to block the translocation of NFAT1 into mitochondria or alter the survival of microglia (Fig. 5D–F). These data thereby suggest that the mitochondrial import of NFAT1 is independent of the calcium/calcineurin pathway in microglia.
Figure 5.
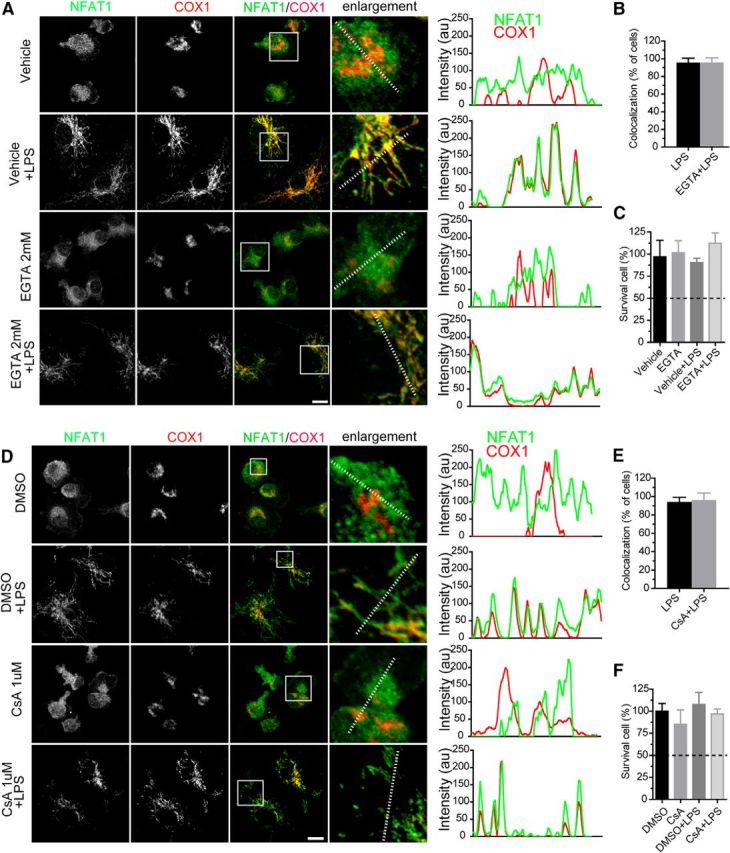
The mitochondrial translocation of NFAT1 is independent of the Ca2+/calcineurin pathway in microglia. A, Confocal images show NFAT1 (green) and COX1 (red) staining in primary microglia treated with vehicle or TLR-LPSs (200 ng/ml) in the presence or absence EGTA (2 mm) for 24 h. Line graphs illustrate the fluorescence intensities of NFAT1 (green) and COX1 (red) along the dashed lines of selected cells. B, Bar graph depicts the percentage of microglia showing colocalization of NFAT1 and COX after treatment with LPSs or LPSs with EGTA. Data represent the mean ± SD of three independent experiments with n ≥ 150 cells per experiment. C, Bar graph shows the survival rate of microglia after treatment with vehicle or LPSs in the presence or absence of EGTA for 24 h. Data represent the mean ± SD of three independent experiments with n ≥ 150 cells per experiment. D, Confocal images show NFAT1 (green) and COX1 (red) staining in primary microglia treated with DMSO or LPSs in the presence or absence of cyclosporin A (CsA; 1 μm) for 24 h. Line graphs illustrate the fluorescence intensities of NFAT1 (green) and COX1 (red) along the dashed lines of selected cells. E, Bar graph depicts the percentage of microglia showing colocalization of NFAT1 and COX after treatment with LPSs or LPSs with CsA. Data represent the mean ± SD of three independent experiments with n ≥ 150 cells per experiment. F, Bar graph shows the survival rate of microglia after treatment with vehicle or LPSs in the presence or absence of CsA for 24 h. Data represent the mean ± SD of three independent experiments with n ≥ 150 cells per experiment. Scale bars: 10 μm.
The mitochondrial translocation of NFAT1 is dependent on the TRIF-mediated endocytic pathway
LPSs bind to the cell surface receptors TLR4 and CD14 to induce the immune response (Zanoni et al., 2011; Fig. 6A). TLR-LPS is generally used as a selective ligand of TLR4 receptor (Zanoni et al., 2011). Compared to regular LPS, TLR-LPS induced an even more robust translocation of NFAT1 into the mitochondria of microglia after 6 h treatment (Fig. 6B). TLR4 may transduce the LPS stimulation inside cells by either dynamin-mediated endocytic pathway or MyD88-dependent pathway (Kagan et al., 2008; Fig. 6A). To determine whether dynamin is required for the mitochondrial translocation of NFAT1, we treated cultured microglia with dynasore, a highly specific dynamin inhibitor (Zanoni et al., 2009; Macia et al., 2006), before TLR-LPS stimulation. We found that pretreatment with 40 μm dynasore was able to prevent the TLR-LPS-induced mitochondrial translocation of NFAT1 in cultured microglia (Fig. 6B). The percentage of cells showing NFAT1 mitochondrial translocation was greatly reduced to <10% by 40 μm dynasore pretreatment, in contrast with 90% for those without treatment (Fig. 6B,C). Following dynamin-mediated endocytosis, TRIF serves as an adaptor to relay the downstream signaling in responding to TLR activation (Kagan et al., 2008). We then examined the involvement of TRIF in NFAT1 mitochondrial translocation. We found that the mitochondrial translocation of NFAT1 was selectively inhibited in the microglia transfected with Trif siRNA, but not in the nontransfected cells (Fig. 6D). In contrast, transfection of Myd88 siRNA had no effect on the translocation of NFAT1 into mitochondria (Fig. 6E). Together, these data suggest that the TRIF-dependent signaling pathway is responsible for the TLR4-induced mitochondria translocation of NFAT1 in microglia. Furthermore, TRIF-mediated production of interferon β1 (Ifnb1) was significantly reduced and the MyD88-dependent induction of Tnfα and interleukin 6 (Il-6) was less affected in the microglia derived from Nfat1 knock-out (Nfat1−/−) mice (Fig. 6F–H), suggesting that NFAT1 works downstream of TRIF in response to LPS stimulation. To investigate whether nuclear translocation of NFAT1 contributes to interferon and cytokine production, we pretreated microglia with cell-permeable NFAT inhibitor 11R-VIVIT (RRRRRRRRRRRMAGPHPVIVITGPHEE) for 30 min before LPS stimulation and then checked the expression of Ifnb1 and Tnfα by qRT-PCR. VIVIT has been shown to selectively and potently inhibit calcineurin–NFAT interaction and NFAT1 nuclear translocation (Yu et al., 2007). We found that pretreatment with 11R-VIVIT did not alter the expression of Ifnb1 and Tnfα in LPS-treated microglia (Fig. 6I,J). Similar results were also obtained from LPS-treated macrophages (Minematsu et al., 2011). These data further support our hypothesis that nuclear translocation of NFAT1 plays a limited role in the response of microglia to the prolonged LPS stimulation. As controls, both Trif and Myd88 siRNAs substantially reduced the expression of TRIF and MyD88 in the transfected microglial cells (Fig. 7A,B).
Figure 6.
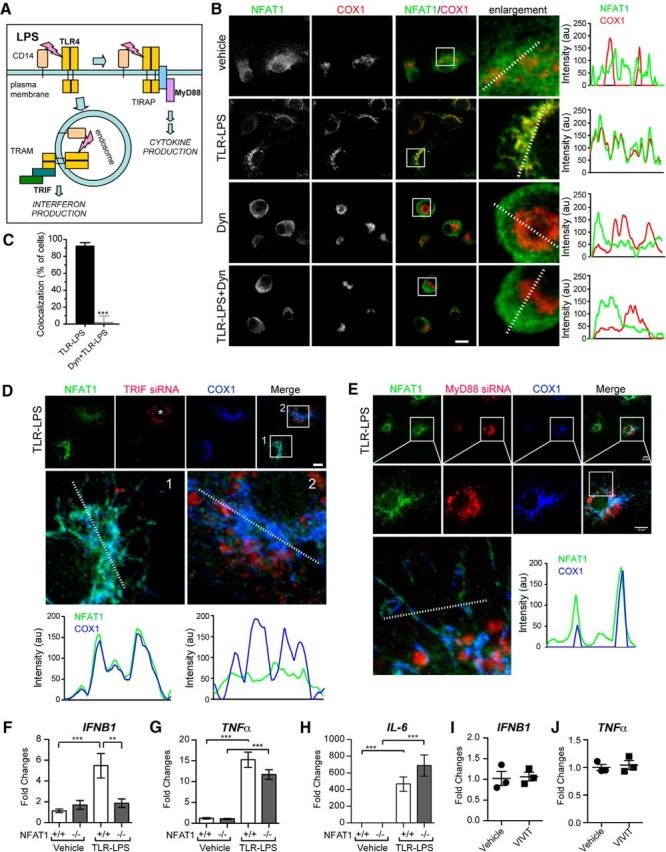
The mitochondrial translocation of NFAT1 is mediated by the TRIF-dependent endocytic pathway in microglia. A, A model depicts LPS-induced TLR4 and CD14 intracellular signaling in immune cells. LPSs bind to TLR4 and CD14 at the cell surface, which signals through the TIR domain-containing adaptor protein (TIRAP)–MyD88 adaptors to activate the expression of inflammatory cytokines. Alternatively, LPSs are transported to endosomes, where translocation-associating membrane protein (TRAM)–TRIF signaling leads to the production of interferons. B, Confocal images show staining of NFAT1 (green) and COX1 (red) in primary microglia treated with vehicle, TLR-LPSs (200 ng/ml), dynasore (Dyn; 40 μm), and TLR-LPSs with Dyn for 6 h. The line graphs illustrate the fluorescence intensities of NFAT1 (green) and COX1 (red) signals along the dashed lines in selected images. C, Bar graph depicts the percentage of microglia showing NFAT1 and COX1 colocalization after treatment with TLR-LPSs or TLR-LPSs with Dyn for 6 h. Data represent the mean ± SD for three independent experiments with n ≥ 150 cells per experiment. D, Confocal images show NFAT1 (green), TRIF siRNAs (red), and COX1 (blue) in TRIF siRNA-transfected primary microglia after treatment with TLR-LPSs for 6 h. The asterisk marks the cell transfected with TRIF siRNA. Line graphs illustrate fluorescence intensities of NFAT1 (green) and COX1 (blue) signals along the dashed lines in selected cells. E, Confocal images show NFAT1 (green), MyD88 siRNAs (red), and COX1 (blue) in MyD88 siRNA-transfected primary microglia after treatment with TLR-LPSs for 6 h. The line graph illustrates fluorescence intensities of NFAT1 (green) and COX1 (blue) signals along the dashed lines in the selected cell. F–H, qRT-PCR analyses show the expression of Ifnb1 (F), Tnfα (G), and Il-6 (H) mRNA in Nfat1+/+ and Nfat1−/− primary microglia after treatment with TLR-LPSs for 24 h. Data represent mean ± SD for three independent experiments. I, J, qRT-PCR analyses show the expression of Ifnb1 (I) and Tnfα (J) in Nfat1+/+ primary microglia pretreated with 1 μm 11R-VIVIT for 30 min and then treated with vehicle or 200 ng/ml TLR-LPSs for 24 h. Data represent the mean ± SD for three independent experiments. Scale bars: 10 μm. **p < 0.01; ***p < 0.001.
Figure 7.

Transfection of mouse Trif or Myd88 siRNAs substantially reduces the target protein expression endogenous in primary microglia. A, Confocal images show TRIF protein (green), Trif siRNA (red), and COX1 (blue) signals in primary microglial cells transfected with Trif siRNA. Scale bar: 10 μm. B, Confocal images show MyD88 protein (green), Myd88 siRNA (red), and COX1 (blue) signals in primary microglial cells transfected with Myd88 siRNA.
TLRs form a large superfamily of receptors in response to various immune stimulations (Hajishengallis and Lambris, 2010). To evaluate whether activation of other TLR signaling could induce a similar mitochondrial translocation of NFAT1 in microglia, we stimulated the cells with TLR specific ligands for 24 h and examined the subcellular localization of NFAT1. With the exception of TLR5 agonist flagellin, the ligands for the rest of TLRs were able to induce the mitochondrial translocation of NFAT1 in microglia (Fig. 8). It is worth pointing out that TLR5 is primarily coupled with the MyD88-dependent intracellular signal transduction pathway in immune cells (Hayashi et al., 2001), which further supports the notion that MyD88 is not involved in the mitochondrial translocation of NFAT1.
Figure 8.
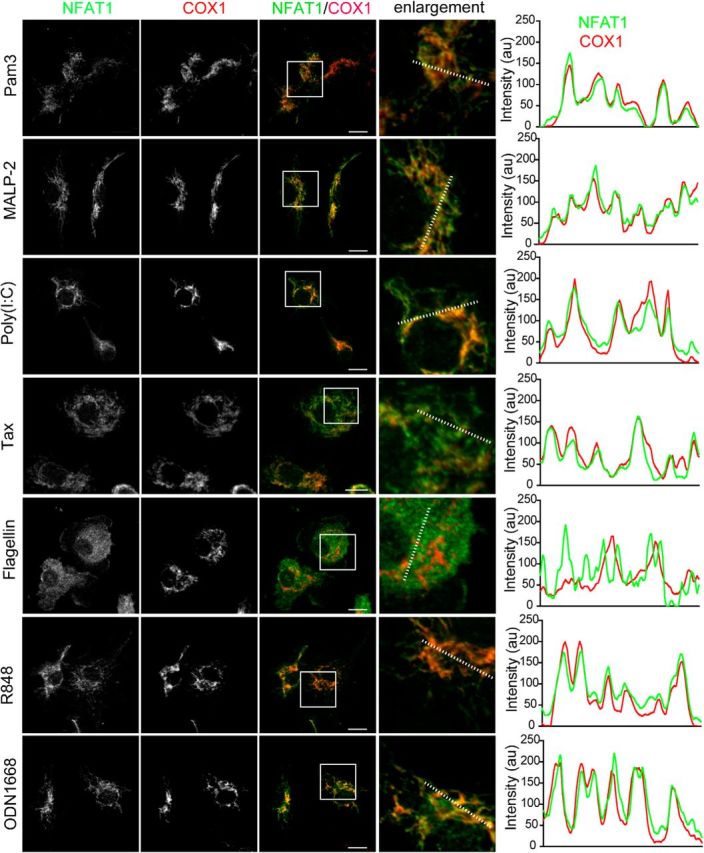
Except for TLR5, the TLR ligands are able to induce the mitochondrial translocation of NFAT1 in microglia after 24 h treatment. Confocal images show NFAT1 (green) and COX1 (red) staining in primary microglia after 24 h treatment with TLRs ligands, including Pam3 (a selective TLR1 and TLR2 agonist; 100 ng/ml), MALP-2 (a selective TLR2 and TLR6 agonist; 100 ng/ml), poly (I:C) (a specific ligand for TLR3; 100 μg/ml), taxol (Tax; a specific TLR4 agonist; 10 μm), flagellin (a specific TLR5 agonist; 100 ng/ml), R848 (a selective TLR7 and TLR8 agonist; 1 μg/ml), and ODN1668 (a specific TLR9 agonist; 100 μm). Scale bars: 10 μm. Line graphs illustrate the fluorescence intensities of NFAT1 (green) and COX1 (red) along the dashed lines of selected cells.
NFAT1 promotes the cellular ATP and reactive oxygen species production in vitro and microglial activation in vivo
To determine whether NFAT1 affects the function of mitochondria, we examined the levels of cellular ATP and reactive oxygen species (ROS) in Nfat1−/− and knockdown microglia. Compared with the control cells, LPS-induced cellular ATP and H2O2 levels were modestly reduced in Nfat1 siRNA-transfected microglia and in microglia derived from Nfat1−/− mice (Fig. 9A–D). In addition, the mitochondria in Nfat1 siRNA-transfected microglia exhibited more compact morphology clustered near the nucleus (Fig. 9E). Image analysis revealed a significant reduction of mitochondrial surface areas and complexities in Nfat1 siRNA-transfected microglia compared to the nontransfected cells (Fig. 9F,G). Collectively, these observations suggest that NFAT1 is important in promoting the activities and expansion of mitochondria in response to prolonged microglial activation.
Figure 9.
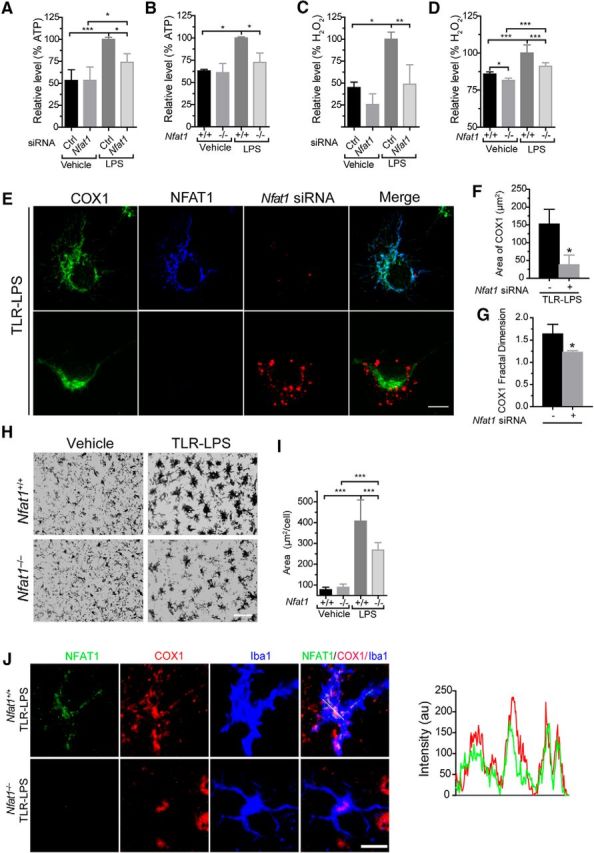
The mitochondrial translocation of NFAT1 promotes cellular ATP and ROS production in vitro and microglial activation in vivo. A–D, Cellular ATP (A, B) and ROS (C, D) production are both increased in microglia after 24 h of LPS stimulation. Transfection of Nfat1 siRNA significantly reduces cellular ATP (A) and ROS (C) levels. Microglia from Nfat1−/− mice also show significantly lower levels of ATP (B) and ROS (D) compared with controls. Data represent the mean ± SD for three independent experiments. E, Confocal images show COX1 (green), Nfat1 siRNA (red), and NFAT (blue) signals in Nfat1 siRNA-transfected primary microglia treated with TLR-LPSs for 24 h. F, G, Bar graphs show the surface area (F) and the complexities of mitochondrial morphology (G) in Nfat1 siRNA-transfected and control microglia. Data represent the mean ± SD for three independent experiments with n ≥ 50 cells per experiment. H, Iba1 immunohistochemistry reveals microglia in the striatum of Nfat1+/+ and Nfat1−/− mice treated with vehicle or TLR-LPSs. I, Bar graph quantifies the area of microglial cell bodies in the striatum of Nfat1+/+ and Nfat1−/− mice treated with vehicle or TLR-LPSs. n = 3 animals per treatment per genotype. J, Confocal images show NFAT1 (green), COX1 (red), and Iba1 (bule) in striatal sections of Nfat1+/+ and Nfat1−/− mice after intraperitoneal injection with TLR-LPSs. Line graph illustrates the fluorescence intensities of NFAT1 (green) and COX1 (red) along the dashed line. Scale bars: E, J, 10 μm; H, 50 μm. *p<0.05; **p < 0.01; ***p < 0.001.
LPSs can disrupt the blood–brain barrier and induce activation of microglia in the rodent brains (Wispelwey et al., 1988; Cardona et al., 2006). The resting microglia show small-size cell bodies with multiple long and ramified processes, while upon activation microglia display enlarged cell bodies with short and thicker processes. To investigate whether the LPS-induced microglial activation leads to NFAT mitochondrial translocation in vivo, TLR-LPSs were intraperitoneally injected into Nfat1−/− and littermate control mice. LPS treatment enlarged the soma of microglia from both Nfat1+/+ and Nfat1−/− mice (Fig. 9H,I). However, the sizes of microglial cell bodies in LPS-treated Nfat1−/− mice were significantly smaller compared to Nfat1+/+ mice, suggesting that NFAT1 is involved in the microglial activation in vivo (Fig. 9H,I). More interestingly, TLR-LPS injection also led the translocation of NFAT1 into mitochondria in the microglia of Nfat1+/+ mice (Fig. 9J). By contrast, no NFAT1 mitochondrial translocation was detected in saline-injected Nfat1+/+ mouse brains (data not shown). All the in vivo experiments were performed in the striatum; whether NFAT1 shows mitochondria translocation in microglia from other brain regions remains to be determined. Nonetheless, these results demonstrate that mitochondrial translocation of NFAT1 can also play an important role in LPS-induced microglial activation in vivo.
The NFAT1 inhibitor 11R-VIVIT suppresses LPS-induced mitochondrial morphological changes
To evaluate the contribution of NFAT1 nuclear translocation in LPS-induced changes in mitochondrial morphology, we treated the cultured microglia with 1 μm 11R-VIVIT for 30 min and then with LPSs for 20 h. We found that pretreatment of 11R-VIVIT blocked the morphological changes in mitochondria (Fig. 10A,B). To further investigate if the pretreatment of 11R-VIVIT is required to suppress the morphological alterations in mitochondria, we started the LPS treatment first and then added 11R-VIVIT 1 h later into the culture medium for additional 20 h. The posttreatment with 11R-VIVIT also blocked LPS-induced mitochondrial morphological changes (Fig. 10A,B). Additionally, we found that neither pretreatment nor posttreatment with 11R-VIVIT affected the mitochondrial translocation of NFAT1 (Fig. 10C–E). These data indicate the classic calcineurin-dependent nuclear translocation of NFAT1 plays a predominant role in LPS-induced morphological changes in mitochondria.
Figure 10.
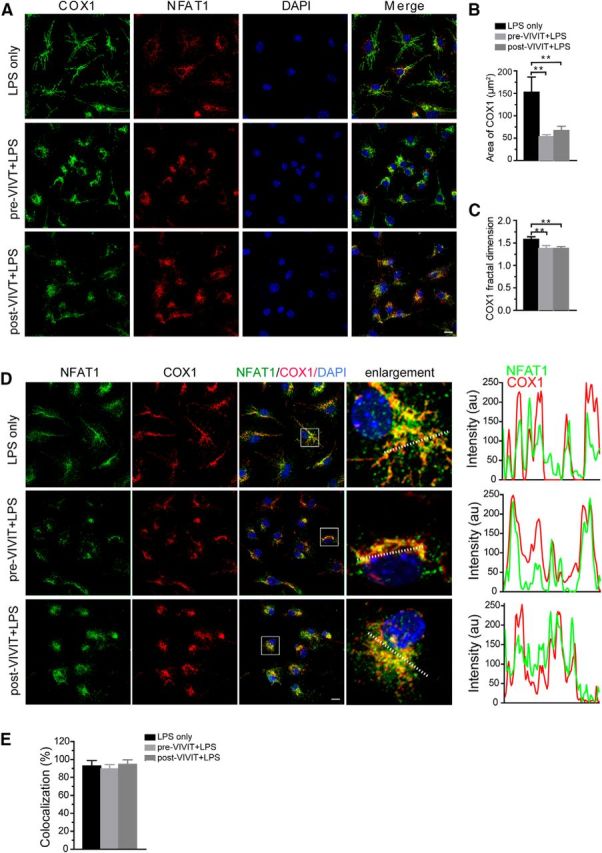
Nuclear translocation of NFAT1 is responsible for the alterations of mitochondrial morphology in microglia. A, Confocal images show COX1 (green), NFAT1 (red), and DAPI (blue) signals in microglia treated with TLR-LPSs (200 ng/ml) in the presence or absence of 11R-VIVIT (1 μm) for 20 h. B, C, Bar graphs show the surface area (B) and the complexities of mitochondrial morphology (C) in VIVIT-treated and control microglia. “Pre-VIVIT” indicates that microglia were pretreated with VIVIT for 30 min before addition of TLR-LPSs; “post-VIVIT” means that microglia were treated with TLR-LPS first for 60 min before supplementation with VIVIT for an additional 20 h. Data represent the mean ± SD for three independent experiments. Statistical significance was determined using one-way ANOVA followed by post hoc test. **p < 0.01. D, Confocal images show NFAT1 (green), COX1 (red), and DAPI (blue) signals in microglia treated with TLR-LPS (200 ng/ml) in the presence or absence of VIVIT (1 μm) for 20 h. Line graphs illustrate the fluorescence intensities of NFAT1 (green) and COX1 (red) along the dashed lines of selected cells. E, Bar graph depicts the percentage of microglia showing colocalization of NFAT1 and COX1 after treatment with LPS only or a combination of LPS and VIVIT. Data represent the mean ± SD of three independent experiments. Statistical significance was determined by using one-way ANOVA followed by the post hoc test. Scale bars: 10 μm.
Discussion
In this study, we report a new signaling pathway that couples NFAT1 with TLR4 in LPS-induced microglial activation. We first show that prolonged LPS stimulation led to an unexpected mitochondrial translocation of nuclear factor NFAT1 in microglia. We then demonstrate that the mitochondrial import of NFAT1 was not under the control of the classic calcium/calcineurin pathway. Instead, TLR4 used TRIF, a MyD88-independent pathway, to regulate the translocation of NFAT1 from the cytosol into the mitochondria. The functional significance of this new pathway is supported by genetic inhibition of NFAT1 that compromised the TRIF-dependent cytokine production, mitochondria-mediated ATP, and ROS generation, and the overall activity of microglia in response to LPS stimulation. Our new findings of NFAT in regulating TLR signaling may provide new molecular insights into the microglia-mediated inflammatory response against brain infection.
Consistent with the previous finding in macrophages (Zanoni et al., 2009), LPS treatment did not induce a robust nuclear translocation of NFAT1 in microglia. To our surprise, we observed an exclusive translocation of NFAT1 from the cytosol into the mitochondria after a prolonged LPS stimulation. Interestingly, this mitochondrial import of NFAT1 did not rely on the calcium/calcineurin pathway, which is essential for the nuclear transfer of NFAT1 (Crabtree and Olson, 2002). The deletion of the N-terminal regulatory domain of NFAT1, which is the target of calcineurin-mediated phosphatase activity (Macian, 2005), did not affect the mitochondrial targeting of NFAT1. By contrast, the removal of a short mitochondria-targeting motif at the C-terminal domain of NFAT1 completely disrupted the translocation of NFAT1 into the mitochondria. To further confirm the notion that calcium/calcineurin signaling plays no role in the mitochondrial import of NFAT1, neither calcium chelator nor calcineurin inhibitors showed any effect on the mitochondrial translocation of NFAT1. These data thereby reveal a new calcium/calcineurin-independent signaling pathway in regulating a new function of NFAT1 in mitochondria during microglial activation.
LPS stimulation in immune cells is relayed by TLR4 and the CD14 coreceptor through activating both MyD88- and TRIF-dependent pathways, of which the internalization of the LPS/TLR4 complex triggers the TRIF pathway (Kawai and Akira, 2010). To identify which TLR4-mediated signaling pathways regulate the mitochondria targeting of NFAT1 in LPS-treated microglia, we found that inhibition of the dynamin-mediated endocytic pathway blocked the translocation of NFAT1 into mitochondria, suggesting the TRIF pathway is involved in the mitochondrial import of NFAT1. This hypothesis is further confirmed by genetic inhibition of TRIF in microglia that also prevented the transport of NFAT1 into mitochondria. On the other hand, the inhibition of MyD88 did not affect the mitochondrial import of NFAT1. Consistently, a lack of NFAT1 compromised the TRIF-mediated production of IFNB1, whereas the MyD88-dependent induction of TNF-α and IL-6 was not affected. These results together suggest that NFAT1 works downstream of the TRIF pathway in responses to prolonged LPS stimulation. TRIF activates the downstream effectors through the kinase receptor-interacting protein 1 (RIP1) (Meylan et al., 2004). Parkinson's disease-related leucine-rich repeat kinase 2 (LRRK2), a member of RIP family proteins (Zhang et al., 2010), has been shown to interact and regulate the translocation of NFAT1 from the cytosol into the nucleus in macrophages (Liu et al., 2011). We examined the LPS-induced mitochondrial translocation of NFAT1 in Lrrk2 wild-type and knock-out microglia and found that the absence of Lrrk2 did not affect the mitochondrial translocation of NFAT1 (Fig. 11). Therefore, it remains speculative on how TRIF regulates the mitochondrial import of NFAT1.
Figure 11.

LRRK2 does not affect the mitochondrial translocation of NFAT1 in microglia. Confocal images show NFAT1 (green), COX1 (red), and Iba1 (blue) in primary Lrrk2−/− microglial cells treated with vehicle or TLR-LPS (200 ng/ml) for 24 h. Scale bar, 10 μm. Line graphs illustrate the fluorescence intensities of NFAT1 (green) and COX1 (red) along the dashed lines of selected cells.
To study whether NFAT1-mediated signaling transduction pathways affect mitochondrial function and morphology upon LPS stimulation, we quantified the production of ATP and ROS and measured the size and shape of mitochondria in control and Nfat1-deficient microglia. Our data suggest that the activation of NFAT1-dependent pathways contributes to the production of ATP and ROS and mitochondrial morphological alterations in microglia in response to LPS stimulation. We further demonstrated that calcineurin-dependent nuclear translocation of NFAT1 is responsible for the mitochondrial morphological changes. On the other hand, nuclear translocation of NFAT1 has no significant impact on Ifnb1 and Tnfα expression in the LPS-treated microglia. To test whether NFAT1 regulates the transcription of mitochondrial DNA-encoded genes, we quantified the expression of NADH dehydrogenase subunits, cytochrome B, and cytochrome oxidase subunits. The expression of mitochondrial genes was lower in the nontreated Nfat1−/− microglia compared to the nontreated control cells (Fig. 12), suggesting that NFAT1 may regulate the expression of mitochondrial genes in the resting microglia. These data are rather intriguing given that NFAT1 was mainly located in the cytosol of nontreated cells. LPS treatment suppressed the expression of mitochondrial genes in both Nfat1+/+ and Nfat1−/− microglia; however, no significant difference of mitochondrial gene expression was found between the LPS-treated Nfat1+/+ and Nfat1−/− cells (Fig. 12). These results seem not to support a direct role of NFAT1 in facilitating the transcription of mitochondrial genes in response to LPS stimulation. Future studies may need to address the exact roles of NFAT1 in mitochondria.
Figure 12.

Quantification of selective mitochondrial gene expression in the Nfat1+/+ and Nfat1−/− microglia treated with LPSs for 24 h. Bar graphs depict the expression of selective mitochondrial DNA-encoded genes in the LPS-treated microglia derived from Nfat1+/+ and Nfat1−/− mice analyzed by qRT-PCR. Data are shown as the relative expression fold to the Nfat1+/+ microglia in the LPS-absent culture and as mean ± SD for three independent experiments. *p < 0.05; **p < 0.01; ***p < 0.001.
In summary, our findings establish a new TLR- and NFAT-mediated inflammatory pathway in microglia and uncover a new mitochondria-dependent mechanism for NFAT action in response to TLR activation.
Footnotes
This work was supported in part by the intramural research programs of the National Institute on Aging (AG000928, AG000929) and by the National Natural Science Foundation of China (Projects 81072648 and 81373389). The authors would like to thank members of Cai lab for providing various supports and the China Scholarship Council for its international exchange programs.
There authors declare no competing financial interests.
References
- Bannai H, Tamada Y, Maruyama O, Nakai K, Miyano S. Extensive feature detection of N-terminal protein sorting signals. Bioinformatics (Oxford) 2002;18:298–305. doi: 10.1093/bioinformatics/18.2.298. [DOI] [PubMed] [Google Scholar]
- Benedito AB, Lehtinen M, Massol R, Lopes UG, Kirchhausen T, Rao A, Bonni A. The transcription factor NFAT3 mediates neuronal survival. J Biol Chem. 2005;280:2818–2825. doi: 10.1074/jbc.M408741200. [DOI] [PubMed] [Google Scholar]
- Cai H, Lin X, Xie C, Laird FM, Lai C, Wen H, Chiang HC, Shim H, Farah MH, Hoke A, Price DL, Wong PC. Loss of ALS2 function is insufficient to trigger motor neuron degeneration in knock-out mice but predisposes neurons to oxidative stress. J Neurosci. 2005;25:7567–7574. doi: 10.1523/JNEUROSCI.1645-05.2005. [DOI] [PMC free article] [PubMed] [Google Scholar]
- Cardona AE, Pioro EP, Sasse ME, Kostenko V, Cardona SM, Dijkstra IM, Huang D, Kidd G, Dombrowski S, Dutta R, Lee JC, Cook DN, Jung S, Lira SA, Littman DR, Ransohoff RM. Control of microglial neurotoxicity by the fractalkine receptor. Nature neuroscience. 2006;9:917–924. doi: 10.1038/nn1715. [DOI] [PubMed] [Google Scholar]
- Crabtree GR, Olson EN. NFAT signaling: choreographing the social lives of cells. Cell. 2002;109(Suppl):S67–S79. doi: 10.1016/s0092-8674(02)00699-2. [DOI] [PubMed] [Google Scholar]
- Hajishengallis G, Lambris JD. Crosstalk pathways between Toll-like receptors and the complement system. Trends Immunol. 2010;31:154–163. doi: 10.1016/j.it.2010.01.002. [DOI] [PMC free article] [PubMed] [Google Scholar]
- Hayashi F, Smith KD, Ozinsky A, Hawn TR, Yi EC, Goodlett DR, Eng JK, Akira S, Underhill DM, Aderem A. The innate immune response to bacterial flagellin is mediated by Toll-like receptor 5. Nature. 2001;410:1099–1103. doi: 10.1038/35074106. [DOI] [PubMed] [Google Scholar]
- Jiang M, Chen G. High Ca2+-phosphate transfection efficiency in low-density neuronal cultures. Nat Protoc. 2006;1:695–700. doi: 10.1038/nprot.2006.86. [DOI] [PubMed] [Google Scholar]
- Kagan JC, Su T, Horng T, Chow A, Akira S, Medzhitov R. TRAM couples endocytosis of Toll-like receptor 4 to the induction of interferon-beta. Nat Immunol. 2008;9:361–368. doi: 10.1038/ni1569. [DOI] [PMC free article] [PubMed] [Google Scholar]
- Kawai T, Akira S. The role of pattern-recognition receptors in innate immunity: update on Toll-like receptors. Nat Immunol. 2010;11:373–384. doi: 10.1038/ni.1863. [DOI] [PubMed] [Google Scholar]
- Liu J, Farmer JD, Jr, Lane WS, Friedman J, Weissman I, Schreiber SL. Calcineurin is a common target of cyclophilin-cyclosporin A and FKBP-FK506 complexes. Cell. 1991;66:807–815. doi: 10.1016/0092-8674(91)90124-H. [DOI] [PubMed] [Google Scholar]
- Liu Z, Lee J, Krummey S, Lu W, Cai H, Lenardo MJ. The kinase LRRK2 is a regulator of the transcription factor NFAT that modulates the severity of inflammatory bowel disease. Nat Immunol. 2011;12:1063–1070. doi: 10.1038/ni.2113. [DOI] [PMC free article] [PubMed] [Google Scholar]
- Luoma JI, Zirpel L. Deafferentation-induced activation of NFAT (nuclear factor of activated T-cells) in cochlear nucleus neurons during a developmental critical period: a role for NFATc4-dependent apoptosis in the CNS. J Neurosci. 2008;28:3159–3169. doi: 10.1523/JNEUROSCI.5227-07.2008. [DOI] [PMC free article] [PubMed] [Google Scholar]
- Macia E, Ehrlich M, Massol R, Boucrot E, Brunner C, Kirchhausen T. Dynasore, a cell-permeable inhibitor of dynamin. Dev Cell. 2006;10:839–850. doi: 10.1016/j.devcel.2006.04.002. [DOI] [PubMed] [Google Scholar]
- Macian F. NFAT proteins: key regulators of T-cell development and function. Nat Rev Immunol. 2005;5:472–484. doi: 10.1038/nri1632. [DOI] [PubMed] [Google Scholar]
- Meylan E, Burns K, Hofmann K, Blancheteau V, Martinon F, Kelliher M, Tschopp J. RIP1 is an essential mediator of Toll-like receptor 3-induced NF-kappa B activation. Nat Immunol. 2004;5:503–507. doi: 10.1038/ni1061. [DOI] [PubMed] [Google Scholar]
- Minematsu H, Shin MJ, Celil Aydemir AB, Kim KO, Nizami SA, Chung GJ, Lee FY. Nuclear presence of nuclear factor of activated T cells (NFAT) c3 and c4 is required for Toll-like receptor-activated innate inflammatory response of monocytes/macrophages. Cell Signal. 2011;23:1785–1793. doi: 10.1016/j.cellsig.2011.06.013. [DOI] [PMC free article] [PubMed] [Google Scholar]
- Nagamoto-Combs K, Combs CK. Microglial phenotype is regulated by activity of the transcription factor, NFAT (nuclear factor of activated T cells) J Neurosci. 2010;30:9641–9646. doi: 10.1523/JNEUROSCI.0828-10.2010. [DOI] [PMC free article] [PubMed] [Google Scholar]
- Parisiadou L, Xie C, Cho HJ, Lin X, Gu XL, Long CX, Lobbestael E, Baekelandt V, Taymans JM, Sun L, Cai H. Phosphorylation of ezrin/radixin/moesin proteins by LRRK2 promotes the rearrangement of actin cytoskeleton in neuronal morphogenesis. J Neurosci. 2009;29:13971–13980. doi: 10.1523/JNEUROSCI.3799-09.2009. [DOI] [PMC free article] [PubMed] [Google Scholar]
- Poltorak A, He X, Smirnova I, Liu MY, Van Huffel C, Du X, Birdwell D, Alejos E, Silva M, Galanos C, Freudenberg M, Ricciardi-Castagnoli P, Layton B, Beutler B. Defective LPS signaling in C3H/HeJ and C57BL/10ScCr mice: mutations in Tlr4 gene. Science. 1998;282:2085–2088. doi: 10.1126/science.282.5396.2085. [DOI] [PubMed] [Google Scholar]
- Rietschel ET, Brade H. Bacterial endotoxins. Sci Am. 1992;267:54–61. doi: 10.1038/scientificamerican0892-54. [DOI] [PubMed] [Google Scholar]
- Rizzuto R, Brini M, Pizzo P, Murgia M, Pozzan T. Chimeric green fluorescent protein as a tool for visualizing subcellular organelles in living cells. Curr Biol. 1995;5:635–642. doi: 10.1016/S0960-9822(95)00128-X. [DOI] [PubMed] [Google Scholar]
- Rock RB, Gekker G, Hu S, Sheng WS, Cheeran M, Lokensgard JR, Peterson PK. Role of microglia in central nervous system infections. Clin Microbiol Rev. 2004;17:942–964. doi: 10.1128/CMR.17.4.942-964.2004. [DOI] [PMC free article] [PubMed] [Google Scholar]
- Sama MA, Mathis DM, Furman JL, Abdul HM, Artiushin IA, Kraner SD, Norris CM. Interleukin-1beta-dependent signaling between astrocytes and neurons depends critically on astrocytic calcineurin/NFAT activity. J Biol Chem. 2008;283:21953–21964. doi: 10.1074/jbc.M800148200. [DOI] [PMC free article] [PubMed] [Google Scholar]
- Smith JB, Zheng T, Lyu RM. Ionomycin releases calcium from the sarcoplasmic reticulum and activates Na+/Ca2+ exchange in vascular smooth muscle cells. Cell Calcium. 1989;10:125–134. doi: 10.1016/0143-4160(89)90066-3. [DOI] [PubMed] [Google Scholar]
- Wispelwey B, Lesse AJ, Hansen EJ, Scheld WM. Haemophilus influenzae lipopolysaccharide-induced blood brain barrier permeability during experimental meningitis in the rat. J Clin Invest. 1988;82:1339–1346. doi: 10.1172/JCI113736. [DOI] [PMC free article] [PubMed] [Google Scholar]
- Xanthoudakis S, Viola JP, Shaw KT, Luo C, Wallace JD, Bozza PT, Luk DC, Curran T, Rao A. An enhanced immune response in mice lacking the transcription factor NFAT1. Science. 1996;272:892–895. doi: 10.1126/science.272.5263.892. [DOI] [PubMed] [Google Scholar]
- Yu H, van Berkel TJ, Biessen EA. Therapeutic potential of VIVIT, a selective peptide inhibitor of nuclear factor of activated T cells, in cardiovascular disorders. Cardiovasc Drug Rev. 2007;25:175–187. doi: 10.1111/j.1527-3466.2007.00011.x. [DOI] [PubMed] [Google Scholar]
- Zanoni I, Ostuni R, Capuano G, Collini M, Caccia M, Ronchi AE, Rocchetti M, Mingozzi F, Foti M, Chirico G, Costa B, Zaza A, Ricciardi-Castagnoli P, Granucci F. CD14 regulates the dendritic cell life cycle after LPS exposure through NFAT activation. Nature. 2009;460:264–268. doi: 10.1038/nature08118. [DOI] [PubMed] [Google Scholar]
- Zanoni I, Ostuni R, Marek LR, Barresi S, Barbalat R, Barton GM, Granucci F, Kagan JC. CD14 controls the LPS-induced endocytosis of Toll-like receptor 4. Cell. 2011;147:868–880. doi: 10.1016/j.cell.2011.09.051. [DOI] [PMC free article] [PubMed] [Google Scholar]
- Zhang D, Lin J, Han J. Receptor-interacting protein (RIP) kinase family. Cell Mol Immunol. 2010;7:243–249. doi: 10.1038/cmi.2010.10. [DOI] [PMC free article] [PubMed] [Google Scholar]