

Abstract
Spike trains of retinal ganglion cells (RGCs) are the sole source of visual information to the brain; and understanding how the ∼20 RGC types in mammalian retinae respond to diverse visual features and events is fundamental to understanding vision. Suppressed-by-contrast (SbC) RGCs stand apart from all other RGC types in that they reduce rather than increase firing rates in response to light increments (ON) and decrements (OFF). Here, we genetically identify and morphologically characterize SbC-RGCs in mice, and target them for patch-clamp recordings under two-photon guidance. We find that strong ON inhibition (glycine > GABA) outweighs weak ON excitation, and that inhibition (glycine > GABA) coincides with decreases in excitation at light OFF. These input patterns explain the suppressive spike responses of SbC-RGCs, which are observed in dim and bright light conditions. Inhibition to SbC-RGC is driven by rectified receptive field subunits, leading us to hypothesize that SbC-RGCs could signal pattern-independent changes in the retinal image. Indeed, we find that shifts of random textures matching saccade-like eye movements in mice elicit robust inhibitory inputs and suppress spiking of SbC-RGCs over a wide range of texture contrasts and spatial frequencies. Similarly, stimuli based on kinematic analyses of mouse blinking consistently suppress SbC-RGC spiking. Receiver operating characteristics show that SbC-RGCs are reliable indicators of self-generated visual stimuli that may contribute to central processing of blinks and saccades.
SIGNIFICANCE STATEMENT This study genetically identifies and morphologically characterizes suppressed-by-contrast retinal ganglion cells (SbC-RGCs) in mice. Targeted patch-clamp recordings from SbC-RGCs under two-photon guidance elucidate the synaptic mechanisms mediating spike suppression to contrast steps, and reveal that SbC-RGCs respond reliably to stimuli mimicking saccade-like eye movements and blinks. The similarity of responses to saccade-like eye movements and blinks suggests that SbC-RGCs may provide a unified signal for self-generated visual stimuli.
Keywords: blinks, retina, saccades, suppressed-by-contrast
Introduction
Spiking neurons in sensory systems typically signal stimulus features or events by increasing their firing rate. Accordingly, retinal ganglion cells (RGCs) are often divided into ON, OFF, and ON-OFF types, which enhance firing to increases in luminance, decreases in luminance, and both, respectively (Masland, 2001). In 1967, Levick (1967) and Rodieck (1967) discovered RGCs that deviate from these response patterns, and are suppressed by ON and OFF stimuli. Since the original studies in rabbits and cats, suppressed-by-contrast (SbC) RGCs have also been recorded in macaques (de Monasterio, 1978), and matching responses have been observed in downstream visual areas [the dorsolateral geniculate nucleus (dLGN) in macaques (Tailby et al., 2007), and the dLGN and primary visual cortex in mice (Niell and Stryker, 2010; Piscopo et al., 2013)], suggesting that SbC signals are a conserved output of mammalian retinae and that they propagate through the early visual system. Despite recent progress (Sivyer et al., 2010), the circuit mechanisms underlying suppressive responses remain incompletely understood, and how SbC-RGCs contribute to the detection of specific visual features or events has not been explored in detail.
In addition to changes in the external world, the retina experiences self-generated visual stimuli. These include image shifts caused by saccades or saccade-like eye movements (Sakatani and Isa, 2007) and blackouts due to eyelid blinks (Burr, 2005). Both saccades and blinks are omitted from conscious visual experience (Ross et al., 2001; Burr, 2005). The suppression of visual sensitivity during saccades and blinks is thought to contribute to their omission, and appears to involve a combination of retinal and extraretinal mechanisms (Mackay, 1970; Noda and Adey, 1974; Burr, 2005). RGC types were shown to differ in their responses to saccades (Noda and Adey, 1974; Roska and Werblin, 2003), whereas blink responses have not yet been characterized.
Here, we identify SbC-RGCs in mice, and use a combination of transgenic and viral strategies to characterize their dendritic morphology. We target SbC-RGCs under two-photon guidance for patch-clamp recordings and analyze synaptic mechanisms underlying their contrast responses. Based on insights into these mechanisms, we hypothesize that SbC-RGCs could signal self-generated visual stimuli. In support of this notion, we find that SbC-RGCs respond reliably to stimuli mimicking saccade-like eye movements and blinks, suggesting that they may contribute to the central processing of these events.
Materials and Methods
Mice.
Throughout this study, we used young adult (postnatal days 25–35) C57BL/6J (WT) mice or CCK-ires-Cre (Taniguchi et al., 2011) mice crossed to a fluorescent reporter strain (Ai9; Madisen et al., 2010) or injected with adeno-associated virus (AAV) vectors. All procedures were approved by the Animal Studies Committee of Washington University School of Medicine and were performed in compliance with the National Institutes of Health (NIH) Guide for the Care and Use of Laboratory Animals.
Adeno-associated viruses.
Two Brainbow AAV vectors (AAV9-hEF1a-lox-TagBFP-lox-eYFP-lox-WPRE-hGH-InvBYF and AAV9-hEF1a-lox-mCherry-lox-mTFP1-lox-WPRE-hGH-InvCheTF; Cai et al., 2013) were injected (1:1, 250 nl) into the vitreous of newborn CCK-ires-Cre mice as described previously (Soto et al., 2013).
Tissue preparation.
Dark-adapted (for >2 h) mice were killed, and retinae were isolated under infrared illumination (>900 nm), as described previously (Akrouh and Kerschensteiner, 2013).
Imaging.
Fixed retinae (30 min in 4% paraformaldehyde) were imaged on an Fv1000 confocal microscope (Olympus) using a 60 × 1.35 numerical aperture oil-immersion objective. Images were acquired at a voxel size range of 0.206–0.3 μm (x/y-z).
Electrophysiology.
Cell-attached and whole-cell patch-clamp recordings were obtained in dorsal halves (Wang et al., 2011) of dark-adapted retinae superfused (5–7 ml/min) with warm (30–33°C) mouse artificial CSF containing (Akrouh and Kerschensteiner, 2013). Pharmacological antagonists were used in the following concentrations: 1,2,5,6–500 tetrahydropyridine-4-yl-methyl phosphinic acid (TPMPA; 50 μm, Sigma-Aldrich), gabazine (10 μm, Tocris Bioscience), and strychnine (1 μm, Sigma-Aldrich). Intracellular voltage-clamp and current-clamp solutions for identical to those used before (Akrouh and Kerschensteiner, 2013). Reported voltages were corrected for liquid junction potentials. EPSCs and IPSCs were recorded at the reversal potential for Cl− (−60 mV) and cations (0 mV), respectively. SbC-RGCs were targeted under two-photon guidance in CCK-ires-Cre Ai9 mice. Correct targeting was confirmed by monitoring the diffusion of a fluorescent dye (Alexa Fluor 488) from the recording electrode into the soma during break-in and by reconstructing the morphology of dendrites at the end of each recording. Microelectrode array (MEA) recordings were performed with 252-electrode arrays (Multi Channel Systems) and spike trains sorted as previously described (Akrouh and Kerschensteiner, 2013). We used MEA data to compare responses of a large population of non-SbC-RGCs to genetically identified SbC-RGCs recorded via patch clamp. Toward this end, we removed RGCs showing suppressive responses to positive and negative contrast steps from our MEA data.
Blink recordings.
To measure the kinematics of blinking, freely moving mice were filmed at 500 frames/s with a high-speed video camera (IDT). Room lighting (corneal irradiance, 2 × 10¹³ photons/cm2/s) was supplemented by illumination from an infrared LED (peak wavelength, 940 nm). A total of 11 blinks was recorded from four female WT mice. Eyelid separation as a function of time was analyzed using ImageJ (NIH). On average (±SEM) blinks lasted 114 ± 10 ms.
Visual stimuli.
Stimuli were written in MATLAB (MathWorks) using Cogent graphics extensions (John Romaya, University College London, London, UK) and were presented on an organic light-emitting display (eMagin; refresh rate, 60 Hz) focused onto photoreceptors. Stimuli were centered on the soma of the recorded cell (patch clamp) or on the MEA. Unless noted otherwise, the mean intensity of stimuli was 1500 rhodopsin isomerization/rod/s (R*), calculated based on a collection area of 0.87 μm2 (Lyubarsky et al., 2004). To probe spatial response profiles, the intensity of a circular area of varying size was square wave modulated at 0.25 Hz (Michelson contrast, 100%). To test contrast sensitivity, 250 ms luminance steps from the mean intensity were shown over the receptive field center every 2.25 s. To evaluate responses to saccade-like eye movements, patterns with different contrasts (Michelson contrast, 25%, 50%, or 100%) and texture scales (50, 100, or 200 μm) were generated by convolving random binary maps with 2D Gaussian filters. Textures were fixed for 1 s followed by 100 ms shifts in random directions over 14° of visual space, matching properties of saccade-like eye movements in mice (Sakatani and Isa, 2007). Blinks were simulated using the same random patterns and lasted 117 ms (i.e., 7 frames). During the first 3 frames, the random pattern stimulus was dimmed in equal increments from a mean of 1500 R* to 1.5 R*. The display remained at 1.5 R* for 1 additional frame before it brightened back to 1500 R* over the next 3 frames. When testing the reliability of eye movement and blink detection, trials of the respective stimuli were alternated.
Analysis.
Electrophysiology data were analyzed using scripts written in MATLAB. Responses (spike rate, conductance, or charge) were measured as baseline-subtracted averages during 100–200 ms time windows. The ability to detect blinks and saccades based on responses of SbC-RCGs was analyzed using receiver operating characteristics (ROCs; Britten et al., 1992). To construct ROC curves, we compared firing rates during prestimulus (rpre) and stimulus (rstim) time windows to 10 threshold values (z) spanning the range of rpre values and plotted the hit rate (β) as a function of the false alarm rate (α), with α and β defined by the following probabilities (p):
 |
 |
The performance of each cell was then quantified by the area under its ROC curve, a parameter that varies from 0.5 for chance performance to a maximal value of 1.
Territories of ON and OFF dendrites were measured as the areas of the smallest convex polygons to encompass the respective arbors in maximum intensity projections in ImageJ.
Population data are reported as the mean ± SEM throughout the text. Paired and unpaired t tests were used to assess the statistical significance of observed differences.
Results
Rabbit SbC-RGCs (or uniformity detector RGCs) are bistratified neurons with larger ON arbors in sublaminae 4/5 (S4/5) of the inner plexiform layer and smaller OFF arbors in S1, from where branches frequently dive back to S4/5 (Sivyer et al., 2010). RGCs with similar features were recently described in CCK-ires-Cre mice (Zhu et al., 2014). To further analyze the morphology of these cells, we injected Brainbow AAVs (Cai et al., 2013) into the vitreous of CCK-ires-Cre mice. Approximately half of the RGCs labeled in this way resembled rabbit SbC-RGCs. Their ON dendrites cover larger territories than their OFF dendrites (Fig. 1A,B), and both arbors are connected by numerous ascending and descending processes distributed evenly across dendritic fields (Fig. 1C). In targeted patch-clamp recordings, these neurons showed high baseline firing rates (18.7 ± 1.7 Hz, n = 16) that were transiently suppressed by light increments and decrements in rod- and cone-dominant conditions, identifying them as SbC-RGCs (Fig. 1D).
Figure 1.
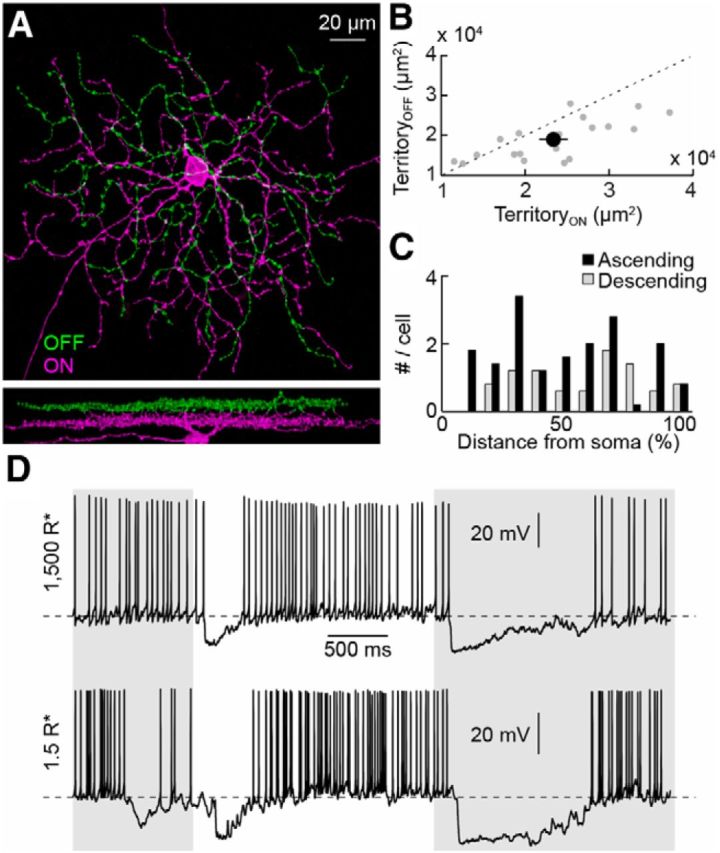
Morphology and light responses of SbC-RGCs. A, Top-down (top) and side (bottom) views of an SbC-RGC labeled by Brainbow AAV infection. Dendrites in the OFF (ON) sublamina are shown in green (magenta). Their stratification in S1 (S4/5) was confirmed by staining for choline acetyltransferase (data not shown). B, Scatter plot of ON versus OFF dendritic territories measured as the areas of the smallest convex polygons to encompass the respective arbors in z-projections. Gray dots show data from individual cells (n = 19), and the black circle (error bar) indicates the mean (±SEM) of the population. C, Distribution of ascending and descending branches as a function of distance from the soma to the edge of the dendritic field (n = 5). D, Spike responses of SbC-RGCs to a stimulus in which the intensity of a spot (diameter, 200 μm) was modulated by a step function (2 s ON, 3 s OFF) in cone-dominant (mean intensity, 1500 R*; top trace) and rod-dominant (mean intensity, 1.5 R*; bottom trace) illumination conditions. Periods of light OFF are shaded in gray. Resting membrane potentials (1500 R*, −54 mV; 1.5 R*, −53 mV) are indicated by dashed lines.
Probing spatial profiles of ON and OFF responses, we found that spike suppression of SbC-RGCs increases with stimulus size, plateauing for spot diameters of >200 μm (Fig. 2A,B). Voltage-clamp recordings revealed that SbC-RGCs receive strong synaptic inhibition with moderate surround suppression at light ON and OFF (Fig. 2D–F). By comparison, excitatory input was weak and increased at light ON, but decreased from baseline at light OFF (Fig. 2G–I), and showed no surround suppression. Aligned with the peak of ON excitation, some SbC-RGCs showed a transient increase in firing preceding spike suppression.
Figure 2.
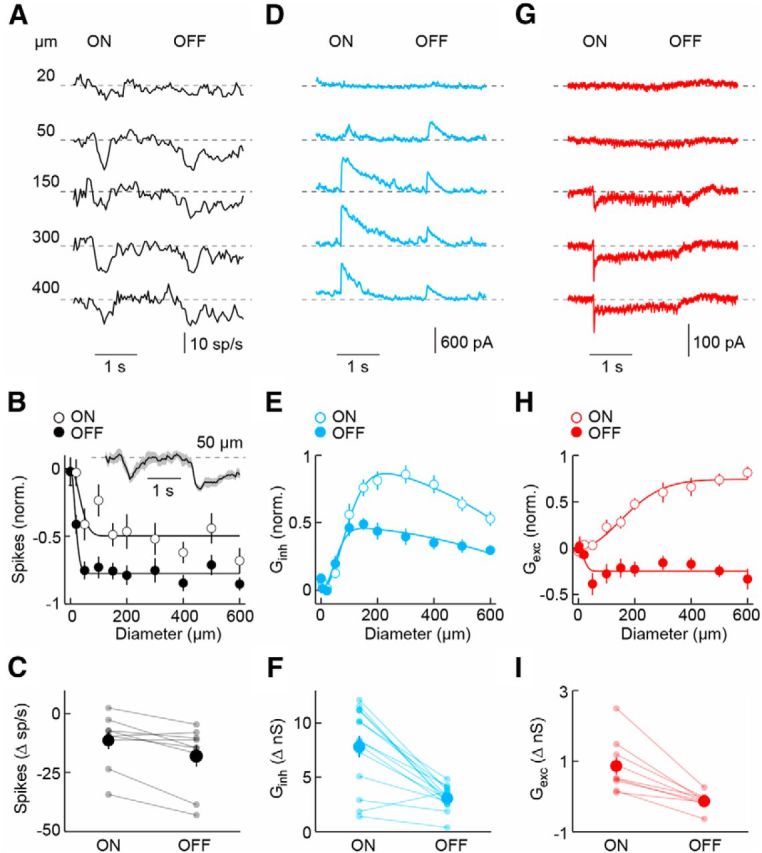
Spatial response and synaptic input profiles of SbC-RGCs. A, D, G, Representative spike (A, 40 ms bins), IPSC (D), and EPSC (G) responses to stimuli in which intensity in a circular area (diameter noted in A) is modulated by a square wave (2 s ON, 2 s OFF). B, E, H, Summary data of ON (open circles) and OFF (filled circles) sensitivity profiles of SbC-RGCs for spike responses (B, n = 9), inhibitory (E, n = 14; Ginh), and excitatory synaptic conductances (H, n = 9; Gexc). The responses of each cell were normalized to the maximal absolute response amplitude of that cell. The average (±SEM) spike response of SbC-RGCs to 50 μm stimuli is shown as a line (shaded area) inset in B. Single-Gaussian (B, H) and difference-of-Gaussian (E) fits are shown as solid lines. C, F, I, Amplitudes of ON and OFF responses to circles with a diameter of 300 μm. Dots show data from individual cells and circles (error bar) indicate mean (±SEM) of respective population. Spike suppression was greater at light OFF than ON (p < 0.01, n = 9), inhibition (Ginh) greater at light ON than OFF (p < 10−4, n = 14), and excitation (Gexc) greater at light ON than OFF (p < 0.01, n = 9).
We next characterized the contrast sensitivity of spike responses and synaptic inhibition of SbC-RGCs, presenting 250 ms light steps from a gray background in a circular area (diameter, 200 μm) centered on the cell. Positive and negative contrast steps with increasing amplitudes progressively suppress the firing of SbC-RGCs (Fig. 3A,B) and elicit increasing IPSCs (Fig. 3C,D). Suppression by ON stimuli is weaker than by OFF stimuli and is preceded, on average, by a transient increase in firing. Both features are likely the results of ON excitation (Fig. 2G–I).
Figure 3.

Contrast response functions and pharmacology of SbC-RGCs. A, C, Representative spike (A, 20 ms bins) and IPSC (C) responses to positive (ON, left column) and negative (OFF, right column) contrast steps presented in a spot (diameter, 200 μm) centered on the recorded cell. Bars indicate the duration of each step. B, D, Contrast response functions of the normalized spike rate (B, n = 9) and the inhibition (D, n = 6). The average (±SEM) spike responses of SbC-RGCs to −50%, 10%, and 80% contrast steps (Weber contrast) are shown as a lines (shaded areas) inset in B. E, F, Representative IPSC traces elicited by ON and OFF steps (diameter, 200 μm) in the presence of gabazine (GABAA), strychnine (Gly), TPMPA (GABAC), and combinations thereof. G, Normalized charge measurements (Qinh; mean ± SEM) show decreased ON inhibition (p < 0.003, n = 5) but not OFF inhibition (p > 0.5) in the presence of gabazine, decreased ON inhibition (p < 0.05, n = 3) and OFF inhibition (p < 0.05) in the presence of TPMPA, decreased ON inhibition (p < 10−4, n = 5) and OFF inhibition (p < 10−3) in the presence of strychnine, decreased ON inhibition (p < 0.03, n = 4) and OFF inhibition (p < 0.05) in the presence of gabazine and strychnine, and decreased ON inhibition (p < 10−6, n = 4) and OFF inhibition (p < 10−5) in the presence of gabazine, strychnine, and TPMPA. H, Representative IPSCs elicited by counter-phase modulation of a narrow grating (bar width, 50 μm) over the receptive field (diameter, 200 μm; top) are compared with IPSCs elicited by uniform sine wave modulation of the same area (bottom).
To elucidate the mechanisms of SbC-RGC inhibition, we applied antagonists of GABAA, GABAC, and glycine receptors. Results from these experiments indicate that glycinergic amacrine cells are the dominant source of ON and OFF inhibition to SbC-RGCs (Fig. 3E–G). GABAergic amacrine cells contribute to the inhibitory input via a mixture of GABAA and GABAC receptors at light ON, and only GABAC receptors at light OFF. Different amacrine cells and postsynaptic receptors thus cooperate to suppress the spiking of SbC-RGCs.
Stimulation with narrow sign-inverting gratings elicited frequency-doubled IPSCs, indicating that inhibitory receptive fields of SbC-RGCs are composed of rectified subunits (Fig. 3H; Enroth-Cugell and Robson, 1966; Schwartz et al., 2012). The combination of this nonlinear spatial integration and suppression by full-field stimuli (Fig. 2) led us to hypothesize that SbC-RGCs could signal pattern-independent global changes in the retinal image. Global image changes are characteristic of self-generated visual stimuli, including eye movements (image shifts) and blinks (blackouts). Random texture images shifted with kinetics matching saccade-like eye movements in mice (Sakatani and Isa, 2007), elicited strong inhibitory inputs independent of the image contrast (25–100%; Fig. 4A). As a result, the spiking of SbC-RGCs was consistently suppressed by this stimulus, whereas most other RGCs failed to respond or increased their firing (Fig. 4B). Similarly, invariant synaptic inhibition and spike suppression were observed in SbC-RGCs, and no responses or increased firing in other RGCs, when the texture scales of the shifted images were altered (50–200 μm; Fig. 4C,D). To characterize the reliability of this response, SbC-RGCs were shown a series of 10 random image shifts. The consistency of spike suppression reflected in ROC curves constructed from their responses suggests that SbC-RGCs can reliably signal saccade-like eye movements (Fig. 4E; area under the curve, 0.89 ± 0.02; n = 5).
Figure 4.

SbC-RGC responses to stimuli mimicking saccade-like eye movements and blinks. A, B, IPSC responses (A) and spike responses (B, 40 ms bins) to shifts of random textures with different contrasts (25%, 50%, and 100%). A, Top, Illustrations of image patterns. Middle, Representative IPSC responses to shifted images with different contrasts (texture scale, 100 μm). Bottom, Probability distribution of inhibitory (Ginh) responses to saccade-like stimuli (n = 60 saccades recorded in four SbC-RGCs). B, Top, Representative spike responses to the same stimuli as in A. Bottom, Probability distribution of spike responses of SbC-RGCs (gray bars, n = 105 saccades recorded in seven cells) and non-SbC-RGCs (white bars, n = 3615 saccades recorded in 241 cells on MEAs). C, D, Analogous to A (C) and B (D), but for shifts of images with different texture scales (50, 100, and 200 μm), as illustrated at the top. The same numbers of saccades and cells were recorded in C and D as in A and B, respectively. Traces in A and C, and B and D, were recorded in the same cell and two examples are therefore repeated. E, F, Representative spike responses to stimuli mimicking a series of saccade-like eye movements (E) and blinks (F). E, Top, Texture images (contrast, 50%; scale, 100 μm) shifted successively in 10 random directions. Bottom, Representative spike responses (40 ms bins) to image shifts and mean (±SEM) ROC curves (bottom right) illustrating the ability to detect shifts based on SbC-RGC responses (n = 5 cells). The dashed line shows the unity diagonal of hit rate (β) and false-alarm rate (α). F, Top middle, Eyelid separation as a function of time recorded in four WT mice. Thin gray traces show individual blinks, whereas the thick black line indicates the population average. Top right, The distribution of blink durations. Gray dots show data from each blink (n = 11), and the black circle (error bar) indicates the mean (±SEM) of the population. Bottom, Representative spike responses to blackouts and mean (±SEM) ROC curves (bottom right) illustrating the ability to detect blinks based on SbC-RGC responses (n = 5 cells).
We used high-speed videography to analyze mouse blinking (Fig. 4F). The presentation of image blackouts with dimming kinetics matching recorded blinks consistently suppressed SbC-RGCs regardless of the image patterns preceding and following the blink (Fig. 4F). Moreover, blink responses and ROC curves (area under the curve, 0.93 ± 0.02; n = 5) closely resembled those observed for saccade-like eye movements, suggesting that SbC-RGCs may provide a unified signal for these events, which are similarly omitted from visual experience.
Discussion
The mouse SbC-RGCs identified here share key response properties with SbC-RGCs in other species (Levick, 1967; Rodieck, 1967; de Monasterio, 1978; Sivyer et al., 2010). Morphological features of these cells appear to also be conserved (Fig. 1; Sivyer and Vaney, 2010). Bistratification facilitates the convergence of ON and OFF inhibitory inputs onto SbC-RGC dendrites, which is critical for their responses. The frequent transitions of dendrites between layers imply that ON and OFF inputs can interact before reaching the soma, but the functional significance of this arrangement remains to be tested.
High spontaneous firing rates of SbC-RGCs lay the foundation for stimulus encoding by suppression. Rabbit SbC-RGCs receive tonic excitation and generate complex spikes (i.e., Na+ spikelets riding atop slower Ca2+-mediated depolarizations; Sivyer et al., 2010). Mouse SbC-RGCs similarly receive tonic excitatory input, but generate simple spikes (Fig. 1). Simple spikes tend to be transmitted more reliably than their complex counterparts (Khaliq and Raman, 2005), suggesting that responses of SbC-RGCs propagate faithfully through the early visual system of mice and are the source of suppressed-by-contrast responses in dLGN and V1 (Niell and Stryker, 2010; Piscopo et al., 2013).
In response to positive, but not negative, contrast steps, the spike suppression of SbC-RGCs is preceded by a transient increase in firing (Fig. 3). This asymmetry, which is explained by differences in synaptic excitation at light ON and OFF (Fig. 2), could be used by downstream areas to determine the direction of contrast transitions (positive or negative), whereas the extent of suppression signals the absolute amplitude of the respective change. It is worth noting that for patterned stimuli (Fig. 4), which simultaneously recruit ON and OFF pathways, responses are purely suppressive, reflecting the overall dominance of inhibitory inputs.
Glycinergic amacrine cells provide a majority of ON and OFF inhibition (Fig. 3; Sivyer et al., 2010). The remaining input appears to be mediated by GABAA and GABAC receptors at light ON, and only GABAC receptors at light OFF. Because inhibitory receptive fields are composed of rectified subunits, inhibition can be elicited by texture movements regardless of the precise patterns involved (Fig. 4; Enroth-Cugell and Robson, 1966; Schwartz et al., 2012). This property, combined with suppressive responses to full-field stimuli, led us to hypothesize that SbC-RGCs could signal global changes in the retinal image that occur during eye movements and blinks. The reliable suppression that we observe when simulating saccade-like eye movements and blinks supports this notion. Given these responses, the conservation of SbC signals across mammalian species (Levick, 1967; Rodieck, 1967; de Monasterio, 1978; Sivyer et al., 2010), and their propagation up to primary visual cortex (Tailby et al., 2007; Niell and Stryker, 2010; Piscopo et al., 2013), it is tempting to speculate that SbC-RGCs may contribute to the central processing of saccades and blinks (Noda and Adey, 1974; Burr, 2005).
Although most mouse RGCs failed to respond or showed increased firing in response to the saccade-like stimuli presented here (Fig. 4), several non-SbC-RGCs were shown to be suppressed by image shifts in rabbit retinae (Roska and Werblin, 2003). Thus, as for other features (i.e., motion direction), multiple RGC types may cooperate in the detection of eye movements. SbC-RGCs are suppressed by a range of stimuli (Levick, 1967; Sivyer et al., 2010). Given the pattern invariance of their responses, global image changes during saccade-like eye movements and blinks are expected to synchronously suppress most SbC-RGCs, generating a specific population signal. The similarity of the responses to saccade-like eye movements and blinks suggests that SbC-RGCs may provide a unified signal for these self-generated stimuli.
Footnotes
This work was supported by grants from the Research to Prevent Blindness Foundation (Career Development Award to D.K. and an unrestricted grant to the Department of Ophthalmology and Visual Sciences at Washington University School of Medicine in St. Louis) and the National Institutes of Health (Grants R01-EY-021855 and R01-EY-023341 to D.K.; Grant T32-EY-013360-13 to J.P.; and Grant P30-EY-0268 to the Department of Ophthalmology and Visual Sciences at Washington University School of Medicine in St. Louis). We thank the members of the Kerschensteiner laboratory for helpful discussions and comments on the manuscript.
The authors declare no competing financial interests.
References
- Akrouh A, Kerschensteiner D. Intersecting circuits generate precisely patterned retinal waves. Neuron. 2013;79:322–334. doi: 10.1016/j.neuron.2013.05.012. [DOI] [PMC free article] [PubMed] [Google Scholar]
- Britten KH, Shadlen MN, Newsome WT, Movshon JA. The analysis of visual motion: a comparison of neuronal and psychophysical performance. J Neurosci. 1992;12:4745–4765. doi: 10.1523/JNEUROSCI.12-12-04745.1992. [DOI] [PMC free article] [PubMed] [Google Scholar]
- Burr D. Vision: in the blink of an eye. Curr Biol. 2005;15:R554–R556. doi: 10.1016/j.cub.2005.07.007. [DOI] [PubMed] [Google Scholar]
- Cai D, Cohen KB, Luo T, Lichtman JW, Sanes JR. Improved tools for the Brainbow toolbox. Nat Methods. 2013;10:540–547. doi: 10.1038/nmeth.2450. [DOI] [PubMed] [Google Scholar]
- de Monasterio FM. Properties of ganglion cells with atypical receptive-field organization in retina of macaques. J Neurophysiol. 1978;41:1435–1449. doi: 10.1152/jn.1978.41.6.1435. [DOI] [PubMed] [Google Scholar]
- Enroth-Cugell C, Robson JG. The contrast sensitivity of retinal ganglion cells of the cat. J Physiol. 1966;187:517–552. doi: 10.1113/jphysiol.1966.sp008107. [DOI] [PMC free article] [PubMed] [Google Scholar]
- Khaliq ZM, Raman IM. Axonal propagation of simple and complex spikes in cerebellar Purkinje neurons. J Neurosci. 2005;25:454–463. doi: 10.1523/JNEUROSCI.3045-04.2005. [DOI] [PMC free article] [PubMed] [Google Scholar]
- Levick WR. Receptive fields and trigger features of ganglion cells in the visual streak of the rabbits retina. J Physiol. 1967;188:285–307. doi: 10.1113/jphysiol.1967.sp008140. [DOI] [PMC free article] [PubMed] [Google Scholar]
- Lyubarsky AL, Daniele LL, Pugh EN., Jr From candelas to photoisomerizations in the mouse eye by rhodopsin bleaching in situ and the light-rearing dependence of the major components of the mouse ERG. Vision Res. 2004;44:3235–3251. doi: 10.1016/j.visres.2004.09.019. [DOI] [PubMed] [Google Scholar]
- Mackay DM. Elevation of visual threshold by displacement of retinal image. Nature. 1970;225:90–92. doi: 10.1038/225090a0. [DOI] [PubMed] [Google Scholar]
- Madisen L, Zwingman TA, Sunkin SM, Oh SW, Zariwala HA, Gu H, Ng LL, Palmiter RD, Hawrylycz MJ, Jones AR, Lein ES, Zeng H. A robust and high-throughput Cre reporting and characterization system for the whole mouse brain. Nat Neurosci. 2010;13:133–140. doi: 10.1038/nn.2467. [DOI] [PMC free article] [PubMed] [Google Scholar]
- Masland RH. The fundamental plan of the retina. Nat Neurosci. 2001;4:877–886. doi: 10.1038/nn0901-877. [DOI] [PubMed] [Google Scholar]
- Niell CM, Stryker MP. Modulation of visual responses by behavioral state in mouse visual cortex. Neuron. 2010;65:472–479. doi: 10.1016/j.neuron.2010.01.033. [DOI] [PMC free article] [PubMed] [Google Scholar]
- Noda H, Adey WR. Retinal ganglion cells of the cat transfer information on saccadic eye movement and quick target motion. Brain Res. 1974;70:340–345. doi: 10.1016/0006-8993(74)90323-0. [DOI] [PubMed] [Google Scholar]
- Piscopo DM, El-Danaf RN, Huberman AD, Niell CM. Diverse visual features encoded in mouse lateral geniculate nucleus. J Neurosci. 2013;33:4642–4656. doi: 10.1523/JNEUROSCI.5187-12.2013. [DOI] [PMC free article] [PubMed] [Google Scholar]
- Rodieck RW. Receptive fields in the cat retina: a new type. Science. 1967;157:90–92. doi: 10.1126/science.157.3784.90. [DOI] [PubMed] [Google Scholar]
- Roska B, Werblin F. Rapid global shifts in natural scenes block spiking in specific ganglion cell types. Nat Neurosci. 2003;6:600–608. doi: 10.1038/nn1061. [DOI] [PubMed] [Google Scholar]
- Ross J, Morrone MC, Goldberg ME, Burr DC. Changes in visual perception at the time of saccades. Trends Neurosci. 2001;24:113–121. doi: 10.1016/S0166-2236(00)01685-4. [DOI] [PubMed] [Google Scholar]
- Sakatani T, Isa T. Quantitative analysis of spontaneous saccade-like rapid eye movements in C57BL/6 mice. Neurosci Res. 2007;58:324–331. doi: 10.1016/j.neures.2007.04.003. [DOI] [PubMed] [Google Scholar]
- Schwartz GW, Okawa H, Dunn FA, Morgan JL, Kerschensteiner D, Wong RO, Rieke F. The spatial structure of a nonlinear receptive field. Nat Neurosci. 2012;15:1572–1580. doi: 10.1038/nn.3225. [DOI] [PMC free article] [PubMed] [Google Scholar]
- Sivyer B, Vaney DI. Dendritic morphology and tracer-coupling pattern of physiologically identified transient uniformity detector ganglion cells in rabbit retina. Vis Neurosci. 2010;27:159–170. doi: 10.1017/S0952523810000234. [DOI] [PubMed] [Google Scholar]
- Sivyer B, Taylor WR, Vaney DI. Uniformity detector retinal ganglion cells fire complex spikes and receive only light-evoked inhibition. Proc Natl Acad Sci U S A. 2010;107:5628–5633. doi: 10.1073/pnas.0909621107. [DOI] [PMC free article] [PubMed] [Google Scholar]
- Soto F, Watkins KL, Johnson RE, Schottler F, Kerschensteiner D. NGL-2 regulates pathway-specific neurite growth and lamination, synapse formation, and signal transmission in the retina. J Neurosci. 2013;33:11949–11959. doi: 10.1523/JNEUROSCI.1521-13.2013. [DOI] [PMC free article] [PubMed] [Google Scholar]
- Tailby C, Solomon SG, Dhruv NT, Majaj NJ, Sokol SH, Lennie P. A new code for contrast in the primate visual pathway. J Neurosci. 2007;27:3904–3909. doi: 10.1523/JNEUROSCI.5343-06.2007. [DOI] [PMC free article] [PubMed] [Google Scholar]
- Taniguchi H, He M, Wu P, Kim S, Paik R, Sugino K, Kvitsani D, Fu Y, Lu J, Lin Y, Miyoshi G, Shima Y, Fishell G, Nelson SB, Huang ZJ. A resource of Cre driver lines for genetic targeting of GABAergic neurons in cerebral cortex. Neuron. 2011;71:995–1013. doi: 10.1016/j.neuron.2011.07.026. [DOI] [PMC free article] [PubMed] [Google Scholar]
- Wang YV, Weick M, Demb JB. Spectral and temporal sensitivity of cone-mediated responses in mouse retinal ganglion cells. J Neurosci. 2011;31:7670–7681. doi: 10.1523/JNEUROSCI.0629-11.2011. [DOI] [PMC free article] [PubMed] [Google Scholar]
- Zhu Y, Xu J, Hauswirth WW, DeVries SH. Genetically targeted binary labeling of retinal neurons. J Neurosci. 2014;34:7845–7861. doi: 10.1523/JNEUROSCI.2960-13.2014. [DOI] [PMC free article] [PubMed] [Google Scholar]