Abstract
Surface-enhanced Raman spectroscopy (SERS) represents a very powerful tool for the identification of molecular species, but unfortunately it has been essentially restricted to noble metal supports (Au, Ag and Cu). While the application of semiconductor materials as SERS substrate would enormously widen the range of uses for this technique, the detection sensitivity has been much inferior and the achievable SERS enhancement was rather limited, thereby greatly limiting the practical applications. Here we report the employment of non-stoichiometric tungsten oxide nanostructure, sea urchin-like W18O49 nanowire, as the substrate material, to magnify the substrate–analyte molecule interaction, leading to significant magnifications in Raman spectroscopic signature. The enrichment of surface oxygen vacancy could bring additional enhancements. The detection limit concentration was as low as 10−7 M and the maximum enhancement factor was 3.4 × 10⁵, in the rank of the highest sensitivity, to our best knowledge, among semiconducting materials, even comparable to noble metals without ‘hot spots'.
 Surface-enhanced Raman spectroscopy is widely used for rapid and sensitive molecular detection in chemistry and biology, but typically relies on noble metals. Here the authors report a non-stoichiometric semiconducting material with defect-rich surface that displays excellent detection limits and enhancement factors.
The surface-enhanced Raman scattering (SERS) effect is a surface-sensitive technique characterized by an increase in the Raman intensity by orders of magnitude for molecules adsorbed on particular surfaces such as rough metals with respect to that expected from the same number of non-adsorbed molecules in solution or the gas phase1,2. The enhanced sensitivity makes the technique serve as one of the most powerful analytical tools for the unequivocal identification of chemical and biological analytes and additionally in numerous other fields, such as electrochemistry, surface science, catalysis, chemical and biomolecular sensing and so on1,3,4. While the exact mechanism for the enhancement effect is still a matter of debate, two widely accepted theories have been adopted in most cases to explain the phenomenon5. The primary one is electromagnetic mechanism predicting that the electric field is magnified when excitation takes place within localized surface plasmon resonances of substrate materials, leading to enhancement factors (EFs) up to the order of 106. The induced enhancement of local field by plasmonic coupling is called electromagnetic ‘hot spots'. The other is a chemical mechanism proposing the formation of charge-transfer complexes between the chemisorbed species and the substrate materials and obtaining enhancement when the excitation frequency is in resonance with the charge-transfer transition with EFs around 10–100. SERS experiments have been essentially dominated by adsorbates on rough metallic surfaces, especially noble and alkali metals such as Au, Ag and Cu, because their plasmon resonance frequencies locate within excitation wavelength ranges commonly used in Raman spectroscopy. While precise tuneable position of adjacent metallic nanoparticles is a key factor to bring about strong plasmonic coupling, fabricating perfect plasmonic nanostructures with high density ‘hot spots' to achieve high enhancements usually requires delicate procedures and high cost. In addition, noble metals typically show poor stability and biocompatibility, and therefore the search of other alternative materials for working as SERS substrate becomes an urgent task. A few semiconducting materials have been proven to show Raman enhancement, for example, InAs/GaAs quantum dots6, CuTe nanocrystals7, Cu2O nanospheres8 and TiO2 nanostructures9,10, in which charge transfer at the semiconductor–analyte interface plays a major role in Raman scattering enhancement. The TiO2 SERS substrate offers not only a biocompatibility, but also a greater chemical and mechanical stability against variation in pH or temperature of the environment9. The effective utilization of semiconductor SERS-active substrates would greatly expand the applications of SERS in many fields, such as direct monitoring of interfacial chemical reactions on individual nanoparticles11. However, one significant problem of metal-free SERS-active substrates is that the EFs were typically quite low, usually in the range of 10–102, far from sufficient for applications in biological and biomedical analysis and diagnosis. It is consequently one formidable challenge but greatly desirable to find efficient semiconductor SERS substrate materials and obtain EFs comparable to noble metals.
The surface states of substrate material and its interaction with analyte molecule is a key to the SERS effect. Among the numerous methods in tuning the surface states of semiconducting oxide materials, adjusting oxygen deficiency represents one main strategy and may work as an efficient and simple way to achieve the goal of high sensitivity comparable to that of noble metals. Tungsten oxide materials, a traditional semiconductor, have attracted considerable attention because they possess distinctive physical and chemical properties, which endow them to be effective candidates in a wide range of applications, covering photocatalysts, gas sensors and electrochromic devices12,13,14. Importantly, rich phases of substoichiometric composition (WO3−x) can be obtained by the reduction and formation of various types of defect structure, such as WO2.72 (W18O49), WO2.8 (W5O14), WO2.92 (W25O73) and so on15,16,17,which makes the system work as an ideal platform for investigating the effect of vacancies or defects on SERS phenomenon. WO2.72 (W18O49) with the largest vacancy has been reported as the only oxide that can be isolated in a pure form, which contains tungsten ions of mixed valency16,18.
Herein, employing vacancy-containing W18O49 as the substrate material, we achieve greatly enhanced SERS effect for the first time on function-rich tungsten oxide material, and the enhancement is further improved by creating surface deficiencies, which gives SERS EF as high as 3.4 × 10⁵ and 100–10,000 times higher than the previously reported values for most other semiconductor SERS-active substrates, and even comparable to noble metals without ‘hot spots'.
Results
Sample characterizations
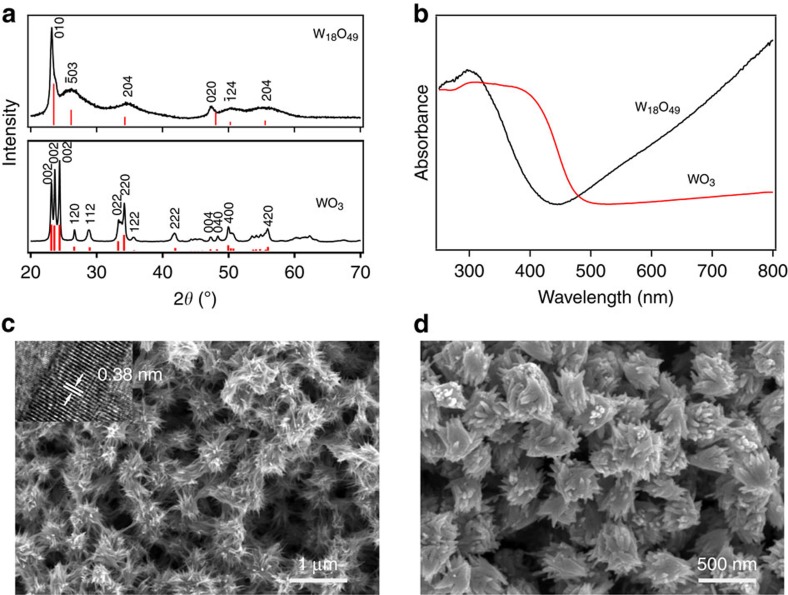
W18O49 was synthesized using a previously reported approach, WCl6 dissolved in ethanol followed by hydrothermal reaction at 180 °C for 24 h (ref. 13). Phase and purity of the sample was verified by X-ray diffraction characterizations as shown in Fig. 1a. The hydrothermally synthesized sample was crystallized in a monoclinic phase of W18O49 (P2/m, JCPDS no. 84-1516) with lattice constants refined to be a=18.31(2), b=3.839(8), c=14.00(1) Å and β=115.19(9)°. The relatively high intensities and narrowing exhibited by (010) and (020) peaks suggest that the crystals preferably grew along the b axis as a result of retarded growth along the close-packed (010) planes. For comparison study, tungsten trioxide, WO3, was acquired by annealing the W18O49 sample in air. The transformed WO3 was also of high purity with all reflections perfectly fitted in stoichiometric monoclinic (no. 14, P21/n) tungsten trioxide with cell dimensions a=7.305(5), b=7.523(4), c=7.689(4) Å and β=90.90(9)°. To obtain more information about the intrinsic nature of the samples, ultraviolet–visible absorption spectra of the two samples were collected (Fig. 1b). Distinct from the absorption to 500 nm normally observed in tungsten oxide materials, W18O49 sample exhibited an obvious blue shift of the absorption edge. In addition, an absorption tail beyond the absorption edge in the visible and near-infrared region was observed, up to the measurement limit, 800 nm, which can be considered to be closely related with the free electrons and/or oxygen deficiency-induced small polarons15, providing clear evidence that the as-synthesized W18O49 sample contains a large number of oxygen vacancies. Morphology of the samples were characterized by scanning electron microscope observations, which suggested that the as-grown W18O49 sample comprised of thin nanowires with average length estimated to be about several micrometres while width in the range of 10–20 nm (Fig. 1c). The nanowires were entangled featuring a prickly, spherical and sea urchin-like morphology. High-resolution transmission electron microscopy on one single nanowire discerned clear lattice fringes belonging to (010) planes of monoclinic W18O49 with an interplanar spacing of ∼0.38 nm (inset in Fig. 1c), which undoubtedly indicates that the nanowires preferably grow along the [010] direction, in good agreement with X-ray diffraction observations. After annealing in air and oxidizing into WO3, the morphology was featureless, showing irregular particles of several micrometres (Fig. 1d).
Figure 1. Characterization of W18O49 and annealed WO3 samples.
(a) X-ray diffraction patterns of as-obtained W18O49 sample and annealed WO3 with all reflections perfectly indexed; (b) ultraviolet–visible profile comparison between W18O49 sample and annealed WO3, showing a blue shift and an obvious absorption tail beyond the edge that may arise from the presence of oxygen vacancies; (c,d) scanning electron microscopy images for W18O49 and WO3 samples, respectively. Inset in (c): high-resolution transmission electron microscopy image on one single nanowire illustrating clear lattice fringe of 0.38 nm, which suggested that the nanowire growth was along the [010] direction.
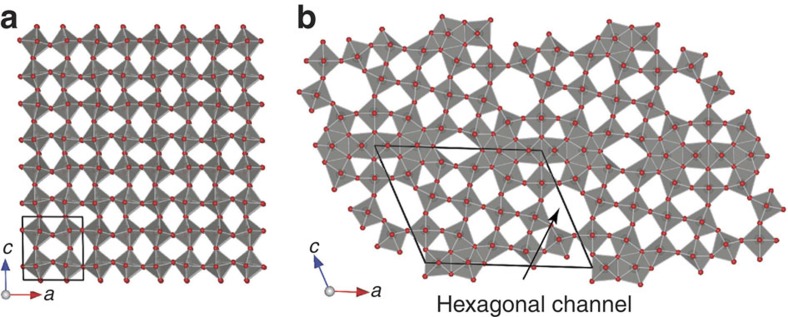
The defect structure of W18O49 is illustrated in Fig. 2, in comparison with the perfect structure of WO3, projected along the [010] direction. The crystal structure of WO3 consists of slabs of corner-sharing WO6 octahedra (ReO3-type), which have an infinite extension in two dimensions (ac plane) and a finite, characteristic width in the [010] direction. The slabs are mutually linked, forming channels between the octahedra. In contrast, the reduction of WO3 to W18O49 leads to structural changes of the ReO3-type structure and the formation of tungsten pentagonal columns causes the arising of additional hexagonal channels19. The presence of oxygen defects may enrich the surface states of semiconductor and enhance the interaction affinity between the adsorbent and adsorbate, providing promises for enhancements in Raman signals.
Figure 2. Structure illustration for WO3 and W18O49 in [010] projection.
(a) The crystalline WO3 structure consists of stacking of infinite corner-sharing WO6 octahedra layers, while (b) the defects in W18O49 structure lead to the formation of hexagonal channels.
Raman enhancement for W18O49 sample
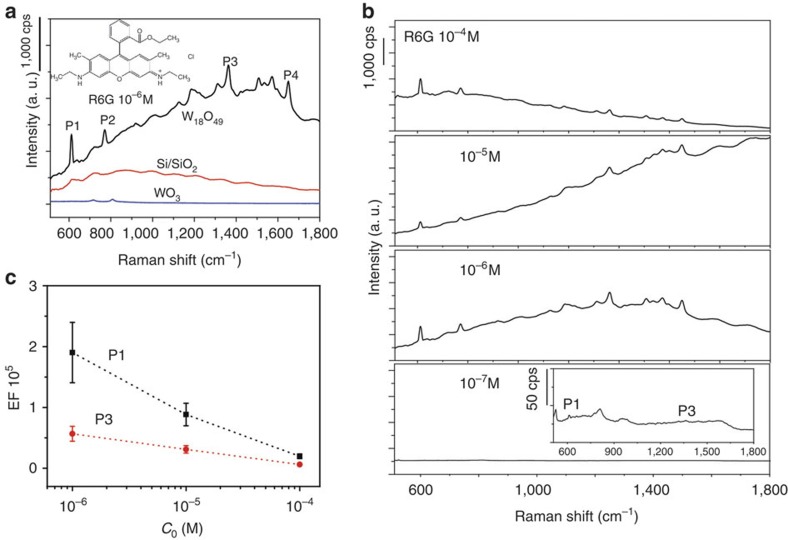
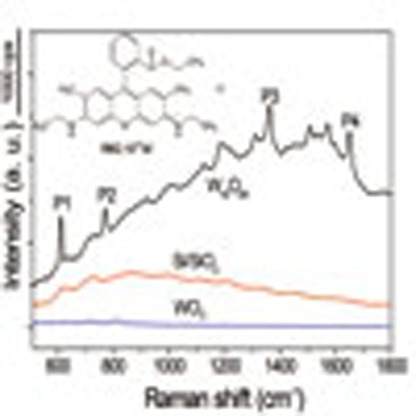
The Raman enhancement behaviour of the materials was examined using laser dye Rhodamine 6G (R6G) as a Raman probe, the molecular structure of which is provided in inset of Fig. 3a. R6G is a strongly fluorescent xanthene derivative that shows a molecular resonance effect when excited into its visible absorption band. Figure 3a shows the Raman spectra of R6G (10−6 M) with the excitation wavelength being 532.8 nm on substrates deposited with W18O49 nanowires, annealed WO3, along with bare SiO2/Si. While no clear signals related with R6G molecule were discerned on bare SiO2/Si substrate and WO3 except the fluorescence background, a substantial Raman enhancement was observed on W18O49, and four characteristic bands of R6G centred at 612, 773, 1,360 and 1,650 cm−1, named as P1, P2, P3 and P4, were clearly detected, which suggests that W18O49 could work as SERS-active substrate. Raman characterizations on bare W18O49 in the absence of probe molecules were also performed, in which only the signals related to O–W–O bending and W–O stretching modes were found (Supplementary Fig. 1), further confirming that the P1, P2, P3 and P4 bands originated from R6G molecules. P1 and P2 can be assigned to in-plane and out-of-plane bending motions of carbon and hydrogen atoms of the xanthenes skeleton, respectively; P3 and P4 correspond to aromatic C–C stretching vibration modes20. Raman spectra at four different R6G concentrations (the range was selected according to adsorption isotherms in Supplementary Fig. 2), decreasing from 10−4, 10−5 and 10−6 to 10−7 M, were collected, showing obvious intensity enhancement until an extreme dilute solution was used, 10−7 M, in which just detectable signal was obtained (Fig. 3b). Therefore, the detection limit for W18O49 material can be determined to be 10−7 M. Such a low detection limit enables a high sensitivity towards trace amounts of analyte molecules, and makes it possible for a systematic investigation of different vibration modes in the SERS profiles.
Figure 3. SERS properties.
(a) Raman profile of R6G (10−6 M) on substrates deposited with W18O49 sample compared with that for WO3 and bare SiO2/Si substrate. Inset: molecule structure of R6G. (b) Raman spectra collected for W18O49 at four different concentrations, 10−4, 10−5, 10−6 and 10−7 M, suggesting the detection limit was as low as 10−7 M (Inset: with narrowed y scale for 10−7 M). (c) The statistical evolution of EF as a function of R6G concentration plotted in logarithmic scale, with the analysis carried out over 30 different regions per sample. The Raman enhancement typically increased with decreasing concentrations and selective enhancement occurred with different bands.
Two signature bands, P1 and P3, were selected for calculating EFs based on the magnification of Raman intensity compared with that on bare substrate (details in Supplementary Methods)21,22,23, the variation of which was depicted in Fig. 3c as a function of R6G analyte concentrations (CR6G). It is clear that the greater enhancement occurs for P1 at each concentration, which was found to be surprisingly high as 1.9 × 10⁵ with the R6G concentration of 10−6 M, about 100–10,000 times higher than that previously reported for most other semiconductor SERS-active substrates (Supplementary Table 1). Furthermore, the intensity variation was not uniform and instead strongly dependent on the band identity. The selective enhancement of the different vibration modes indicates that the SERS on W18O49 sample largely depends on the distinct binding and geometry of R6G molecules on the W18O49 surface, which is a character of the chemical enhancement mechanism. Specifically, the change of P1 was more obvious than that for P3. The relative lower intensity exhibited by P3, especially at low concentrations, indicates that the long axis plane of R6G molecule was not parallel to the sample surface or the aromatic rings were separated by chemical groups including C–H bond24. With dilution of the R6G solutions, the signal intensity of P3 gradually increases, suggesting the gradual decrease of tilt angles of R6G molecules on the substrate. The emergence of greatly enhanced SERS sensitivity for W18O49 compared with WO3 can probably be attributed to the presence of oxygen vacancies in W18O49 structure (vide ante, Fig. 2).
Surface vacancy related Raman enhancement
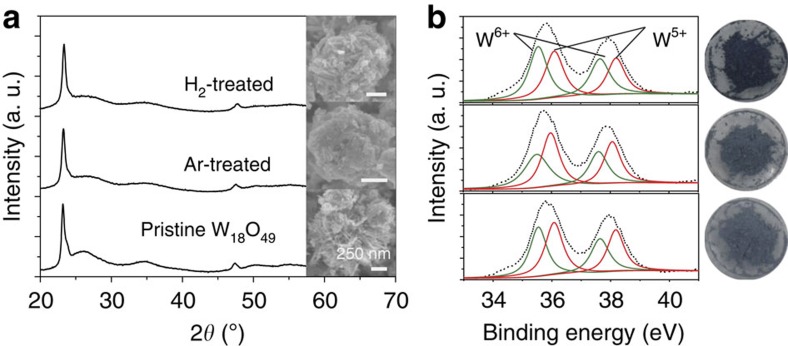
To confirm the role of oxygen vacancy played in SERS, additional surface vacancy was deliberately created by annealing the W18O49 sample in Ar/H2 atmosphere25. After the treatment at 300 °C for 1 h, the crystalline phase of W18O49 and the sea urchin-like morphology were still well kept (Fig. 4a). X-ray photoelectron spectroscopy was used to check the surface states, and Fig. 4b displays the spectra of W4f core levels for pristine W18O49 and the Ar/H2-treated samples. The W4f core-level spectra could be deconvoluted into three doublets (W6+, W5+ and W4+) for all samples. On the fitting analysis, it was found that the atomic percentage of W6+, W5+ and W4+ for pristine W18O49 was 54.1, 30.4 and 15.5%, roughly agreeing the documented values26. By contrast, the percentage for W5+ increased to 35.4 and 47.5%, W4+ to 21.4 and 13.9% for Ar and H2 thermal-treated samples, respectively. The increased percentage for reduced tungsten, W4+ and W5+, is likely to be related with the creation of positively charged oxygen vacancies with accompanying charge-compensating electrons27. With increasing oxygen vacancy, the intensity of the absorption tail in the visible and near-infrared region increased (Supplementary Fig. 3), consistent with the recorded results28. The sample colour changed from pale blue for pristine W18O49 to cyan and deep blue for Ar- and H2-treated samples, respectively, confirming the increment of oxygen deficiencies present in the examined samples.
Figure 4. Characterization of W18O49 samples with modulated surface oxygen vacancies.
(a) X-ray diffraction patterns of Ar- and H2-treated samples along with that for as-prepared W18O49 sample for comparison purpose, indicating that the crystalline phase remained during the annealing. Inset: the corresponding SEM images showing the morphology was also unchanged. (b) XPS spectra of W4f core levels for W18O49 samples after treatment in Ar and H2 atmosphere at 300 °C and pristine W18O49 sea urchin-like aggregates. Right: corresponding optical images of the three samples, showing colour change from pale blue for pristine W18O49 to cyan and deep blue for Ar- and H2-treated samples.
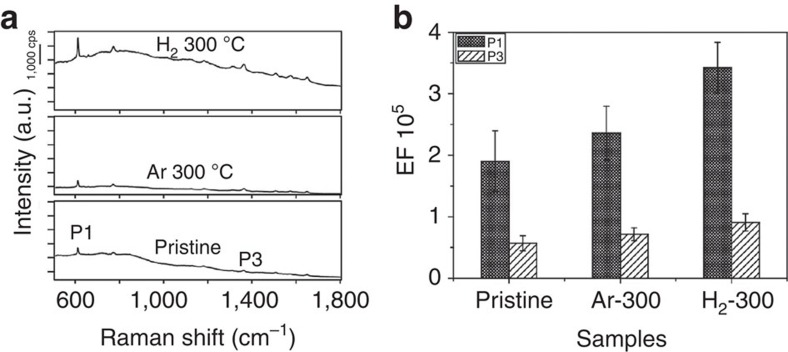
The Raman spectra of R6G with concentration of 1 × 10⁻⁶ M for the two treated samples are given in Fig. 5a along with the spectrum of pristine W18O49 sample for comparison. Both treated samples clearly manifested the four characteristic peaks of R6G molecule. Neither a new peak nor an obvious shift of the characteristic peak was detected, indicating that no formation or vanish of chemical bonds between R6G and the substrates were induced on oxygen vacancy alternation. Notably, the Ar- and H2-treated samples were found to display further Raman intensity increase on some degree compared with pristine W18O49 sample, corroborating the fact that oxygen vacancy may help increase Raman detect sensitivity. The Raman intensity of the four feature bands for all the three samples were summarized in Fig. 5b, and it is obvious that the Raman enhancement was in the order of H2-treated W18O49>Ar-treated W18O49>pristine W18O49. The P1 band of H2-treated W18O49 displayed the greatest enhancement, and the corresponding EF was evaluated to be 3.4 × 10⁵. Such high EF has been rarely observed in semiconducting materials, even comparable to that for noble metals without hot spots20, which may come from the combined function of intrinsic and deliberately created oxygen deficiencies.
Figure 5. Improved SERS properties of W18O49 samples after Ar/H2 annealing treatment.
(a) Raman signals of R6G molecule on pristine W18O49 and the samples after annealing treatment (in Ar/H2 at 300 °C for 1 h). The tested concentration of R6G was 1 × 10⁻⁶ M. (b) A comparison of Raman EF for the two respective vibration modes P1 and P3. Data reported in this histogram resulted from Raman spectra acquired over 30 different regions per sample and provide an indication of the EF for each Raman mode. The H2-treated sample shows the greatest enhancement at band P1, the EF for which was evaluated to be 3.4 × 10⁵.
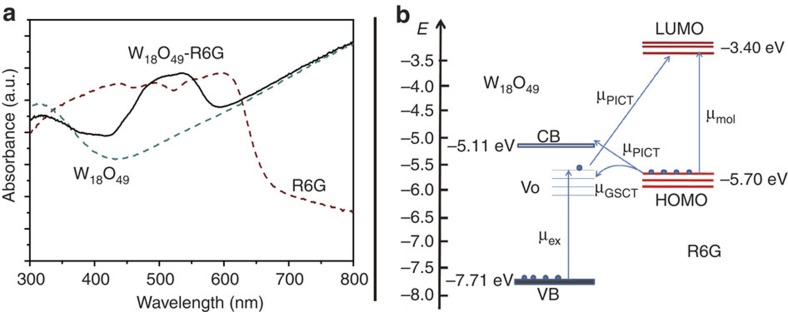
It seems the presence of oxygen vacancies in semiconducting oxide materials, either intrinsic ones or deliberately created on the surface, could bring significant Raman enhancement for R6G molecule. To examine the interaction between tungsten oxide materials with adsorbate molecule, ultraviolet–visible spectrum of R6G molecules deposited on W18O49 was collected in comparison with those for neat R6G and W18O49, which is presented in Fig. 6a. The spectrum for the hybrid features occurrence of a new band with an optical absorption onset at ∼580 nm. The band locates between the band–band transition absorption edge for W18O49, 420 nm, and the photoabsorption threshold for R6G dye, 670 nm, providing clear evidence for the efficient charge transfer between R6G and W18O49 material. This observation of high Raman enhancement on W18O49 may be based on the charge-transfer mechanism in an adsorbate–semiconductor system.
Figure 6. Charge transfer between R6G and W18O49.
(a) Absorption spectra for R6G on W18O49 compared with neat W18O49 and R6G dye. (b) Energy-level diagram of R6G on oxygen-deficit W18O49 measured in a vacuum.
Moreover, oxygen vacancy may play an irreplaceable role in enriching the surface states of semiconductor to provide magnified affinity for the adsorbent–adsorbate interaction, which results in a further increase to the Raman signals for the probe molecules adsorbed on the semiconductor substrate surface through charge transfer involved in a CM mechanism. Providing with efficient charge transfer processes between the matching energy levels of adsorbed probe molecules and the semiconductor, both the polarizability tensor and the electron density distribution of the molecule would be modified, leading to the observation of non-totally symmetric SERS modes. As shown in Fig. 6b, R6G as a typical SERS probe molecule has the highest-occupied molecular orbital and lowest-unoccupied molecular orbital levels at −5.70 and −3.40 eV, respectively29. The valence band and conduction band of semiconductor W18O49 locate at −7.71 and −5.11 eV (ref. 30),respectively, with oxygen vacancy-associated electronic state (VO) well separated from the bottom of the CB, located at about 0.5–1.0 eV below the conduction band minimum31. It can be expected that contributions from several types of thermodynamically feasible charge transfer resonance may be related to the overall Raman enhancement in our W18O49–R6G system at an excitation of 532 nm, including molecule resonance (μmol) of R6G, exciton resonance (μex) of W18O49 defect states, and the photon induced charge transfer resonance (μPICT) together with the ground-state charge transfer resonance (μGSCT) from matched energy level between W18O49 and R6G molecules. These resonances will lead to a magnification of Raman scattering cross-section.
In fact, defect state |V〉 stemming from oxygen vacancies in the lattice of semiconductor has a crucial contribution to the molecular polarizability tensor via the vibronic coupling with molecular ground state |I〉 and molecular excited states |K〉, besides the conduction band state |S〉 and valence band state |S′〉 of semiconductor (details are illustrated in Supplementary Methods). Under the incident laser frequency higher than the molecular resonance (ω0>ωIK), the polarizability tensor ασρ can be expressed by a simple formula ασρ=A+B+C32, where A represents the contribution of the molecular resonance. B and C represent the contributions from the photoinduced charge transfer of the molecule-to-semiconductor and semiconductor-to-molecule, respectively, which are both related to the defect states in the semiconductor. It can be evidenced that additional possible resonant contribute to the total enhancement in defect-rich semiconductor–molecule system, compared with its non-defect counterpart. When these predicted multiplicatively coincide, large EFs are expected (Supplementary Fig. 4). Thus, the observed high SERS enhancement indicates that modulation of the surface vacancy of semiconductor substrate is a simple but effective means in design of a molecule-semiconductor system with high SERS enhancement.
Discussion
In summary, metal-free SERS substrate with highly sensitive detection has been successfully fabricated employing non-stoichiometric tungsten oxide, W18O49 as an example, which achieved a limit detection as low as 10−7 M and EF up to 3.4 × 10⁵, an outstanding observation for semiconducting materials and even comparable to noble metal without ‘hot spots'. The oxygen vacancy played a critical role in amplifying the spectroscopic signatures of probe molecules, since tungsten trioxide, WO3, only gave extremely weak signals. Moreover, the artificial creation of oxygen deficiencies by annealing the material substrate in inert or reducing atmosphere (Ar/H2) brought about further Raman enhancements, providing unambiguous evidence that the presence of oxygen vacancy, either intrinsic or post-created ones, could help magnify the Raman signals. The extremely high SERS sensitivity on semiconducting materials can probably be attributed to the presence of oxygen deficiencies, either intrinsic or on the surface, and the resultant strengthened interaction with probe molecules via vibronic coupling. These observations provide important clues in the future strategy design of efficient semiconducting SERS substrate, and may bring important fundamental advance in material science and chemistry.
Methods
Synthesis of sea urchin-like W18O49 nanowires and WO3 nanoparticles on Si/SiO2
W18O49 nanowires in sea urchin-like morphology on Si/SiO2 substrate were prepared according to a recently published hydrothermal approach13. In brief, WCl6 (0.099 g) was dissolved in 30 ml absolute ethanol, which was transferred to a Teflon-lined stainless steel autoclave holding several horizontally oriented Si/SiO2 substrates. The autoclave was then sealed and heated at 180 °C for 12 h. After finishing the reaction, the substrates were rinsed thoroughly with absolute ethanol and dried naturally at room temperature before use. The W18O49 nanowires on substrate were transformed to the corresponding trioxide form, WO3, by annealing in air. The temperature was set at 500 °C and the sample was kept at the temperature for 1 h.
Modulating surface vacancy states
Modulation of the surface oxygen vacancy states was achieved through annealing the as-prepared W18O49 nanowires by heating in Ar/H2 atmosphere at 300 °C for 1 h. The velocity of Ar/H2 was fixed at 400 and 200 ml min−1, respectively.
Raman measurement
To study the Raman enhancement effect by the tungsten oxide materials, R6G dissolved in deionized water was employed to be the probe molecule because R6G has a large Raman scattering cross-section at the laser excitation wavelength applied for the SERS experiments, 532.8 nm (ref. 33). The tested concentration ranged from 10−4 to 10−7 M. Stock solution of 10−3 M was initially made, and solutions of other concentrations were obtained by successive dilution by factors of 101 or 102. After dropping an aliquot of the respective solutions on the substrate and drying for at least 5 h, Raman spectra were subsequently collected on a high-resolution confocal Raman spectrometer (LabRAM HR-800) using the same instrumental settings for ready comparisons. The excitation wavelength was 532.8 nm and a × 50 L objective was used to focus the laser beam. The spectra were acquired for 30 s with three accumulations and the laser power was maintained at 0.3 mW with an average spot size of 1 μm in diameter in all acquisitions. For each sample, Raman spectra from different areas were collected, and the signal intensity was averaged for final analysis, from which relative s.d. values for EFs were estimated (Supplementary Methods and Supplementary Figs 5–8).
Additional information
How to cite this article: Cong, S. et al. Noble metal-comparable SERS enhancement from semiconducting metal oxides by making oxygen vacancies. Nat. Commun. 6:7800 doi: 10.1038/ncomms8800 (2015).
Supplementary Material
Supplementary Figures 1-8, Supplementary Table 1, Supplementary Methods and Supplementary References
Acknowledgments
This work was supported by the National Natural Science Foundation of China (51372266), the Natural Science Foundation of Jiangsu Province (BK20130348) and Suzhou Industrial Science and Technology Programm (ZXG201426). F.G. acknowledges support from the National Natural Science Foundation of China (51402204), Thousand Young Talents Program and Jiangsu Specially-Appointed Professor Program. Y.Z. and Q.L. acknowledge the support of the National Natural Science Foundation of China (51202282) and National Basic Research Program by Ministry of Science and Technology (2011CB932600).
Footnotes
Author contributions Z.Z. and F.G. conceived the project and designed the experiments. S.C., Y.Y., Z.C., J.H., M.Y. and Y.S. performed material synthesis, structural characterization and Raman measurements. S.C., Y.Z., L.L., Q.L., F.G. and Z.Z. analysed the data. S.C., F.G. and Z.Z. co-wrote the paper. All authors discussed the results and commented on the manuscript.
References
- Chang R. K. & Furtak T. E. Surface Enhanced Raman Scattering Plenum Press (1982). [Google Scholar]
- Campion A. & Kambhampati P. Surface-enhanced Raman scattering. Chem. Soc. Rev. 27, 241–250 (1998). [Google Scholar]
- Nie S. & Emory S. R. Probing single molecules and single nanoparticles by surface-enhanced Raman scattering. Science 275, 1102–1106 (1997). [DOI] [PubMed] [Google Scholar]
- Kneipp J., Kneipp H. & Kneipp K. SERS-a single-molecule and nanoscale tool for bioanalytics. Chem. Soc. Rev. 37, 1052–1060 (2008). [DOI] [PubMed] [Google Scholar]
- Lombardi J. R. & Birke R. L. A unified view of surface-enhanced Raman scattering. Acc. Chem. Res. 42, 734–742 (2009). [DOI] [PubMed] [Google Scholar]
- Quagliano L. G. Observation of molecules adsorbed on III-V semiconductor quantum dots by surface-enhanced Raman scattering. J. Am. Chem. Soc. 126, 7393–7398 (2004). [DOI] [PubMed] [Google Scholar]
- Li W. et al. CuTe nanocrystals: shape and size control, plasmonic properties, and use as SERS probes and photothermal agents. J. Am. Chem. Soc. 135, 7098–7101 (2013). [DOI] [PubMed] [Google Scholar]
- Jiang L. et al. Surface-enhanced Raman scattering spectra ofadsorbates on Cu2O nanospheres: charge-transfer andelectromagnetic enhancement. Nanoscale 5, 2784–2789 (2013). [DOI] [PubMed] [Google Scholar]
- Musumeci A. et al. SERS of semiconducting nanoparticles (TiO2 hybrid composites). J. Am. Chem. Soc. 131, 6040–6041 (2009). [DOI] [PubMed] [Google Scholar]
- Qi D., Lu L., Wang L. & Zhang J. Improved SERS sensitivity on plasmon-free TiO2 photonic microarray by enhancing light-matter coupling. J. Am. Chem. Soc. 136, 9886–9889 (2014). [DOI] [PubMed] [Google Scholar]
- Li L. et al. Metal oxide nanoparticle mediated enhanced Raman scattering and its use in direct monitoring of interfacial chemical reactions. Nano Lett. 12, 4242–4246 (2012). [DOI] [PubMed] [Google Scholar]
- Abe R., Takami H., Murakami N. & Ohtani B. Pristine simple oxides as visible light driven photocatalysts: highly efficient decomposition of organic compounds over platinum-loaded tungsten oxide. J. Am. Chem. Soc. 130, 7780–7781 (2008). [DOI] [PubMed] [Google Scholar]
- Tian Y. et al. Synergy of W18O49 and polyaniline for smart supercapacitor electrode integrated with energy level indicating functionality. Nano Lett. 14, 2150–2156 (2014). [DOI] [PubMed] [Google Scholar]
- Cong S., Tian Y., Li Q., Zhao Z. & Geng F. Single-crystalline tungsten oxide quantum dots for fast pseudocapacitor and electrochromic applications. Adv. Mater. 26, 4260–4267 (2014). [DOI] [PubMed] [Google Scholar]
- Manthiram K. & Alivisatos A. P. Tunable localized surface plasmon resonances in tungsten oxide nanocrystals. J. Am. Chem. Soc. 134, 3995–3998 (2012). [DOI] [PubMed] [Google Scholar]
- Remškar M. et al. W5O14 nanowires. Adv. Funct. Mater. 17, 1974–1978 (2007). [Google Scholar]
- Sundberg M. The crystal and defect structures of W25O73, a member of the homologous series WnO3n-2. Acta Crystallogr. Sec. B 32, 2144–2149 (1976). [Google Scholar]
- Guo C. et al. Morphology-controlled synthesis of W18O49 nanostructures and their near-infrared absorption properties. Inorg. Chem. 51, 4763–4771 (2012). [DOI] [PubMed] [Google Scholar]
- Viswanathan K., Brandt K. & Salje E. Crystal structure and charge carrier concentration of W18O49. J. Solid State Chem. 36, 45–51 (1981). [Google Scholar]
- Hildebrandt P. & Stockburger M. Surface-enhanced resonance Raman spectroscopy of Rhodamine 6G adsorbed on colloidal silver. J. Phys. Chem. 88, 5935–5944 (1984). [Google Scholar]
- Le Ru E. C., Blackie E., Meyer M. & Etchegoin P. G. Surface enhanced Raman scattering enhancement factors: a comprehensive study. J. Phys. Chem. C 111, 13794–13803 (2007). [Google Scholar]
- Hsiao W.-H. et al. Surface-enhanced Raman scattering imaging of a single molecule on urchin-like silver nanowires. ACS Appl. Mater. Interfaces 3, 3280–3284 (2011). [DOI] [PubMed] [Google Scholar]
- Lal S., Grady N. K., Goodrich G. P. & Halas N. J. Profiling the near field of a plasmonic nanoparticle with Raman-based molecular rulers. Nano Lett. 6, 2338–2343 (2006). [DOI] [PubMed] [Google Scholar]
- Yang H. et al. Comparison of surface-enhanced Raman scattering on graphene oxide, reduced graphene oxide and graphene surfaces. Carbon 62, 422–429 (2013). [Google Scholar]
- Naldoni A. et al. Effect of nature and location of defects on bandgap narrowing in black TiO2nanoparticles. J. Am. Chem. Soc. 134, 7600–7603 (2012). [DOI] [PubMed] [Google Scholar]
- Jeon S. & Yong K. Synthesis and characterization of tungsten oxide nanorods from chemical vapor deposition-grown tungsten film by low-temperature thermal annealing. J. Mater. Res. 23, 1320–1326 (2008). [Google Scholar]
- He X. W. et al. Memristive properties of hexagonal WO3 nanowires induced by oxygen vacancy migration. Nanoscale Res. Lett. 8, 50 (2013). [DOI] [PMC free article] [PubMed] [Google Scholar]
- Xi G. et al. Ultrathin W18O49 nanowires with diameters below 1 nm: synthesis, near-infrared absorption, photoluminescence, and photochemical reduction of carbon dioxide. Angew. Chem. Int. Ed. 51, 2395–2399 (2012). [DOI] [PubMed] [Google Scholar]
- Ling X. et al. Can graphene be used as a substrate for Raman enhancement? Nano Lett. 10, 553–561 (2010). [DOI] [PubMed] [Google Scholar]
- Rawal S. B. et al. Design of visible-light photocatalysts by coupling of narrow bandgap semiconductors and TiO2: effect of their relative energy band positions on the photocatalytic efficiency. Catal. Sci. Technol. 3, 1822–1830 (2013). [Google Scholar]
- Wang et al. Semiconductor-to-metal transition in WO3−x: nature of the oxygen vacancy. Phys. Rev. B 84, 073103 (2011). [Google Scholar]
- Lombardi et al. Theory of surface-enhanced Raman scattering in semiconductors. J. Phys. Chem. C 118, 11120–11130 (2014). [Google Scholar]
- Shim S., Stuart C. M. & Mathies R. A. Resonance raman cross-sections and vibronic analysis of Rhodamine 6G from broadband stimulated Raman spectroscopy. ChemPhysChem 9, 697–699 (2008). [DOI] [PubMed] [Google Scholar]
Associated Data
This section collects any data citations, data availability statements, or supplementary materials included in this article.
Supplementary Materials
Supplementary Figures 1-8, Supplementary Table 1, Supplementary Methods and Supplementary References


