Abstract
Aim:
We evaluated the potential of magnetic resonance imaging (MRI) in the diagnosis of spinal infections and specifically its accuracy in differentiating tubercular and pyogenic spondylodiscitis.
Materials and Methods:
Totally, 50 patients referred for MRI scans with the clinical diagnosis of spinal infections were included in our study. The patients were classified as tubercular (TS), pyogenic (PS), and indeterminate spondylodiscitis on the basis of imaging findings and were correlated with the final diagnosis made by histopathology/cytology/culture/biochemistry or with successful therapeutic outcome. Imaging findings were subsequently analyzed for differentiating tubercular and pyogenic spondylodiscitis using the Chi-square test.
Results:
The most common pattern of spinal infection was spondylodiscitis (78% incidence rate) with epidural extension (86%) and cord compression (64%) being most common complications observed. Imaging (postcontrast study) and final diagnosis correlated in 93.7% tubercular (sensitivity of 75% and specificity of 90%) and 75% pyogenic (sensitivity of 90% and specificity of 83.3%) spondylodiscitis. The patients with tubercular spondylitis had a significantly (P < 0.05) higher incidence of following MRI findings: A well-defined paraspinal abnormal signal (80% in TS vs. 40% in PS), a thin and smooth abscess wall (84.2% in TS vs. 10% in PS), presence of intraosseous abscess (35% in TS vs. 0% in PS), focal and heterogenous enhancement of the vertebral body (75% in TS vs. 20% in PS), vertebral destruction more than or equal to grade 3 (71.8% in TS vs. 0% in PS), loss of cortical definition (75% in TS vs. 20% in PS), and spinal deformity (50% in TS vs. 5% in PS).
Conclusion:
Contrast-enhanced images improve the sensitivity and specificity of detection and differentiation of tubercular and PS.
Keywords: Cortical destruction, magnetic resonance imaging, spondylitis
INTRODUCTION
Infectious spondylitis[1] and pyogenic spondylodiscitis represent 4-7%[2] and 2-4%[3] of all cases of osteomyelitis, respectively. Musculoskeletal involvement occurs in 1.5-3% of all Mycobacterium tuberculosis infections with significant involvement of the spine.[4] The classic picture of vertebral osteomyelitis presents as destruction of two or more contiguous vertebrae, disc infection, and a paraspinal mass/collection. The infection typically commences at the superior or inferior anterior vertebral body corner adjacent to discovertebral junction and spreads by subligamentous extension and penetration of the subchondral plate. Abscesses may track for considerable distances beneath the anterior or posterior longitudinal ligament and may discharge by sinus tracts in an unusual location, such as the groin, buttock, or chest.[5]
Functionally, spinal infections can affect anterior or posterior portion of the spine or the spinal canal.[4] On a magnetic resonance imaging (MRI), spinal infections present as an increase in fluid signal due to narrow edema with signal decrease in T1-weighted and signal increase in T2-weighted sequences. Enhancement with contrast medium is typical and can be positive when signal change related to edema is not evident.[4] The signal increase on T2-weighted images in the vertebral body and to an extent within the intervertebral disc can be difficult to appreciate,[6] however, this can be overcome by fat-suppressed techniques, such as short tau inversion recovery.
Infection with M. tuberculosis is the most common granulomatous disease of the spine affecting the thoracolumbar junction and lumbar spine.[4] Vertebral body destruction is common in spinal tuberculosis (up to 73%), and this makes spinal deformity with gibbus or vertebra plana and neurologic compromise more common than in other infections. The discs are often spared for a long time due to the lack of proteolytic enzymes, but eventually the disc is involved in 75% of cases.[5] Multiple sites of involvement are more common in tuberculosis. Involvement of the posterior elements (>40% of cases) is common in spinal tuberculosis. Paraspinal, epidural abscesses[7] arachnoiditis, meningitis, and infection of the spinal cord occur more frequently in tuberculosis of the spine than other spinal infections. Other findings are loculations of cerebrospinal fluid, subarachnoid nodular contrast-enhancing lesions, clumping of caudal nerve roots, and contrast enhancement of the nerve roots or cord.[8]
Large paravertebral abscesses, commonly seen in tuberculosis of the spine are often symmetrical and tend to be larger than in pyogenic infections.[9] Abscesses can track long distance with multiple sinuses to groin, buttock, and chest. Calcified abscess are often suggestive of tuberculosis; however, it can be ruled out if the air or fluid level is observed.[9]
The clinical presentation of pyogenic spinal infections is much more acute than that of spinal tuberculosis. Most pyogenic infections are caused by Staphylococcus aureus. The infection usually starts in the well-perfused anterolateral vertebral edge. Proteolytic enzymes help to spread the infection quickly to the intervertebral disc. The early spread to discs with loss of disc height and disc herniations is suggestive of pyogenic infection. Pyogenic infection usually spreads to contiguous vertebral bodies as opposed to tuberculosis or fungal infection, in which skip lesions are common.[4] Paravertebral abscesses are generally smaller than in tuberculosis and more often asymmetric. Involvement of the posterior elements is rather rare and occurs more commonly by spread from adjacent infectious foci (i.e., the facet joints).[5]
Magnetic resonance imaging[10] is the examination of choice today, here, we aimed to test its utility in differentiating tubercular and pyogenic spondylodiscitis.
MATERIALS AND METHODS
A total of 50 patients with the clinical diagnosis of spinal infections was included in this study. MR scan was performed using MAGNETOM Avanto 18 Channel 1.5 Tesla TIM MR Machine by Siemens India Ltd., in the Department of Radiodiagnosis, DMC and Hospital, Ludhiana, India.
Magnetic resonance protocol
The MRI protocol consisted of sagittal T1-weighted (TE 10/TR 550), sagittal T2-weighted (TE 108/TR 3600), fat-suppressed T2-weighted IR (TE 84/TR 3800/inversion time [TI] 160 ms), transaxial T2-weighted (TE 99/TR 5550) spin echo sequences. In addition, axial and sagittal fat-suppressed T1-weighted images (TE 30/TR 500) were obtained after intravenous administration of gadolinium. A 350 mm field of view and a 448 × 336 matrix with three acquisition averages were used. The slice thickness was 3 mm. The contrast was administered at 0.1 mmol/kg body weight guided by 5cc saline flush wherever possible.
The most involved disc and vertebral body in each patient were selected. The signal intensity of the involved disc/vertebrae on T1- and T2-weighted images was recorded as hypointense, isointense, hyperintense, or mixed. Findings were defined as inappreciable when the disc was completely destroyed. The degree of disc destruction was graded as complete, severe (>50%), moderate (<50%), or mild (normal height with signal change). Intact discs were also noted. The degree of vertebrae destruction was graded as: Grade 4 (<25% left), Grade 3 (25% to 50%), Grade 2 (50-75%), Grade 1 (>75%), Grade 0. Criteria used to differentiate tubercular and pyogenic infection on non contrast (Table A) and contrast (Table B) enhanced MRI is follows:
Table A.

Table B.

The subjects fulfilling 5 or more criteria on noncontrast MRI in each group were classified accordingly. Rest of the subjects were classified as indeterminate.
The subjects fulfilling 5 or more out of eight selected criteria on contrast-enhanced MRI for each group were classified accordingly. Rest of the subjects were classified as indeterminate.
The MRI diagnosis was subsequently correlated with histopathology/cytology/culture/biochemistry or with successful therapeutic outcome to look for the MR features helpful in differentiating spinal infections. The data were analyzed using descriptive statistics and Chi-square test.
RESULTS AND DISCUSSION
In spinal infections, the vertebral end plates are most commonly affected with subsequent involvement of the intervertebral discs, which is commonly termed as spondylodiscitis. The paravertebral tissues, the epidural space, intradural nerve roots, spinal meninges, and spinal cord can all be involved. In our study, the mean age of the patients was 50.4 years (range: 8-82 years) with a maximum number of subjects in the age group of 51-60 years. There was a predilection for males with male:female ratio 1.9:1. The mean interval from presentation to MRI was 10 weeks and 40% of subjects presented within 1-6 months period. In our study, noncontrast MR was done in 20 subjects and contrast enhanced in 30 subjects.
Noncontrast MRI features were able to identify tubercular infection with a sensitivity and specificity of 75%. However, pyogenic infection was identified with a sensitivity of 37.5% and specificity of 75%. There is a paucity of data for MRI features differentiating tubercular and pyogenic infection on noncontrast MRI scans [Figures 1 and 2, Table 1].
Figure 1.
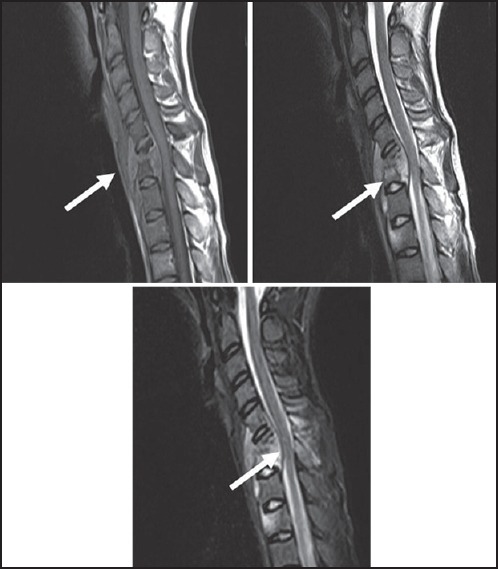
Tubercular Spondylodiscitis — Sagittal T1, T2 and STIR images show anterior wedging of C6 and C7 vertebral bodies. Disc at C6-7 level is inappreciable on T1 and T2W images. Subligamentous spread (from C5-D2) and anterior epidural soft tissue(C5-7) is seen
Figure 2.
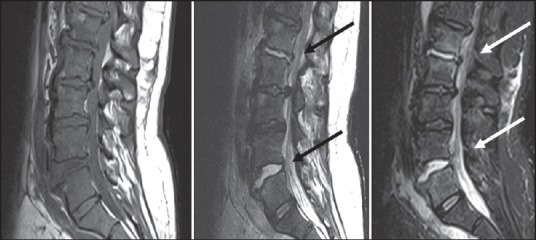
Pyogenic spondylodiscitis — Sagittal T1, T2 and STIR images: Areas of altered signal intensity appearing iso intense on T1, mildly hyperintense on T2/STIR images are seen involving L1-2 and L4-5 vertebrae. Intervening discs show hyperintense signal on T2W images with bright disc sign s/o discitis. Patient had a pus discharging wound in lumbar region, culture revealed E. coli.
Table 1.
Sensitivity and specificity on noncontrast MRI differentiating tubercular and pyogenic infection

Contrast-enhanced MRI features were able to identify tubercular infection with a sensitivity of 75% and specificity of 90% [Table 2]. Pyogenic infection was identified with a sensitivity of 90% and specificity of 83.3%. Thus, contrast-enhanced MRI improved the sensitivity and specificity for differentiating spinal infections, which is consistent with a previous study [Table 2].[1]
Table 2.
Sensitivity and specificity on contrast-enhanced MRI differentiating tubercular and pyogenic infection

Spondylodiscitis is frequently observed in the tubercular type (87.5%) than the pyogenic type (61.1%). Isolated epidural abscesses and facet joint infective arthritis were observed in pyogenic type [11.1% and 5.5%, respectively; [Figures 3 and 4, Table 3]. Isolated infectious spondylitis was also observed in both the groups (6.2% in tubercular and 11.1% in pyogenic).
Figure 3.
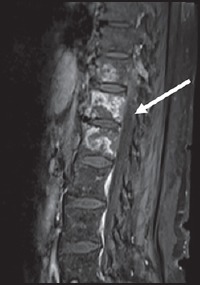
Intraosseous abscesses in tubercular spondylitis — Spondylitis without discitis: T1 post contrast saggital images show heterogenous enhancement of the D11-L1 vertebare with intraosseous abscesses. Intervertebral discs are normal
Figure 4.
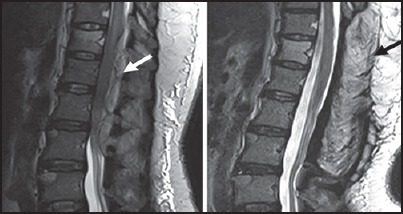
Isolated epidural abscesses: Pyogenic infection — T2 sagittal images before and after L1-3 laminectomy. A: Posterior epidural soft tissue is seen at D12-L3 level causing compression of the lower dorsal cord with cord edema. B: After laminectomy and drainage of pus no collection is seen. Pus culture revealed growth of gram positive cocci
Table 3.
Distribution of subjects according to the pattern of spinal infections in TB and pyogenic groups

In a previous study[13] comprising 46 patients with pyogenic spinal infections, spondylodiscitis was observed in 89% patients (61% in our study), isolated epidural abscesses in 2% patients (11.1% in our study), and isolated spondylitis was observed in 2% (11.1% in our study). Sample variations may be responsible for such differences in incidence rates.[9]
In the tubercular group following complications were observed: Epidural extension (84%), cord compression (59%), spinal deformity (50%), meningitis (12%), intramedullary lesions, arachnoiditis, myelitis, and sinus tracts (3.1%) [Figures 5 and 6]. The higher frequency of complications such as epidural extension, cord compression, and spinal deformity observed in our study could be due to delayed presentation of the patients for imaging after the onset of disease resulting in significant vertebral destruction, collapse, epidural extension, and spinal deformity. In pyogenic group, complications observed were epidural extension (88%), cord compression (66%), spinal deformity, meningitis, sinus tracts (5.5% each), and arachnoiditis (11.1%), which are consistent with a previous study [Tables 3 and 4].[13]
Figure 5.
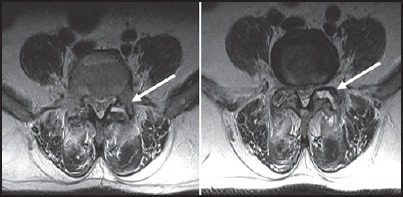
Isolated infective facetal arthropathy: Pyogenic — T2 axial images show left facet joint space at L4-5 and L5-S1 are widened with fluid signal intensity in them. Small loculated collections are seen in posterior paraspianl muscles
Figure 6.
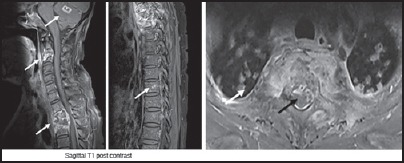
Disseminated tuberculosis — Multifocal involvement is seen in the form of intraparenchymal granulomas, multilevel spondylodiscitis, tiny vertebral granuloms and nodular lung lesions
Table 4.
Distribution of subjects according to the presence of complications
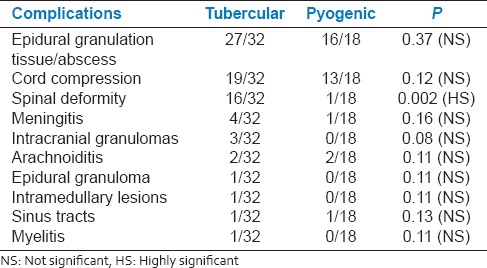
The most common site of involvement in tuberculosis was thoracic or thoracolumbar (46.8%) region, whereas in pyogenic spondylitis (PS), cervical spine (38.9%) was the most common site due to contiguous involvement of cervical vertebrae by retropharyngeal abscess, skull base osteomyelitis or carbuncle at nape of neck [Figure 7 and Table 4].
Figure 7.
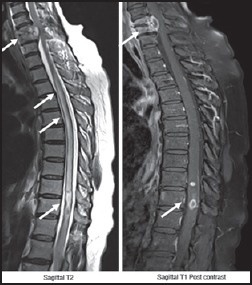
Tubercular spondylodiscitis with intramedullary granulomas and myelopathy — T2W images show hyperintense signal involving the dorsal cord s/o myelitis. Intramedullary rim enhancing granulomas are seen with spondylodiscitis at C5-6 level
In both the tuberculous and pyogenic groups, there was involvement of two vertebral bodies in the maximum number of cases (43.8% and 33.5%) which is consistent with a previous study.[12] Contiguous involvement of three or more than three vertebral bodies was 25% in tubercular group and 22% in the pyogenic group [Table 5].
Table 5.
Distribution according to the number of vertebrae involved and type of infection
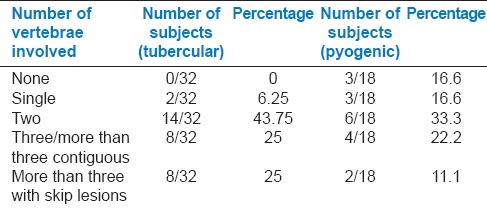
Skip lesions were observed in 25% of cases in tubercular group and 11.1% of cases with pyogenic infection. Involvement of three or more vertebral bodies in the whole spine was observed in 50% of subjects with tubercular infection and is more frequent than other series (14-22%) [Table 5].
Hypointense signal on T1-weighted images was observed in 81.2% and 80% of tubercular and pyogenic subjects, respectively. Hyperintense signal on T2-weighted images was observed in 40% subjects with tubercular and 60% subjects with pyogenic infection. Mixed signal on T2-weighted images was observed in 46% subjects with tubercular and 20% subjects with pyogenic infection. The variability in signal changes in the vertebral body could be due to partially treated tubercular disease in patients with known pulmonary kochs or due to widespread use of broad spectrum antibiotics in the patients with leukocytosis. About 71.8% (23/32) of the patients in the tubercular group had at least one vertebral body with destruction of Grade 3 or worse in contrast to the pyogenic group in which no more than grade 2 destruction of the vertebrae was observed. The rate of loss of cortical definition was higher in the tubercular group (24/32) than in the pyogenic group (3/15) and is comparable with previous reports.[12]
Consistent with previous report,[1] we did not observe any difference in the signal intensity of the intervertebral discs in tubercular or pyogenic infection, that is, isointense or inappreciable signal on T1-weighted images and hyperintense or inappreciable signal on T2-weighted images.
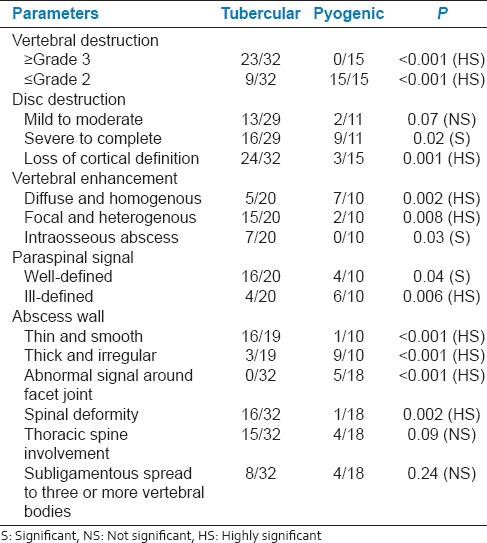
In our study, disc destruction was severe in pyogenic infection (81%) than in tubercular (55%) [Table 6]. 55% of the subjects with tubercular infection had disc destruction, which could be attributed to the late presentation for imaging after the onset of disease. Vertebral enhancement pattern in the tubercular group (15/20) was focal and heterogeneous, whereas the pattern in the pyogenic group (7/10) was diffuse and homogeneous, which is consistent other report.[12] Furthermore, vertebral intraosseous abscesses with rim enhancement were common in TB spondylitis (7/20) that is, 35% but not in PS[1,12] [Figure 8].
Table 6.
Distribution of subjects according to involved disc and vertebrae morphological characteristics
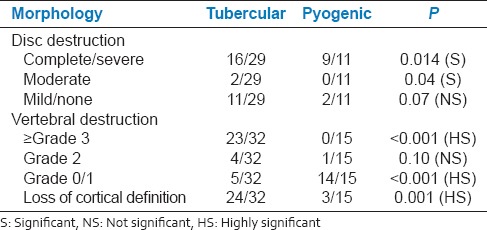
Figure 8.
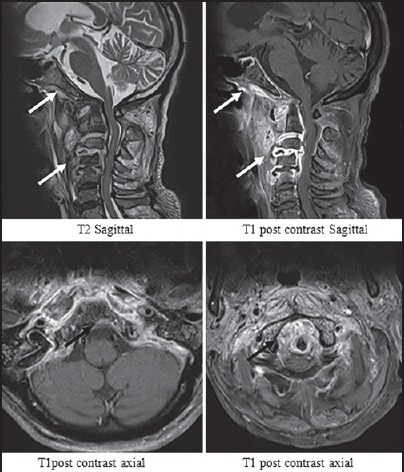
Pyogenic spondylodiscitis — Images show complete disc destruction with discal abscesses at C2-3, C3-4 and C4-5 levels and grade 1 destruction of vertebral bodies. Bones of the skull base show heterogenous enhancement. The paraspinal signal is ill defined. The abscess wall is thick and irregular
In our study, tubercular group had thin and smooth abscess wall in (16/19) cases. Pyogenic group had thick and irregular wall in (9/10) patients [Figure 7 and Table 7]. The enhancement pattern of the paraspinal soft tissue significantly differed between tuberculosis and pyogenic groups; the finding was well-defined in 16/20 versus 4/10 (P = 0.04) and ill-defined in 4/20 versus 6/10 subjects (P = 0.006), respectively [Figure 7]. The relative late phase and chronic course of tuberculous spondylitis contributed to the thinner and smoother abscess wall. The minimal inflammation of tuberculous abscess may also contribute to the thin and smooth appearance of an abscess wall. To conclude we have shown the utility of contrast-based MRI in differentially diagnosing tubercular and pyogenic spondylodiscitis.
Table 7.
Parameters assessed in differentiating tubercular and pyogenic spinal infections
Footnotes
Source of Support: Nil.
Conflict of Interest: None declared.
REFERENCES
- 1.Jung NY, Jee WH, Ha KY, Park CK, Byun JY. Discrimination of tuberculous spondylitis from pyogenic spondylitis on MRI. AJR Am J Roentgenol. 2004;182:1405–10. doi: 10.2214/ajr.182.6.1821405. [DOI] [PubMed] [Google Scholar]
- 2.Stäbler A, Reiser MF. Imaging of spinal infection. Radiol Clin North Am. 2001;39:115–35. doi: 10.1016/s0033-8389(05)70266-9. [DOI] [PubMed] [Google Scholar]
- 3.Varma R, Lander P, Assaf A. Imaging of pyogenic infectious spondylodiskitis. Radiol Clin North Am. 2001;39:203–13. doi: 10.1016/s0033-8389(05)70273-6. [DOI] [PubMed] [Google Scholar]
- 4.Tins BJ, Cassar-Pullicino VN. MR imaging of spinal infection. Semin Musculoskelet Radiol. 2004;8:215–29. doi: 10.1055/s-2004-835362. [DOI] [PubMed] [Google Scholar]
- 5.Moore SL, Rafii M. Imaging of musculoskeletal and spinal tuberculosis. Radiol Clin North Am. 2001;39:329–42. doi: 10.1016/s0033-8389(05)70280-3. [DOI] [PubMed] [Google Scholar]
- 6.Dagirmanjian A, Schils J, McHenry M, Modic MT. MR imaging of vertebral osteomyelitis revisited. AJR Am J Roentgenol. 1996;167:1539–43. doi: 10.2214/ajr.167.6.8956593. [DOI] [PubMed] [Google Scholar]
- 7.Dagirmanjian A, Schils J, McHenry MC. MR imaging of spinal infections. Magn Reson Imaging Clin N Am. 1999;7:525–38. [PubMed] [Google Scholar]
- 8.Sharma A, Goyal M, Mishra NK, Gupta V, Gaikwad SB. MR imaging of tubercular spinal arachnoiditis. AJR Am J Roentgenol. 1997;168:807–12. doi: 10.2214/ajr.168.3.9057539. [DOI] [PubMed] [Google Scholar]
- 9.Loke TK, Ma HT, Chan CS. Magnetic resonance imaging of tuberculous spinal infection. Australas Radiol. 1997;41:7–12. doi: 10.1111/j.1440-1673.1997.tb00459.x. [DOI] [PubMed] [Google Scholar]
- 10.Mahboubi S, Morris MC. Imaging of spinal infections in children. Radiol Clin North Am. 2001;39:215–22. doi: 10.1016/s0033-8389(05)70274-8. [DOI] [PubMed] [Google Scholar]
- 11.Harada Y, Tokuda O, Matsunaga N. Magnetic resonance imaging characteristics of tuberculous spondylitis vs. pyogenic spondylitis. Clin Imaging. 2008;32:303–9. doi: 10.1016/j.clinimag.2007.03.015. [DOI] [PubMed] [Google Scholar]
- 12.Chang MC, Wu HT, Lee CH, Liu CL, Chen TH. Tuberculous spondylitis and pyogenic spondylitis: Comparative magnetic resonance imaging features. Spine (Phila Pa 1976) 2006;31:782–8. doi: 10.1097/01.brs.0000206385.11684.d5. [DOI] [PubMed] [Google Scholar]
- 13.Ledermann HP, Schweitzer ME, Morrison WB, Carrino JA. MR imaging findings in spinal infections: Rules or myths? Radiology. 2003;228:506–14. doi: 10.1148/radiol.2282020752. [DOI] [PubMed] [Google Scholar]


