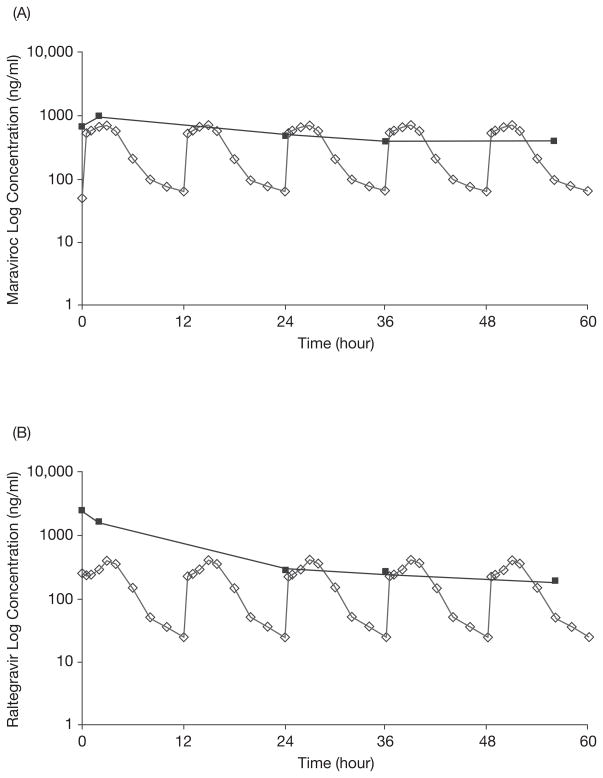
Figure 1.
(A) Steady-state maraviroc log concentration–time curve after a 300-mg dose (given at time 0) in the case patient (solid squares) compared with previously reported steady-state maraviroc log concentration–time curves after repeated maraviroc doses of 300 mg every 12 hours in subjects with normal renal and hepatic function (open diamonds).3 (B) Steady-state raltegravir log concentration–time curve after a 400-mg dose (given at time 0) in the case patient (solid squares) compared with previously reported steady-state raltegravir log concentration–time curves after repeated raltegravir doses of 400 mg every 12 hours in subjects with normal renal and hepatic function (open diamonds).5

